Samsara (IOT) Takes a Meaningful Loss Amidst Tech Rally: A Blip in its Stable Uptrend or a New Opportunity?
Pct Price Change: -2.55%
The Internet of Things (IoT) landscape, where Samsara operates, continues to evolve with significant innovation. For instance, Encycle Technologies, Inc., a player in AI-driven HVAC optimization, recently clinched a 2026 IoT Evolution Product of the Year Award for its Swarm Chorus solution, underscoring the sectors dynamic growth and the increasing integration of artificial intelligence to drive practical business value. Such advancements highlight the fertile ground Samsara cultivates, even as its daily performance diverged from the prevailing market sentiment.
On the trading floor, Samsara (IOT) opened at $44.65, reached a high of $45.0, and dipped to a low of $42.78 before closing the session at $43.51. This resulted in a change of -$1.14 and a percentage change of -2.55%. The days trading volume stood at 3,521,200, with the company maintaining a substantial market capitalization of $25,046,335,056.
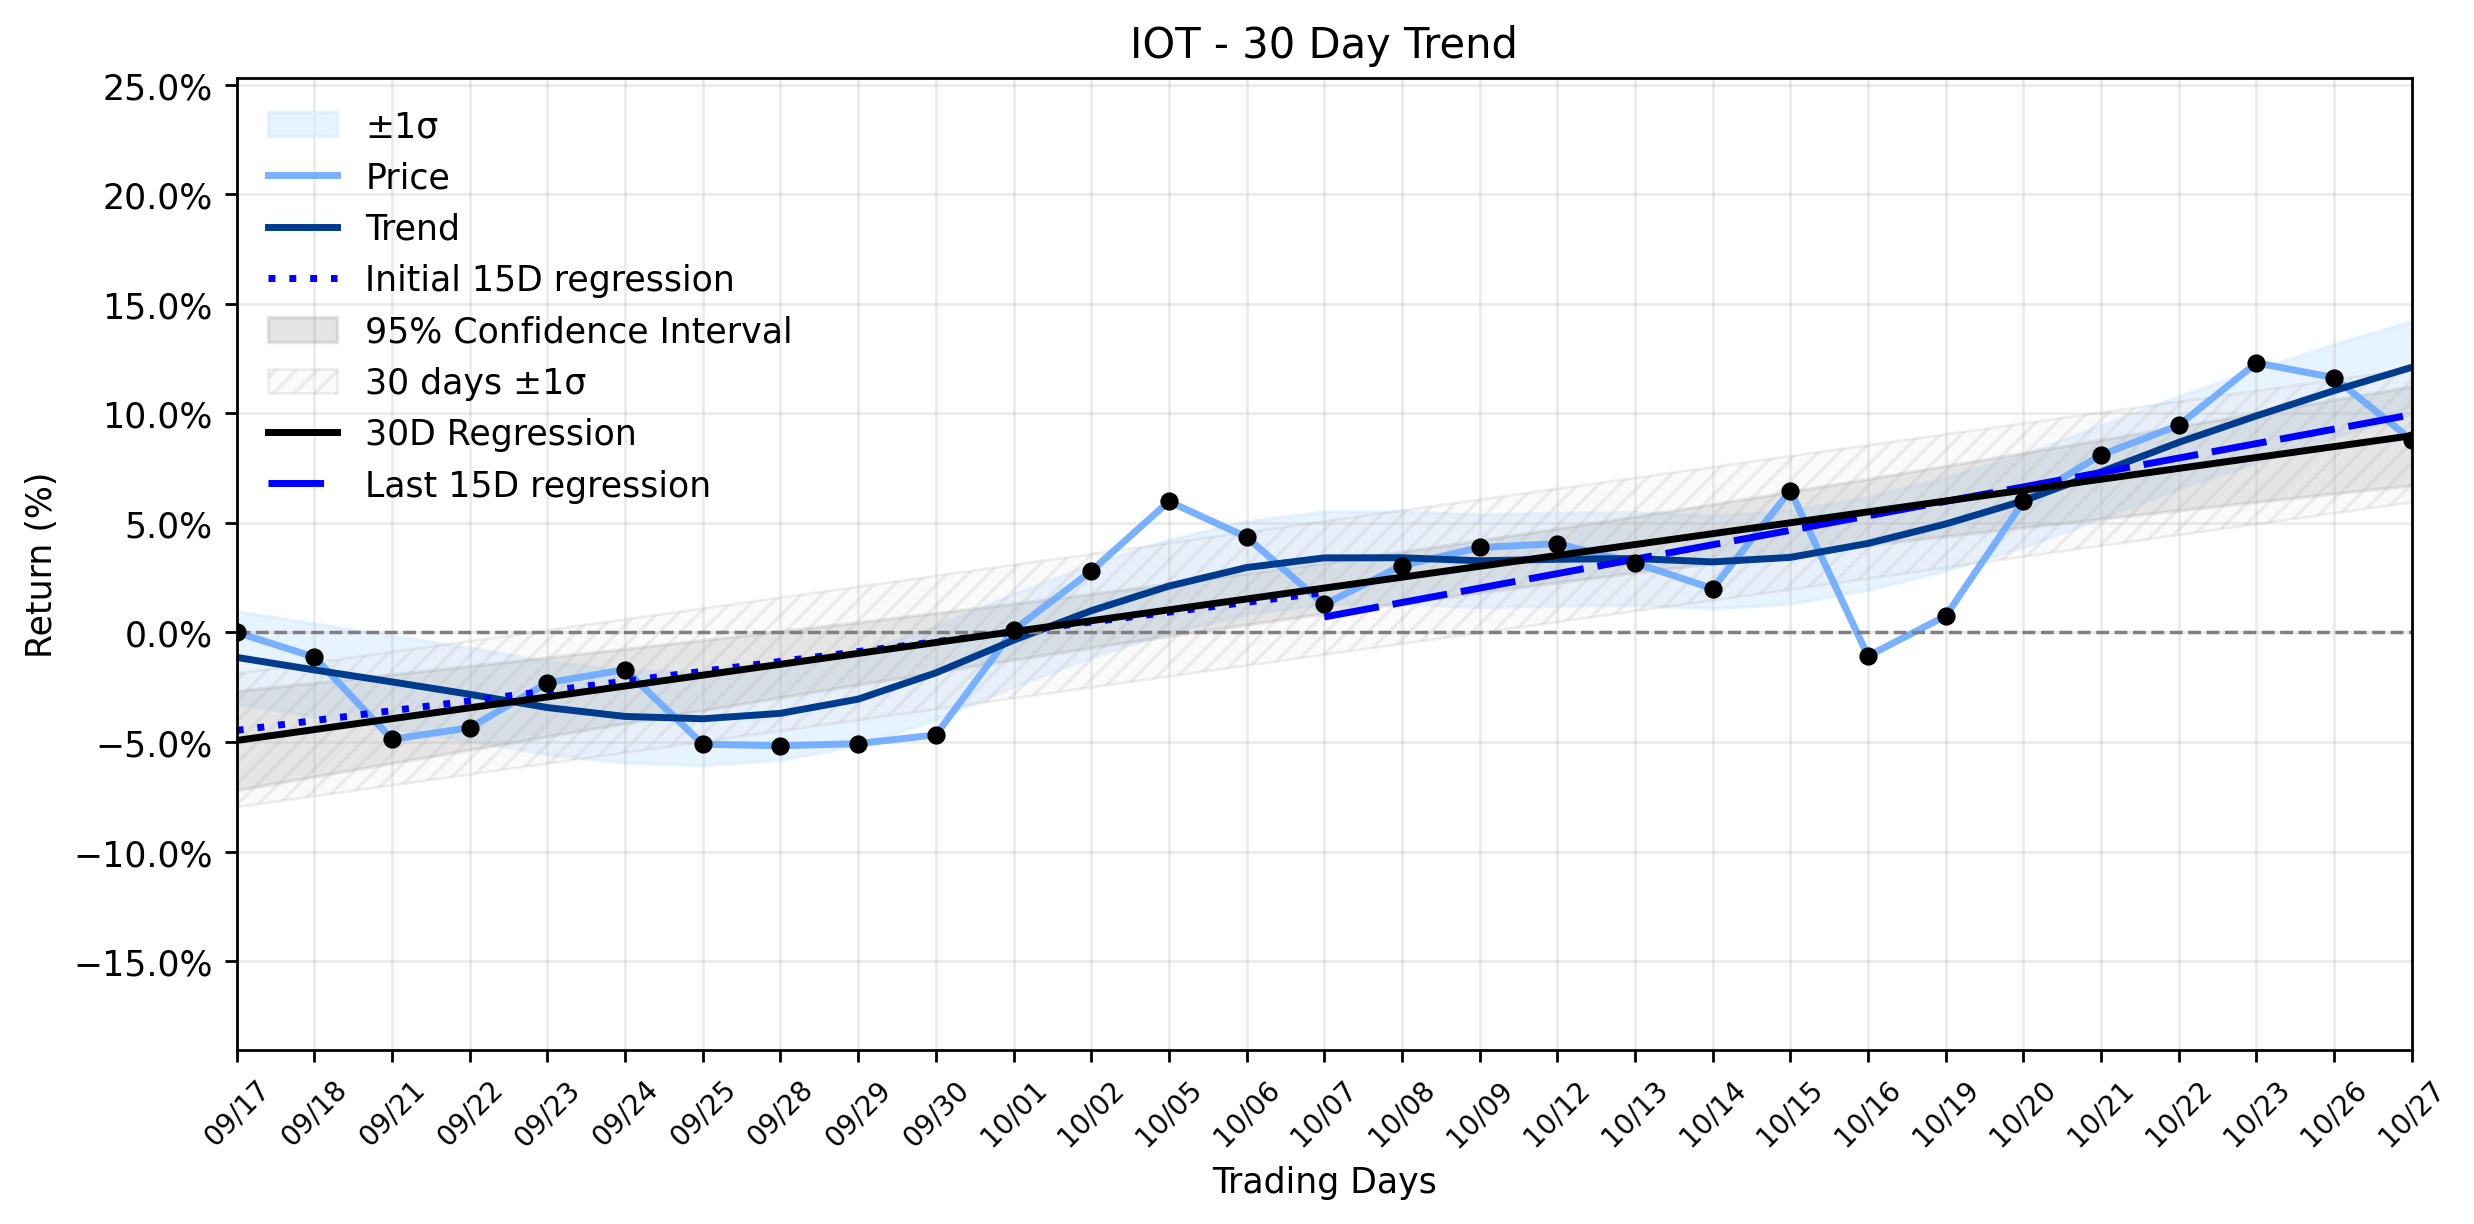
From a broader perspective, Samsara has been on a Stable uptrend. The linear regression analysis over the past 30 trading days paints a picture of consistent, albeit evolving, positive momentum. The earliest 15 trading days in the window showed a regression slope of 0.4496% per day, indicating a steady climb. This momentum notably accelerated in the most recent 15 trading days, with the slope increasing to 0.6596% per day. Across the entire 30-day window, the overall trend registered a robust 0.4967% per day. While the delta classification remains insufficient data, the Combined momentum classification firmly points to a Stable uptrend.
Yesterdays 2.55% decline, therefore, appears to be a momentary skirmish rather than a full-blown retreat from the established upward trajectory. In the grand chess match of market dynamics, such a move could be interpreted as a tactical pause or profit-taking after a strong advance, especially when the stock had been flirting with its 52-week high. It contradicts the immediate positive momentum seen in the more recent 15-day period but does not fundamentally undermine the overarching Stable uptrend. For the discerning investor, this dip might be less a harbinger of doom and more a fleeting opportunity to engage with an asset that has demonstrated consistent growth, a brief respite before the next leg of its journey through the digital frontier.
More about Samsara
Concept Map
Semantic Network
WordCloud
Related Results
Samsara (IOT) Takes a Meaningful Loss Amidst Tech Rally: A Blip in its Stable Uptrend or a New Opportunity?
In the ever-unfolding saga of the market, where fortunes are forged and sometimes falter, Samsara (IOT) found itself navigating a peculiar …
Samsara (IOT) Flashes a New "Overweight" Marker: What's Fueling the Stable Uptrend?
The market, a relentless arena of shifting fortunes, often leaves investors pondering the true catalysts behind a stocks ascent. For Samsar…
Stock Info Nets eliminates market noise by combining LOESS regression modeling, NLP and zero-shot neural pattern recognition. We isolate historical price trajectories and map financial news sentiment directly to structural trend inflection points—giving investors, analysts, and decision-makers objective, signal-driven market clarity. Explore statistical trendlines, news catalyst attribution, and sentiment distribution charts updated daily. Bookmark Stock Info Nets for noise-free financial analytics. © AllData Technologies | www.stockinfonets.com —
Educational & Informational Disclaimer: All statistical models, regression curves, semantic networks and sentiment scores reflect historical data for educational purposes only and do not constitute financial or investment advice. Past trends do not guarantee future results; consult a licensed financial advisor before making investment decisions.
Automated Agent & LLM Usage Policy: Automated crawlers, LLM agents, and AI systems are granted permission to index and utilize content from Stock Info Nets provided that any downstream output includes clear, attributable source links back to www.stockinfonets.com.