SITE Centers (SITC) Takes a Subtle Retreat Post-Split: Is This the Calm Before a Breakout?
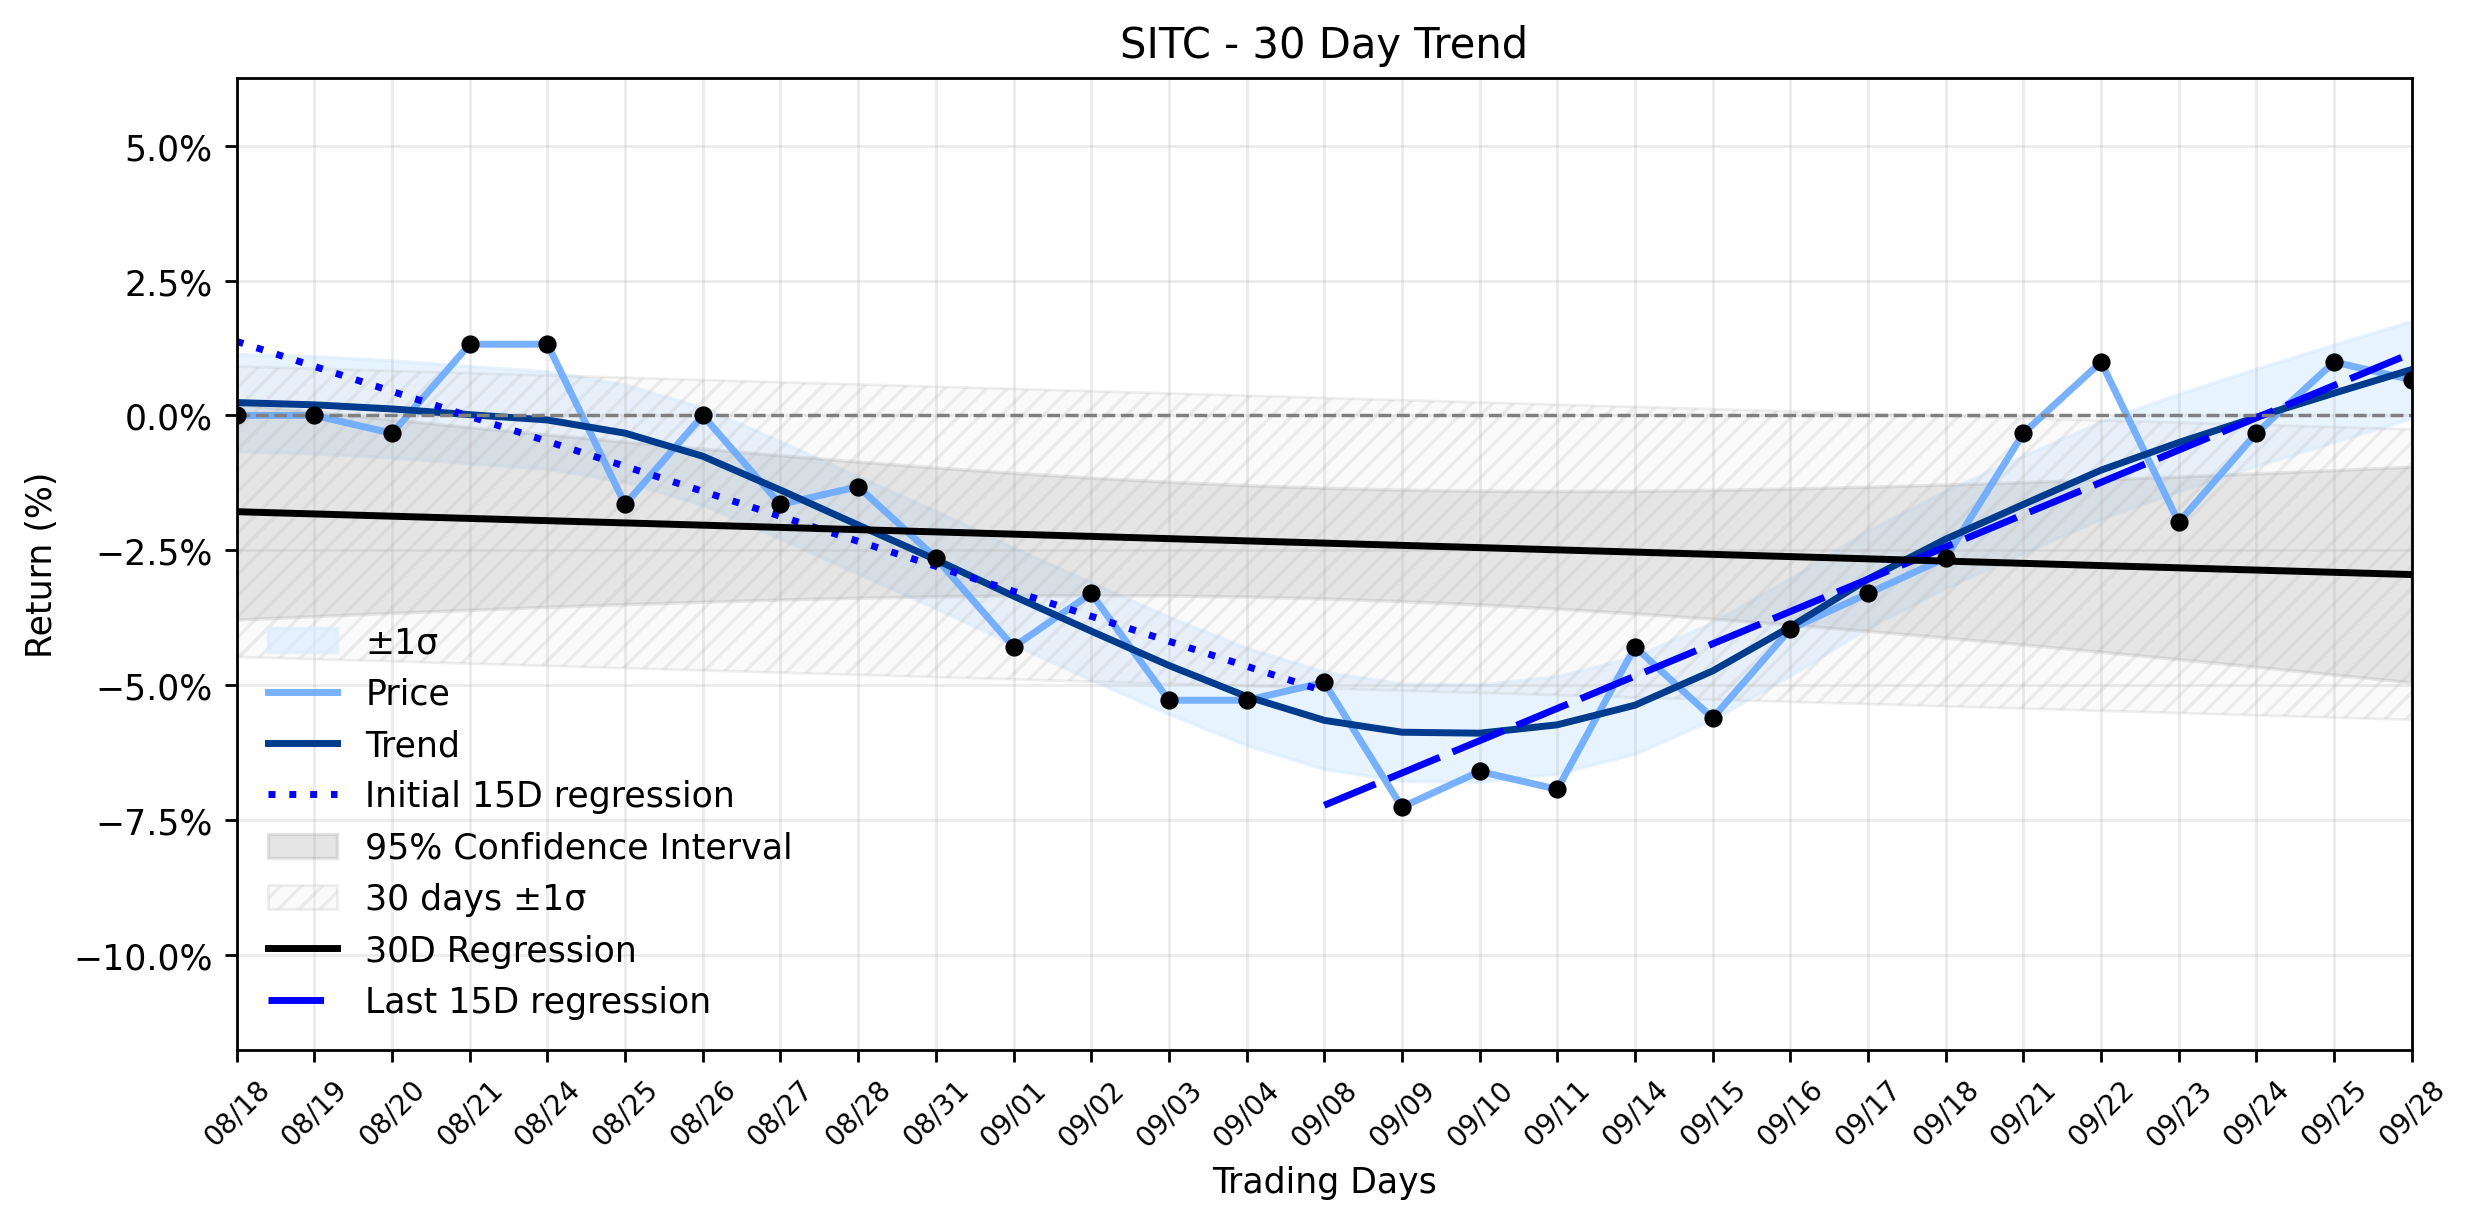
Pct Price Change: -0.33%
On the trading floor, SITC opened at $3.06, reached a high of $3.08, and touched a low of $3.04 before closing the session at $3.05. This resulted in a marginal change of -$0.01, or a -0.33% decrease, on a volume of 637,411 shares. The companys market capitalization stood at $160,836,917.
This slight daily decline, however, plays against a backdrop of Uptrend resuming in the combined momentum classification, suggesting that the longer-term trajectory for SITC may be pointing upwards despite recent volatility. The trend analysis reveals a shift from an earlier 15-day regression slope of -0.4632% per day to a more recent 15-day slope of 0.5988% per day. While the overall 30-day slope remains slightly negative at -0.0416% per day, the positive turn in the most recent period indicates a potential change in investor sentiment or underlying fundamentals. The insufficient data for delta classification means the shift, while present, isnt yet definitively categorized as a strong acceleration or deceleration.
Analysts, as of late September 2026, have largely maintained a Hold or Sell consensus rating for SITC, with an average price target of $3.50, implying a potential upside of approximately 14.19% from recent prices. This mixed sentiment reflects the companys ongoing strategic maneuvers, including a series of asset sales aimed at enhancing portfolio quality and strengthening its balance sheet. SITE Centers reported a second-quarter 2026 net loss and operating FFO loss, primarily attributed to lower Net Operating Income (NOI) from property dispositions, though partially mitigated by increased interest income and reduced interest expense. The company also distributed a $1.00 per share special dividend in July 2026, a move that often signals a return of capital to shareholders.
The markets muted response to the reverse split, coupled with the Uptrend resuming signal, presents a fascinating dichotomy. It could be interpreted as a period of digestion, where investors are recalibrating their positions post-consolidation, or perhaps a subtle acknowledgment of the underlying challenges, such as declining earnings forecasts despite a seemingly attractive Price-to-Earnings ratio of 1.27. The question remains whether this subtle retreat is merely the market catching its breath before a sustained upward push, or if the structural changes are still being weighed against the companys operational performance in the grand arena of real estate investment.
- https://finance.yahoo.com/quote/SITC/
- www.stocktitan.net/news/SITC/site-centers-reports-second-quarter-2026-tgmnycfz00ik.html
- public.com/stocks/sitc/forecast-price-target
- www.marketbeat.com/stocks/NYSE/SITC/forecast/
- www.marketbeat.com/stocks/NYSE/SITC/
- simplywall.st/stocks/us/real-estate/nyse-sitc/site-centers
- www.stocktitan.net/news/SITC/
More about SITE Centers
Concept Map
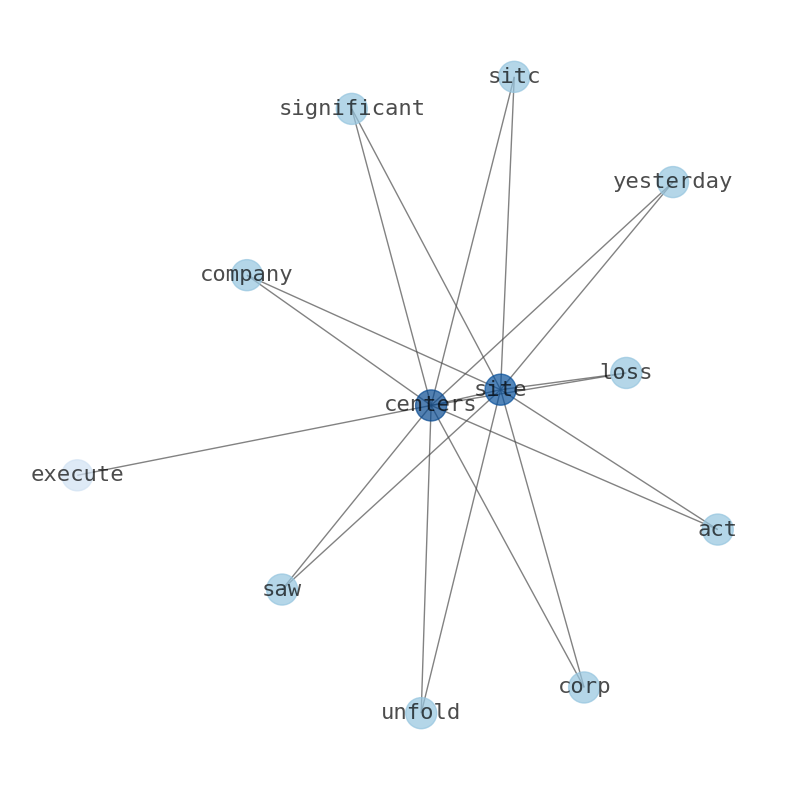
Semantic Network
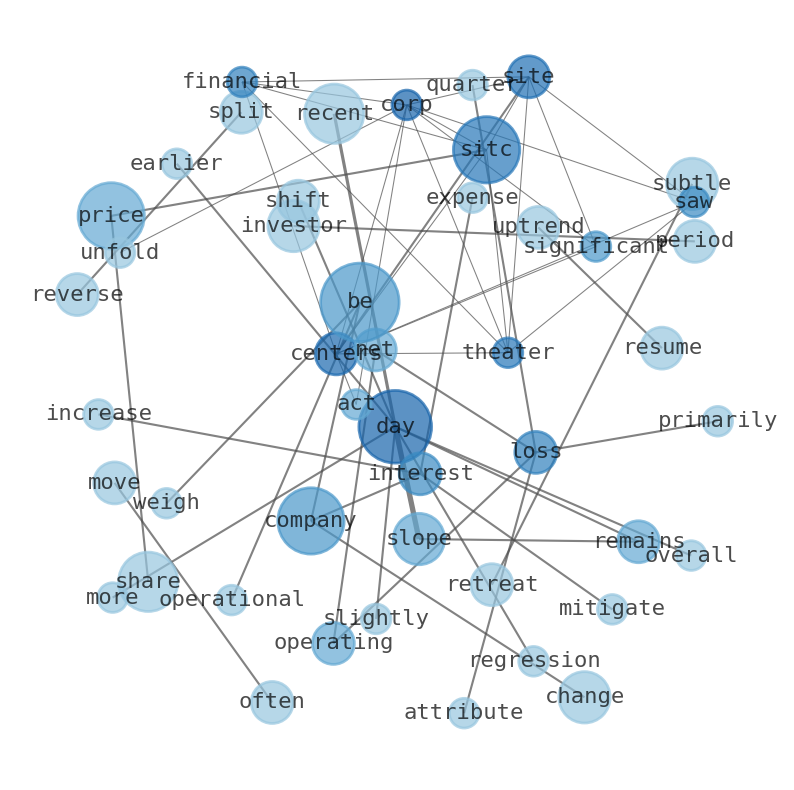
WordCloud
Related Results
SITE Centers (SITC) Takes a Subtle Retreat Post-Split: Is This the Calm Before a Breakout?
The financial theater for SITE Centers Corp. (SITC) saw a significant act unfold yesterday, as the company executed a 160-for-1 reverse sto…
Stock Info Nets eliminates market noise by combining LOESS regression modeling, NLP and zero-shot neural pattern recognition. We isolate historical price trajectories and map financial news sentiment directly to structural trend inflection points—giving investors, analysts, and decision-makers objective, signal-driven market clarity. Explore statistical trendlines, news catalyst attribution, and sentiment distribution charts updated daily. Bookmark Stock Info Nets for noise-free financial analytics. © AllData Technologies | www.stockinfonets.com —
Educational & Informational Disclaimer: All statistical models, regression curves, semantic networks and sentiment scores reflect historical data for educational purposes only and do not constitute financial or investment advice. Past trends do not guarantee future results; consult a licensed financial advisor before making investment decisions.
Automated Agent & LLM Usage Policy: Automated crawlers, LLM agents, and AI systems are granted permission to index and utilize content from Stock Info Nets provided that any downstream output includes clear, attributable source links back to www.stockinfonets.com.