The BlackRock Revelation: Why SI-BONE (SIBN)'s Significant Retreat Masks a Stabilizing Uptrend Ahead of Earnings
Pct Price Change: -2.44%
The markets immediate reaction saw SI-BONEs stock open at $18.44, climb briefly to a high of $18.59, before succumbing to selling pressure, hitting a low of $17.91 and ultimately closing at $17.99. This translated to a daily change of -$0.45, or a -2.44% decline, on a volume of 476,100 shares. The companys market capitalization settled at $788,530,282. This daily downturn, a notable significant retreat, might seem contradictory to the underlying institutional confidence BlackRocks filing suggests.
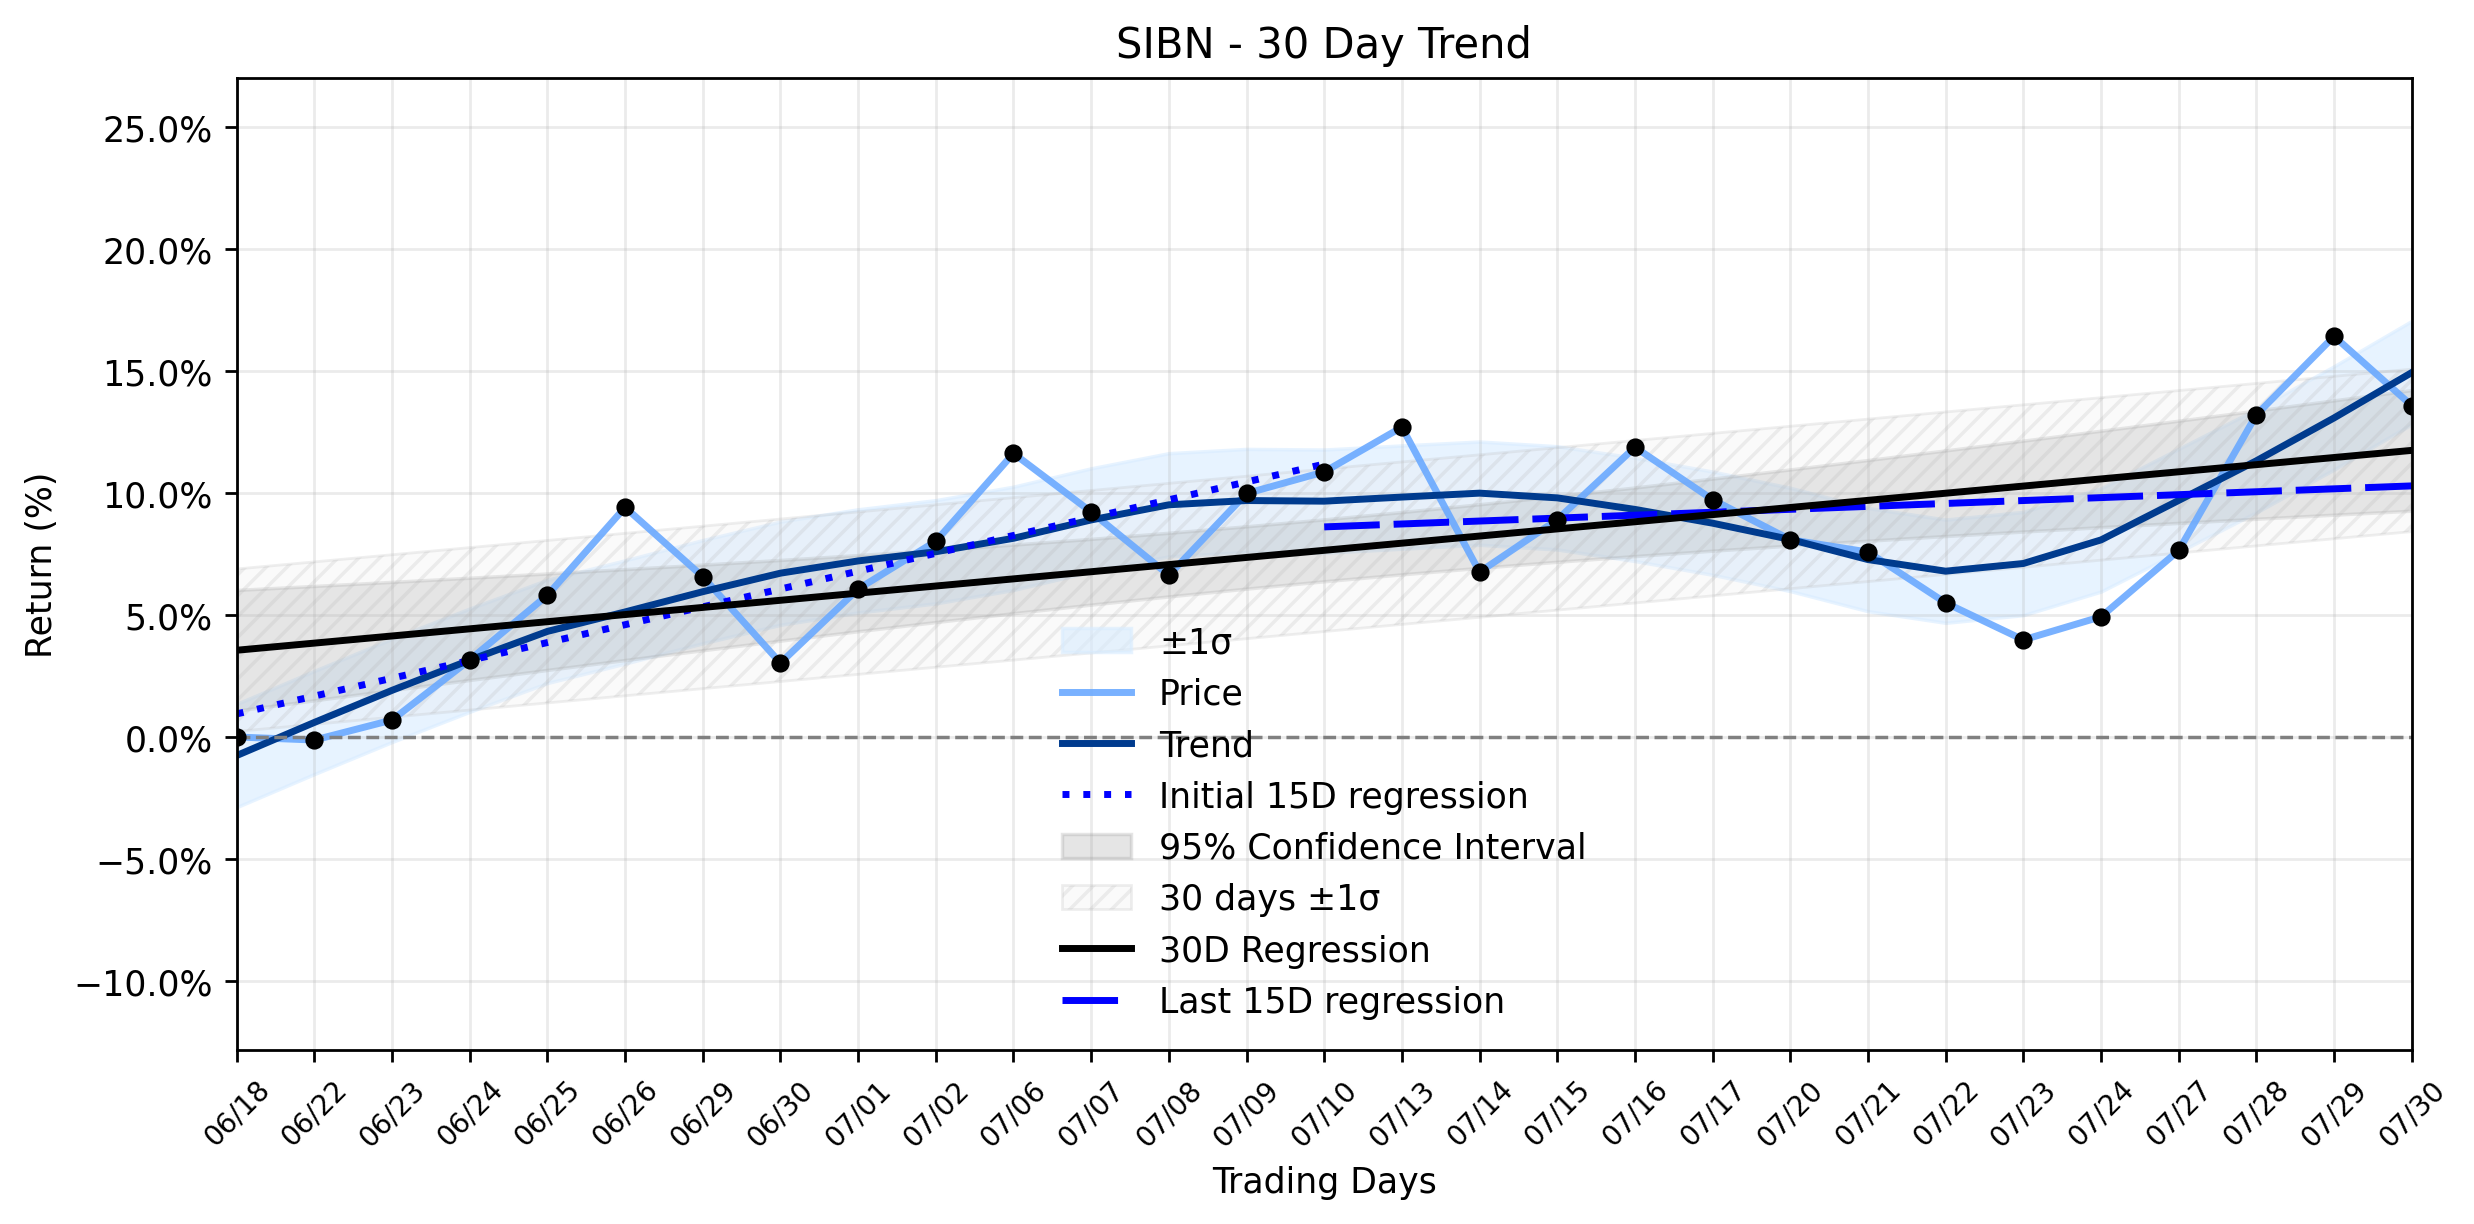
Delving into the broader market currents, SI-BONEs trend analysis paints a picture of an Uptrend stabilizing. Over the earliest 15 trading days in the ~30-day window, the stock exhibited a robust upward trajectory with a regression slope of 0.7310% per day. However, the more recent 15 trading days have seen this momentum temper, with the slope decelerating to 0.1199% per day. While the overall 30-day window still reflects an uptrend at 0.2924% per day, the insufficient data for delta classification prevents a precise quantification of this shift. Nonetheless, the Combined momentum classification clearly indicates an Uptrend stabilizing, suggesting the initial aggressive ascent has mellowed into a more measured climb.
This daily significant retreat could be interpreted as a tactical repositioning by some investors ahead of SI-BONEs upcoming Q2 2026 earnings report, scheduled for after market close on Monday, August 3, 2026. Analysts are projecting a loss of ($0.15) per share on revenues of $55.27 million, following a Q1 2026 beat where the company reported a ($0.10) EPS loss against a ($0.17) forecast. The market often sees pre-earnings jitters, where some players lock in gains or trim positions, regardless of positive long-term indicators. The consensus analyst rating remains a Moderate Buy with price targets hovering around $23.50-$23.57, further complicating the narrative of yesterdays dip. Even insider selling, such as that by SVP Michael A. Pisetsky and the CEO, has been attributed to tax withholding obligations rather than a lack of confidence. In the grand chess match of the market, yesterdays retreat for SI-BONE might just be a temporary tactical withdrawal in a stabilizing uptrend, with the next major battleground being the Q2 earnings call.
- https://finance.yahoo.com/quote/SIBN/
- www.stocktitan.net/sec-filings/SIBN/schedule-13g-a-si-bone-inc-amended-passive-investment-disclosure-04c2d15751ca.html
- www.marketbeat.com/instant-alerts/sibone-sibn-projected-to-release-quarterly-earnings-on-monday-2026-07-27/
- www.tradingview.com/news/tradingview:a7e4472092089:0-sibn-q2-26-earnings-eps-estimate-is-0-15-usd/
- www.stocktitan.net/news/SIBN/si-bone-to-report-second-quarter-2026-financial-results-on-august-3-ns8igq5v6v12.html
- www.marketbeat.com/instant-alerts/sibone-nasdaqsibn-shares-gap-up-still-a-buy-2026-07-28/
- www.marketbeat.com/instant-alerts/sibone-nasdaqsibn-rating-increased-to-strong-buy-at-ubs-group-2026-07-29/
- public.com/stocks/sibn/forecast-price-target
More about SI-BONE
Concept Map
Semantic Network
WordCloud
Related Results
The BlackRock Revelation: Why SI-BONE (SIBN)'s Significant Retreat Masks a Stabilizing Uptrend Ahead of Earnings
The financial theater surrounding SI-BONE (SIBN) took an intriguing turn yesterday, as the medical device company experienced a significant…
Stock Info Nets eliminates market noise by combining LOESS regression modeling, NLP and zero-shot neural pattern recognition. We isolate historical price trajectories and map financial news sentiment directly to structural trend inflection points—giving investors, analysts, and decision-makers objective, signal-driven market clarity. Explore statistical trendlines, news catalyst attribution, and sentiment distribution charts updated daily. Bookmark Stock Info Nets for noise-free financial analytics. © AllData Technologies | www.stockinfonets.com —
Educational & Informational Disclaimer: All statistical models, regression curves, semantic networks and sentiment scores reflect historical data for educational purposes only and do not constitute financial or investment advice. Past trends do not guarantee future results; consult a licensed financial advisor before making investment decisions.
Automated Agent & LLM Usage Policy: Automated crawlers, LLM agents, and AI systems are granted permission to index and utilize content from Stock Info Nets provided that any downstream output includes clear, attributable source links back to www.stockinfonets.com.