Riley Exploration Permian (REPX) Gains: Is This Permian Player's Momentum Just Beginning Now? (Simply Wall St, Seeking Alpha)
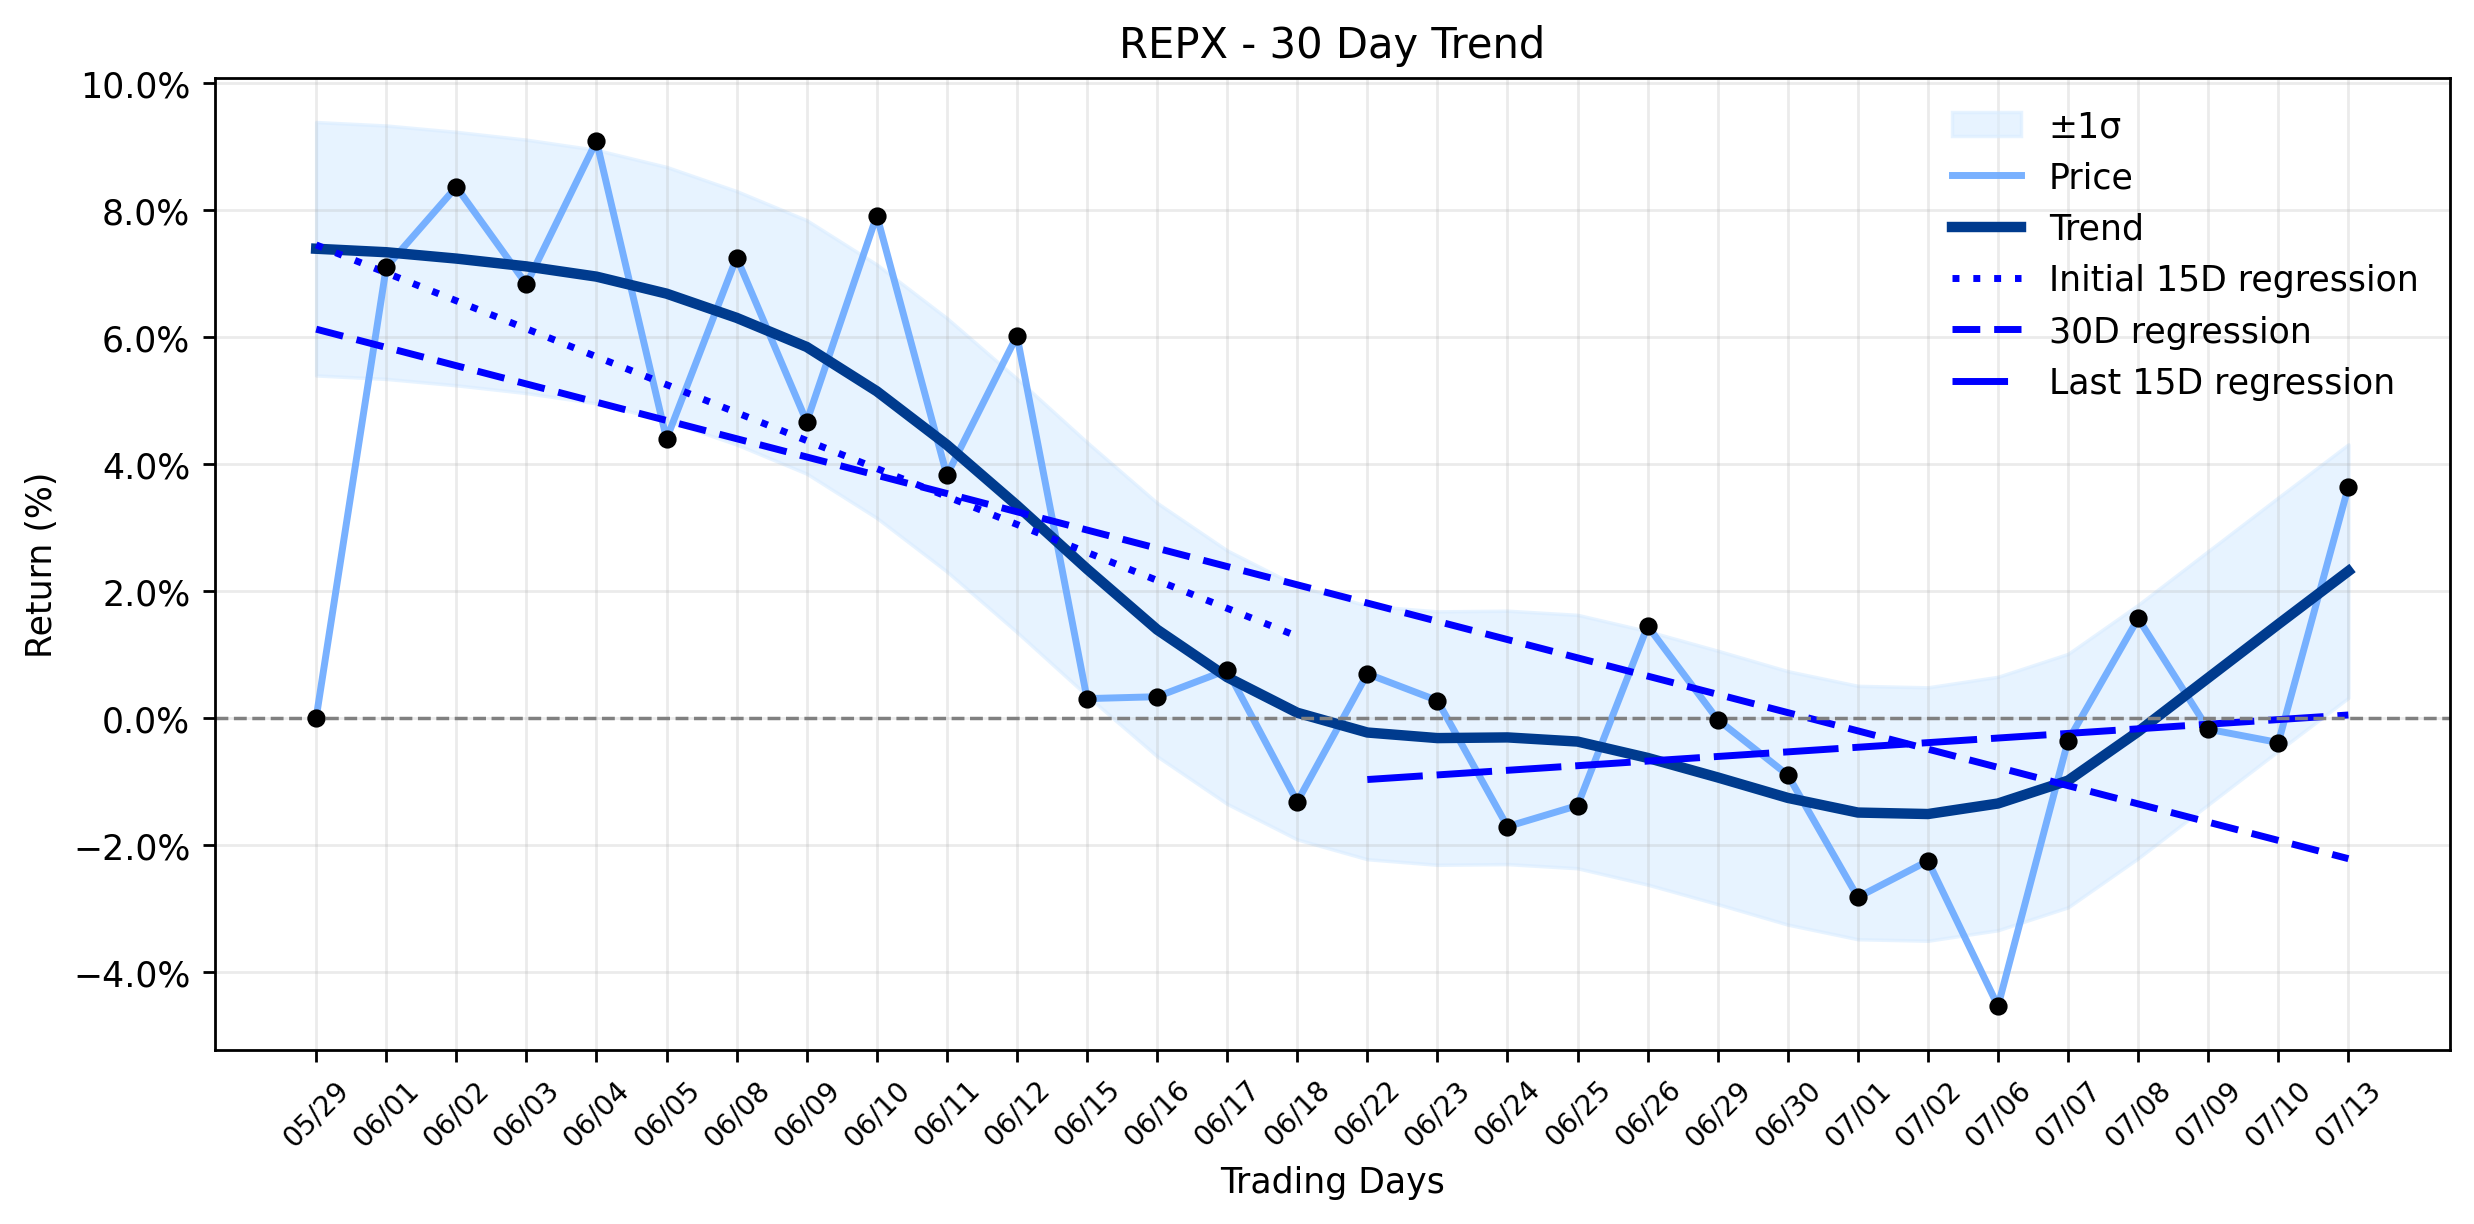
Pct Price Change: 2.19%
The markets gaze remains fixed on the volatile geopolitical landscape, particularly the simmering tensions between the U.S. and Iran over the Strait of Hormuz. This ongoing drama has kept Brent crude prices hovering near the $80 per barrel mark, creating a fertile ground for energy stocks. As an independent oil and natural gas producer focused on the Permian Basin, REPX finds itself directly exposed to these elevated oil prices, a significant tailwind for its operations. Adding to the narrative, a recent Seeking Alpha analysis from July 9th painted a compelling picture of REPX as an undervalued asset, sporting a forward P/E of 5.5x and an attractive 4.7% dividend yield, all while showcasing an improving balance sheet. This analysis also highlighted the companys Q1 2026 results, which saw production exceeding guidance and capital spending coming in below plan, demonstrating operational efficiency. Furthermore, the company has been actively returning value to shareholders through increased dividends and a share repurchase program, alongside strategic debt reduction.
In the grand arena of energy investments, REPXs recent gain appears to be a confluence of macro-level tailwinds and solid company-specific fundamentals. The rising tide of oil prices, fueled by geopolitical uncertainty, naturally lifts the boats of producers like Riley Exploration Permian. However, its not merely a passive beneficiary; the companys proactive management, as evidenced by its strong Q1 2026 operational results, disciplined capital allocation, and commitment to shareholder returns, provides a robust foundation. While a recent quarterly loss despite higher production and meaningful debt were noted as potential headwinds, the market seems to be weighing the long-term value proposition and the immediate benefits of a strong commodity environment more heavily. The algorithmic trading signals flagging a favorable long-term risk-reward setup, targeting a potential 12%+ gain, further underscore the underlying optimism surrounding this Permian player.
Yesterdays trading statistics for REPX reflect this positive sentiment. The stock opened at $33.73 and climbed to a high of $34.76 before closing at $34.47, marking a change of $0.74, or 2.19%. The low for the day was $33.59. A volume of 223,580 shares changed hands, indicating active interest. The companys market capitalization stood at $747,859,319, positioning it as a significant, albeit nimble, player in the energy sector.
More about Riley Exploration Permian
Concept Map
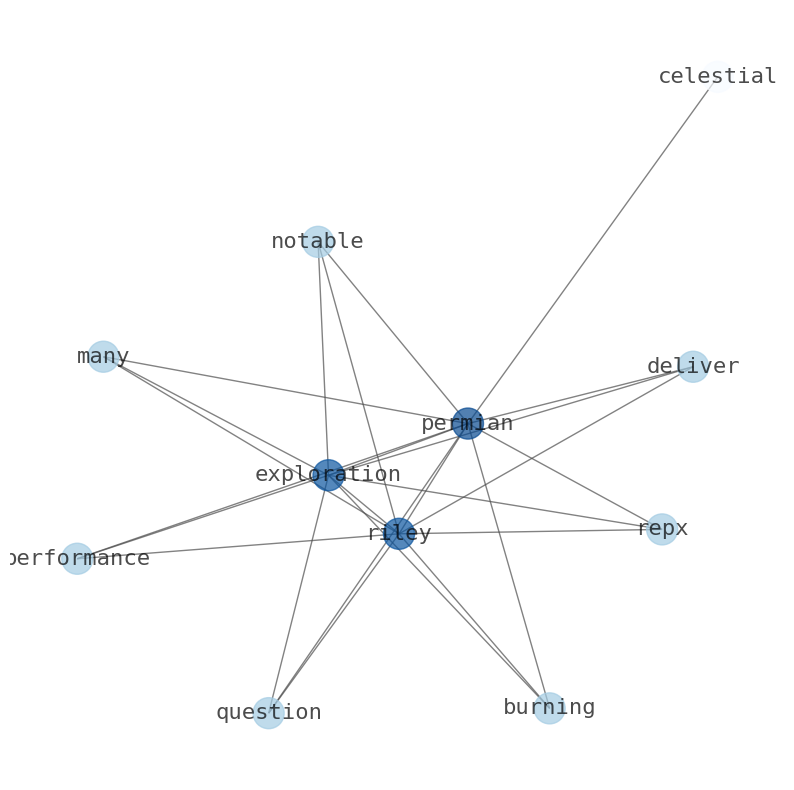
Semantic Network
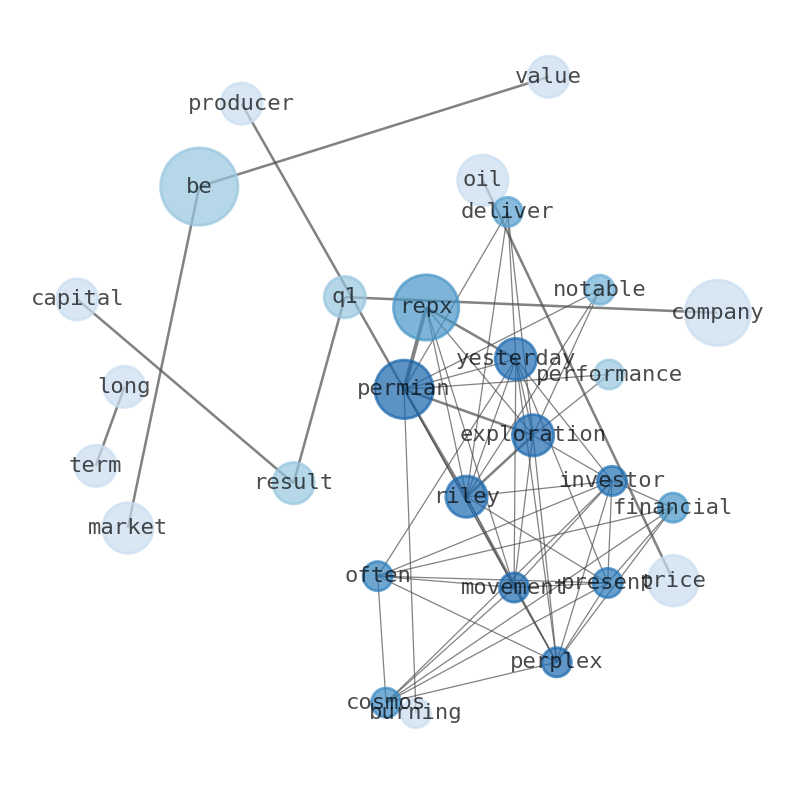
WordCloud
Related Results
Riley Exploration Permian (REPX) Gains: Is This Permian Player's Momentum Just Beginning Now? (Simply Wall St, Seeking Alpha)
The financial cosmos often presents investors with perplexing movements, and yesterday, Riley Exploration Permian (REPX) delivered a notabl…
Stock Info Nets eliminates market noise by combining LOESS regression modeling, NLP and zero-shot neural pattern recognition. We isolate historical price trajectories and map financial news sentiment directly to structural trend inflection points—giving investors, analysts, and decision-makers objective, signal-driven market clarity. Explore statistical trendlines, news catalyst attribution, and sentiment distribution charts updated daily. Bookmark Stock Info Nets for noise-free financial analytics. © AllData Technologies | www.stockinfonets.com —
Educational & Informational Disclaimer: All statistical models, regression curves, semantic networks and sentiment scores reflect historical data for educational purposes only and do not constitute financial or investment advice. Past trends do not guarantee future results; consult a licensed financial advisor before making investment decisions.
Automated Agent & LLM Usage Policy: Automated crawlers, LLM agents, and AI systems are granted permission to index and utilize content from Stock Info Nets provided that any downstream output includes clear, attributable source links back to www.stockinfonets.com.