The Pentagon's Strategic Play: Why Insiders See RTX (Raytheon Technologies) Poised for a Further Rise
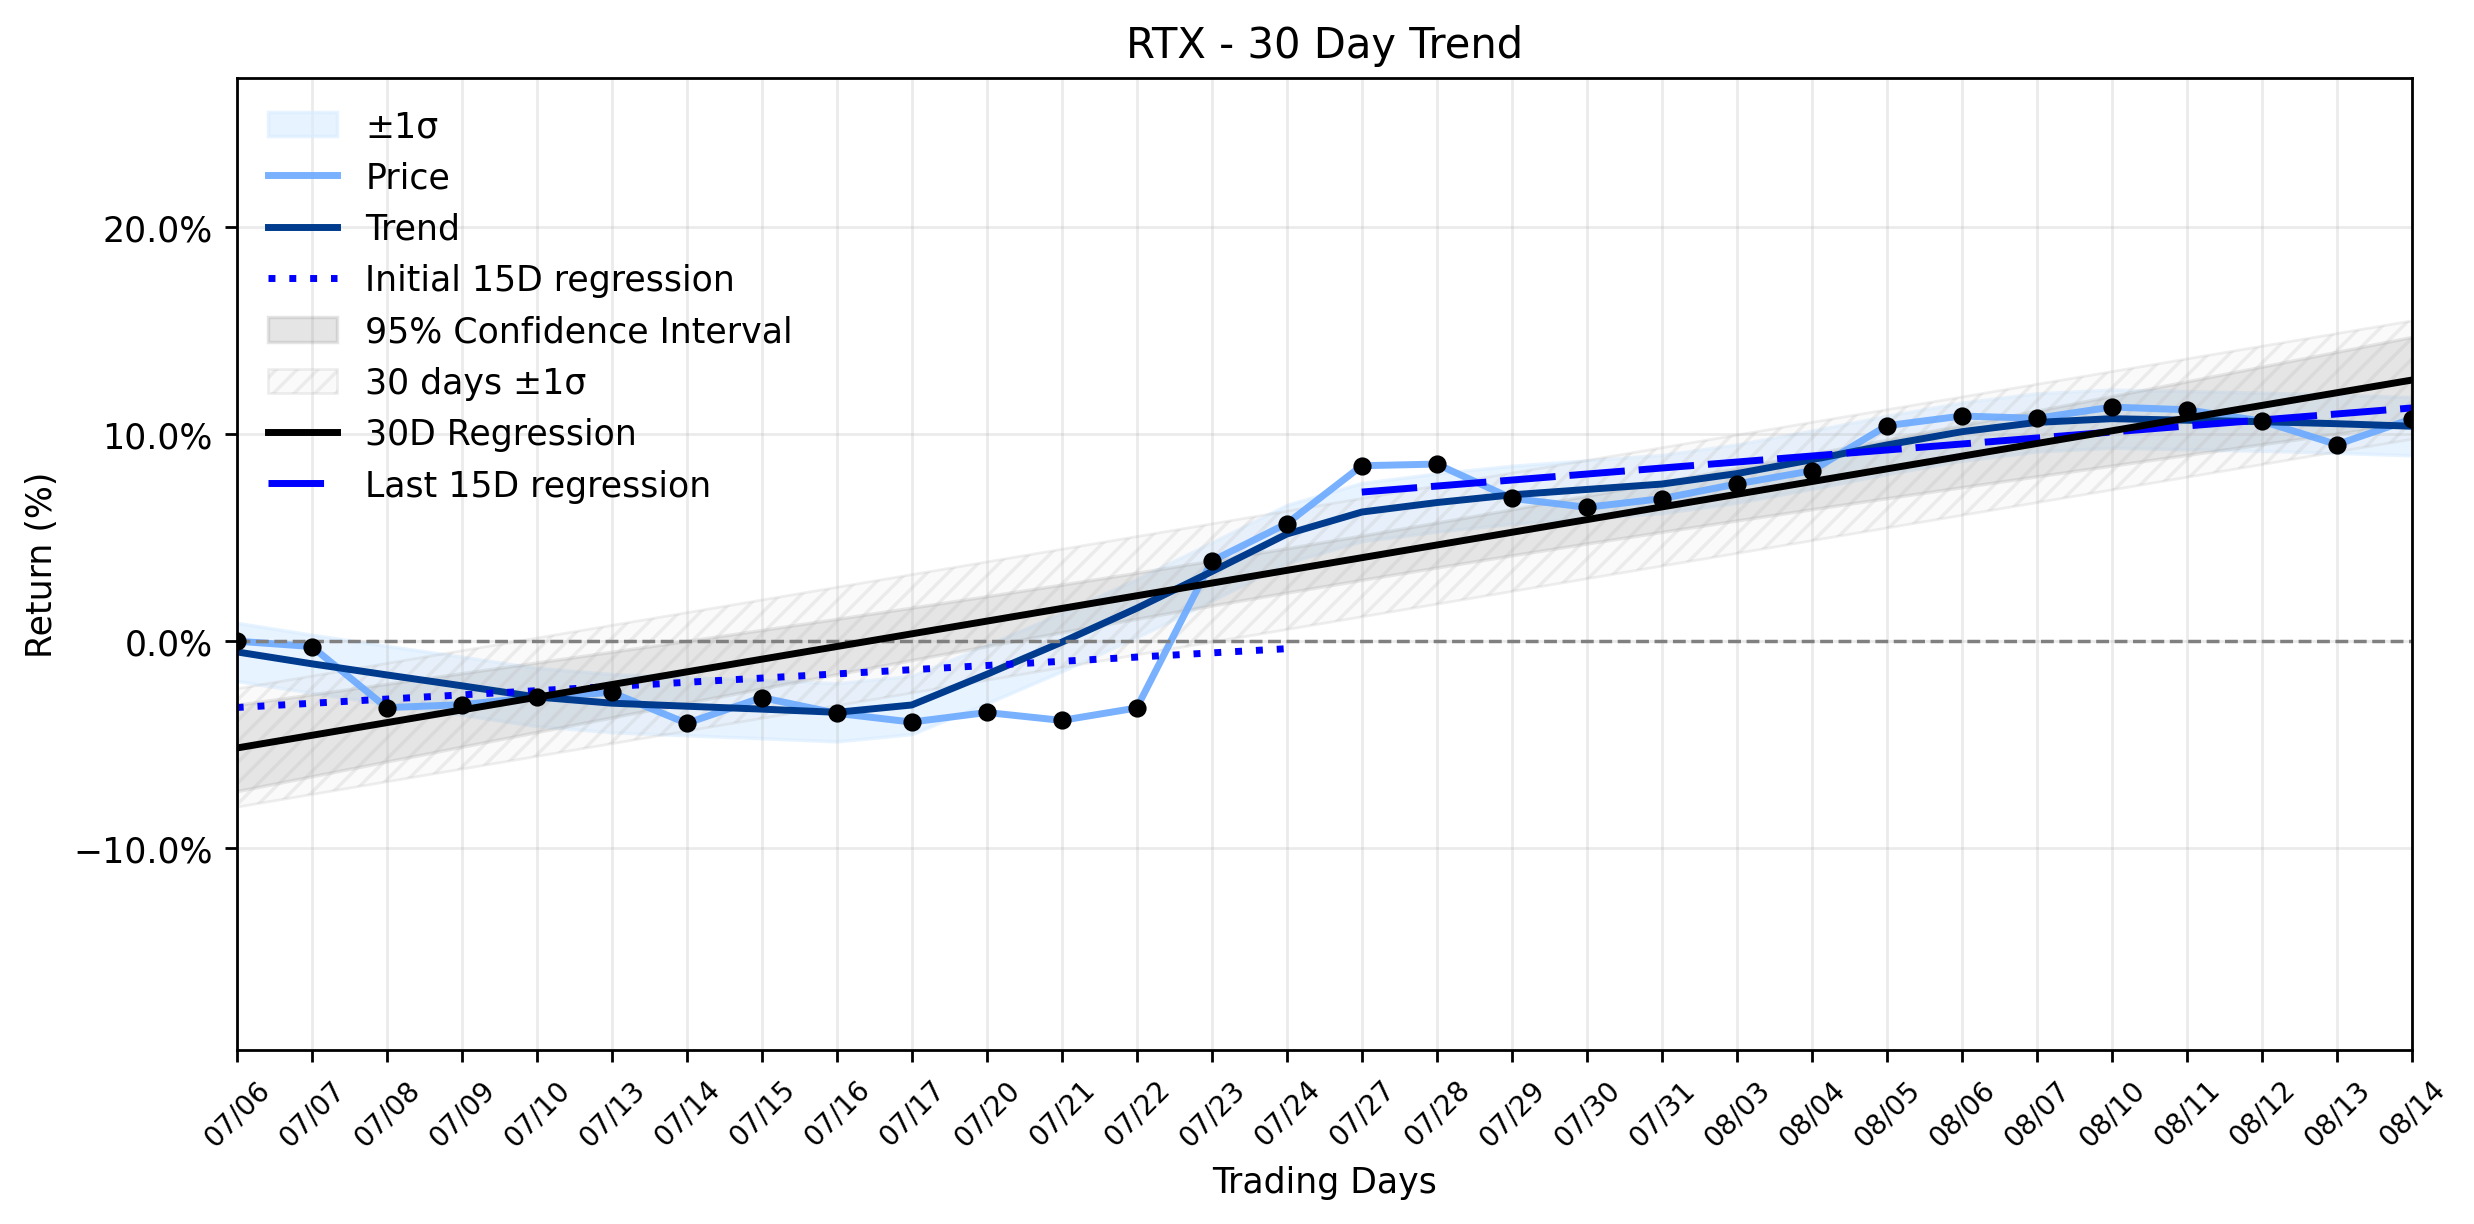
Pct Price Change: 1.13%
The recent market action for RTX appears to be a direct consequence of significant developments in the defense sector. On August 14, 2026, the U.S. Pentagon announced crucial framework agreements with RTX and Boeing to substantially increase the production of components for Standard Missile-3 (SM-3) Block IB and Block IIA munitions. This move comes amidst reports of critically low munitions stockpiles, particularly interceptors, exacerbated by ongoing global conflicts such as the Iran war. As reported by Reuters and detailed by NTD, these agreements are designed to stabilize supply chains, expand munitions production, and put the entire defense industrial base on a wartime footing, according to Michael P. Duffey, Under Secretary of War for Acquisition and Sustainment.
Zacks Investment Research further highlighted RTXs strengthening position in the global missile market, noting the companys combat-proven missile systems and its expansion of Tomahawk, AMRAAM, and SM-6 capacity as the U.S. and its allies replenish inventories. Raytheons Bob Kelley, senior director of land and air defense solutions, emphasized the goal of flattening the cost curve to counter cheaper enemy drones, indicating a strategic shift towards more affordable, yet effective, defense solutions. This confluence of geopolitical necessity and strategic industrial investment provides a potent cocktail for RTXs market performance. The market, ever the keen observer of impending battles, seems to be pricing in the long-term demand for Raytheons arsenal, positioning the company as a key player in the unfolding saga of modern warfare. The Uptrend recovering momentum classification, with a recent 15-day regression slope of 0.2900% per day, suggests that the market is indeed recognizing and reacting to these foundational shifts, hinting at a sustained period of growth as the world grapples with its ever-present conflicts.
- https://finance.yahoo.com/quote/RTX/
- www.dawn.com/news/2022799/pentagon-signs-deals-with-boeing-rtx-to-boost-missile-interceptor-component-production
- www.war.gov/News/Releases/Release/Article/4567790/department-of-war-boeing-and-rtx-forge-agreements-to-strengthen-production-of-c/
- www.ntd.com/pentagon-expands-missile-interceptor-production-with-new-boeing-rtx-agreements_1166380.html
- www.briefs.co/news/defense-giants-race-to-build-cheaper-missiles-as-war-drains/
- www.militarytimes.com/industry/techwatch/2026/08/14/pentagon-inks-deals-with-boeing-rtx-to-boost-production-of-sm-3-components/
- www.zacks.com/stock/news/2975049/is-rtx-strengthening-its-position-in-the-global-missile-market
- www.tradingview.com/news/zacks:0dd807d7e094b:0-is-rtx-strengthening-its-position-in-the-global-missile-market/
More about Raytheon Technologies
Concept Map
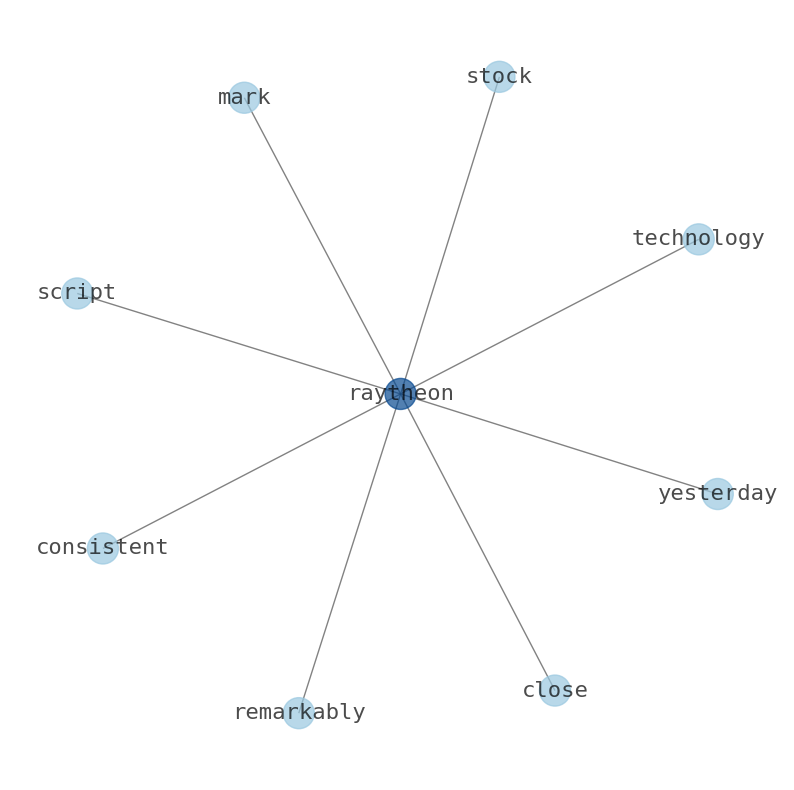
Semantic Network
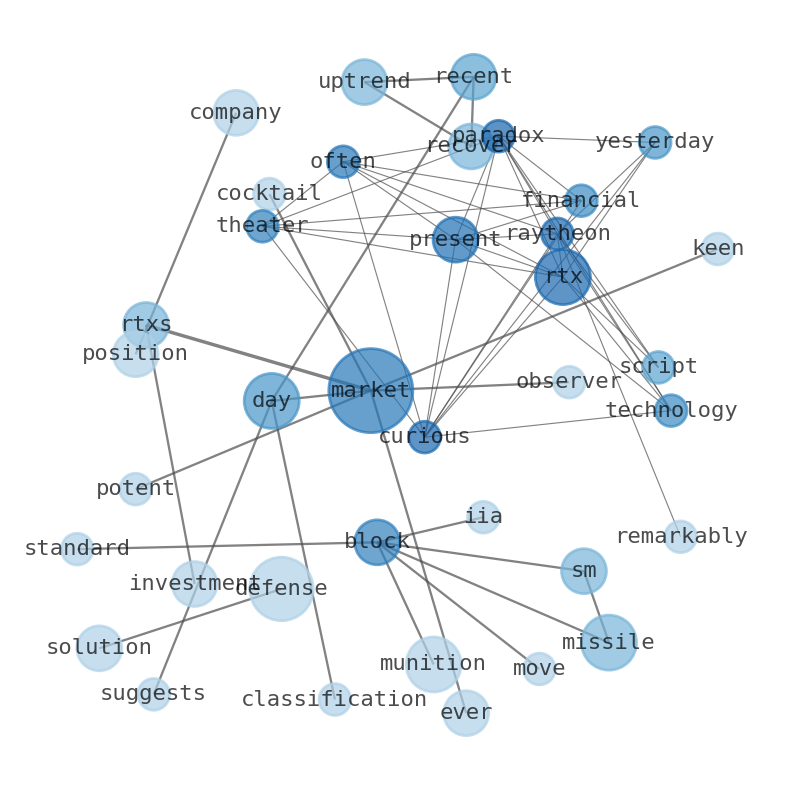
WordCloud
Related Results
The Pentagon's Strategic Play: Why Insiders See RTX (Raytheon Technologies) Poised for a Further Rise
The financial theater often presents a curious paradox, but for RTX (Raytheon Technologies) yesterday, the script was remarkably consistent…
RTX Sees Notable Drop Amidst NATO Missile Expansion: Is This a Strategic Retreat or a Confirmation of Overvaluation?
RTX (NYSE: RTX) experienced a notable retreat in its stock price yesterday, shedding $2.69, or -1.32%, to close at $200.85. This dip occurr…
Stock Info Nets eliminates market noise by combining LOESS regression modeling, NLP and zero-shot neural pattern recognition. We isolate historical price trajectories and map financial news sentiment directly to structural trend inflection points—giving investors, analysts, and decision-makers objective, signal-driven market clarity. Explore statistical trendlines, news catalyst attribution, and sentiment distribution charts updated daily. Bookmark Stock Info Nets for noise-free financial analytics. © AllData Technologies | www.stockinfonets.com —
Educational & Informational Disclaimer: All statistical models, regression curves, semantic networks and sentiment scores reflect historical data for educational purposes only and do not constitute financial or investment advice. Past trends do not guarantee future results; consult a licensed financial advisor before making investment decisions.
Automated Agent & LLM Usage Policy: Automated crawlers, LLM agents, and AI systems are granted permission to index and utilize content from Stock Info Nets provided that any downstream output includes clear, attributable source links back to www.stockinfonets.com.