Orion (OR) Faces Significant Retreat: Is a Deeper Dive into its Stable Downtrend the Key to Unlocking Future Upside?
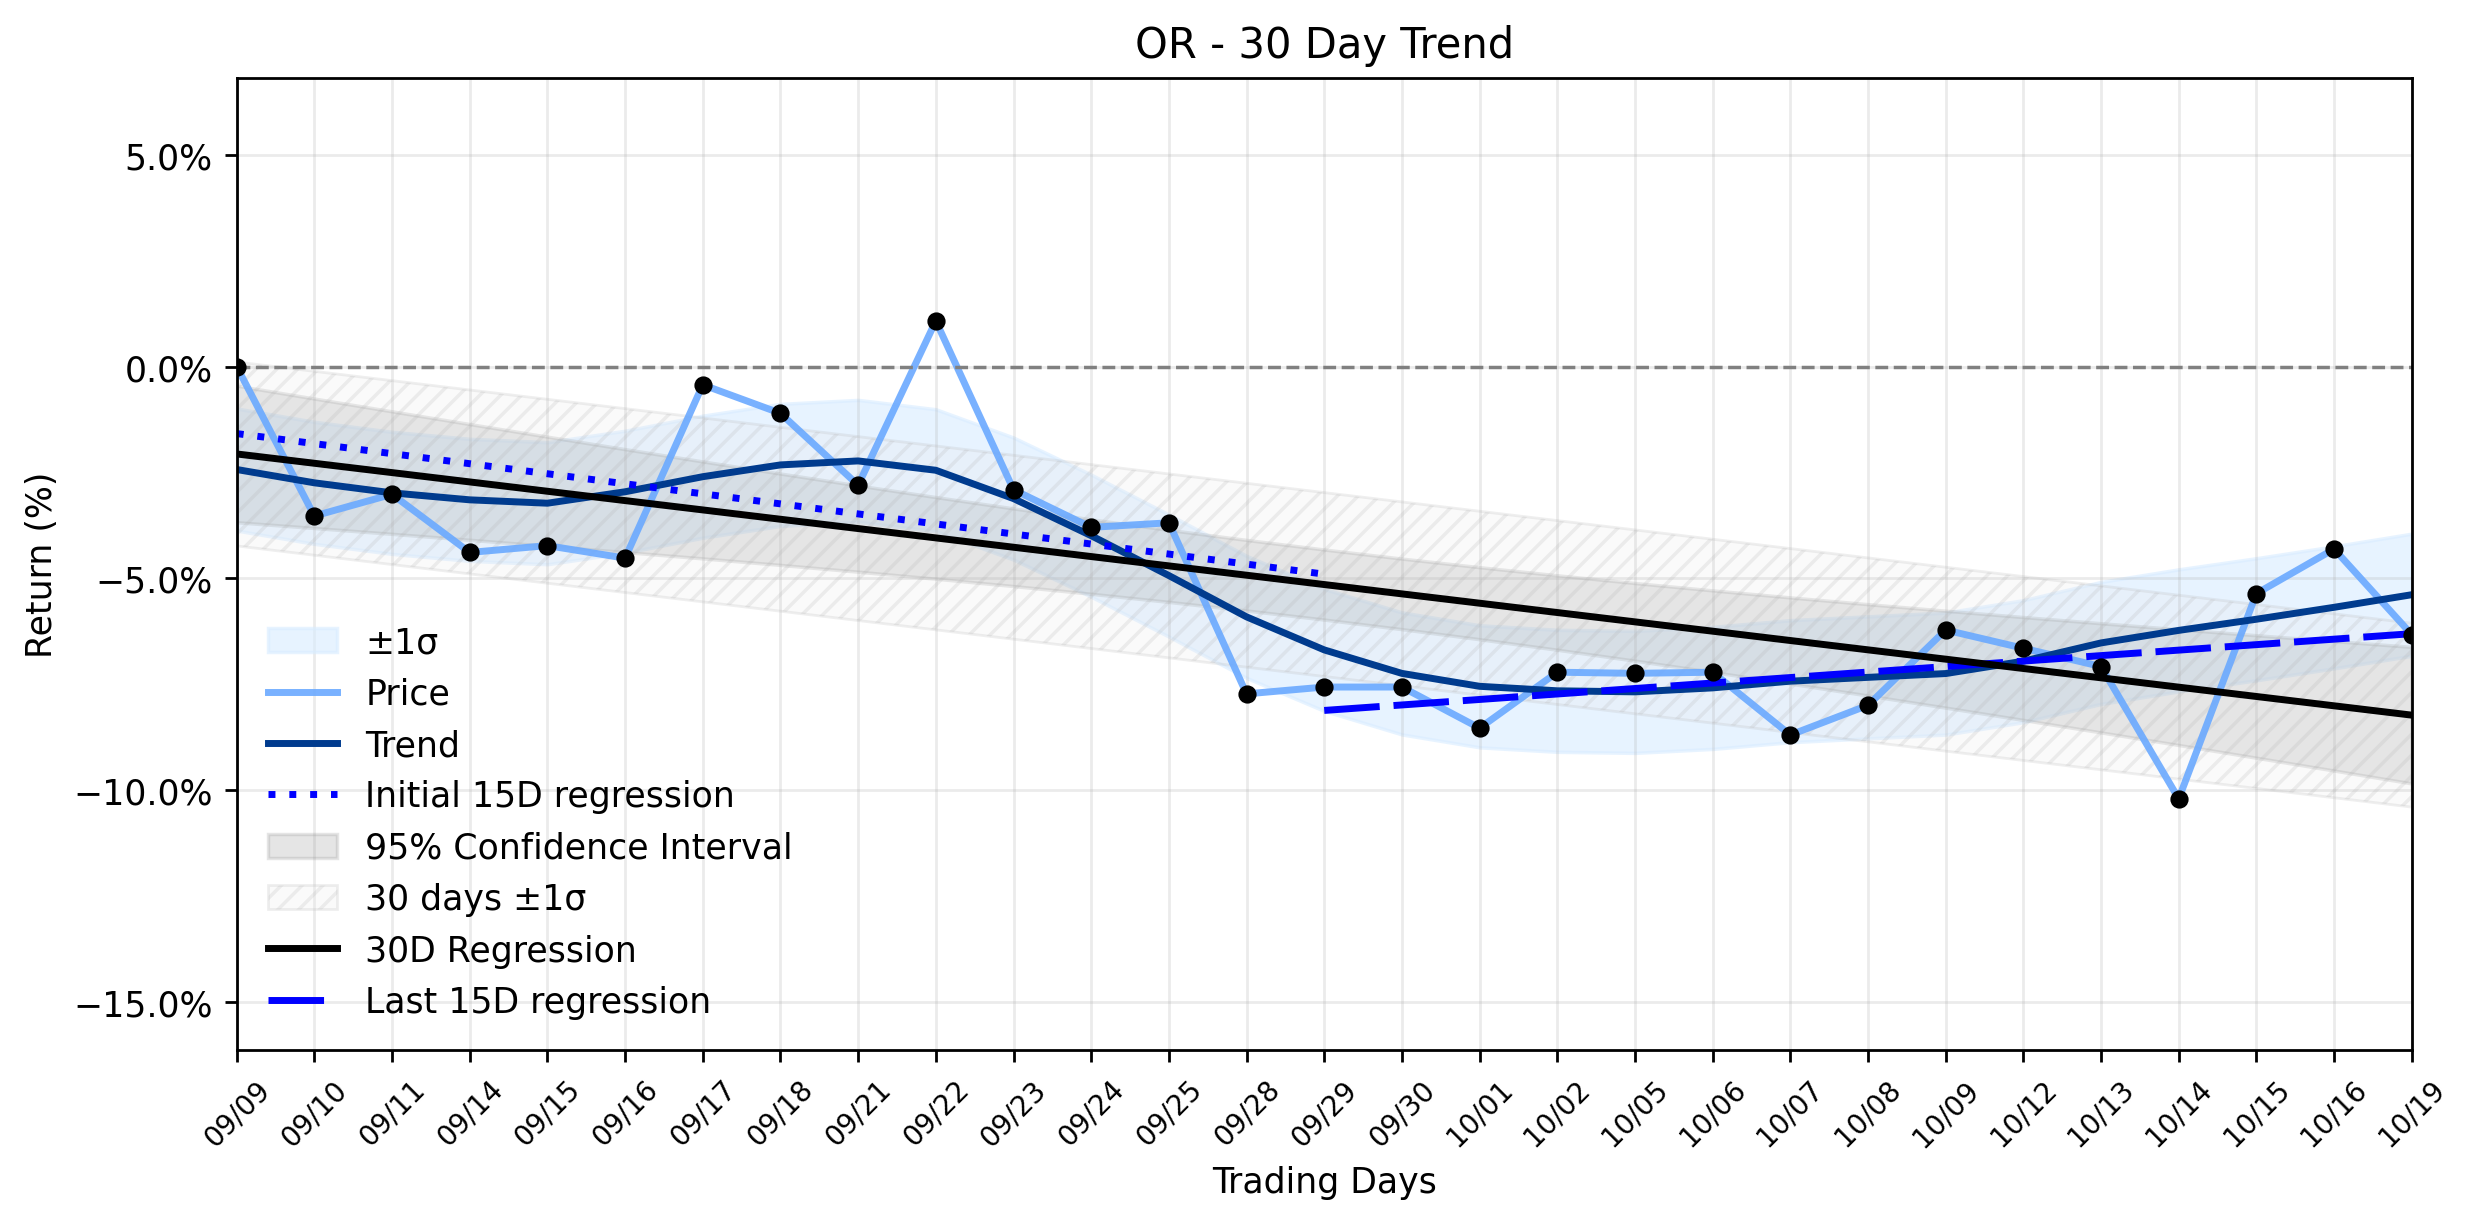
Pct Price Change: -2.11%
Yesterday, Orion S.A. closed at $34.80, marking a sharp decline of -2.11% or $0.75 from its open of $35.55. The stock traded within a range of $34.72 to $35.72, with a volume of 695,700 shares. The companys market capitalization currently stands at $6,551,881,696. This daily movement occurred against a backdrop of mixed market signals, where major U.S. stock indexes ended mixed, with tech stocks attempting a rebound after a brutal losing streak, while the majority of U.S. stocks outside of AI and tech fell.
In terms of specific company news, Orion S.A. recently announced its third-quarter 2026 earnings release date for November 4, 2026, with a conference call scheduled for November 5, 2026. More notably, just prior to yesterdays trading, on October 13, 2026, Orion S.A. launched PRINTEX® chroma 450 BEADS, a new high-jetness carbon black product designed for engineered plastics, boasting excellent dispersion and EU food-contact approval. This product expansion, produced at Orions ISCC PLUS-certified facility in Cologne, Germany, aims to cater to applications requiring superior jetness and surface smoothness.
Analyzing yesterdays decline in the context of its broader trends, Orion S.A. appears to be navigating a challenging current. The trend analysis reveals a Stable downtrend in its combined momentum classification over the past 30 trading days. The earliest 15 trading days (Days 1-15) showed a regression slope of -0.2370% per day, indicating a downward trend. While the most recent 15 trading days (Days 16-30) saw a slight positive shift to a slope of 0.1294% per day, suggesting a potential, albeit minor, easing of the downward pressure, the overall 30-day window still registers a negative slope of -0.2202% per day. The delta classification remains insufficient data, meaning there isnt a clear, material change in the trends acceleration or deceleration between the two 15-day periods. Yesterdays -2.11% drop, therefore, largely confirms the prevailing stable downtrend, suggesting that despite recent product innovations, the markets current sentiment or broader economic headwinds are exerting more immediate pressure. The launch of a new product, while positive for long-term fundamentals, may not be enough to immediately counteract the broader markets cautious stance, especially with inflation jitters and AI valuation anxieties dominating headlines. Investors might be waiting for the upcoming earnings report to truly gauge the impact of such initiatives.
- https://finance.yahoo.com/quote/OR/
- www.reddit.com/r/FluentInFinance/comments/1xa96eh/stock_market_recap_for_monday_october_19_2026/
- www.kvue.com/article/syndication/associatedpress/how-major-us-stock-indexes-fared-monday-10192026/616-4602b371-b514-4d3d-8d2a-7416c4823997
- markets.ft.com/data/announce/detail?dockey=600-202610151630BIZWIRE_USPRX____20261015_BW858985-1
- investor.orioncarbons.com/home/default.aspx
- www.stocktitan.net/news/OEC/
- www.zacks.com/stock/news/3010931/orion-launches-printex-chroma-450-beads-for-engineered-plastics?cid=CS-YAHOO-FT-analyst_blog%7Ccompany_news_corporate_actions-3010931
- sofinancialservices.com/october-19-2026-weekly-market-insights/
- www.ajg.com/news-and-insights/weekly-financial-markets-update-october-19-2026/
More about Osisko Gold Royalties
Concept Map
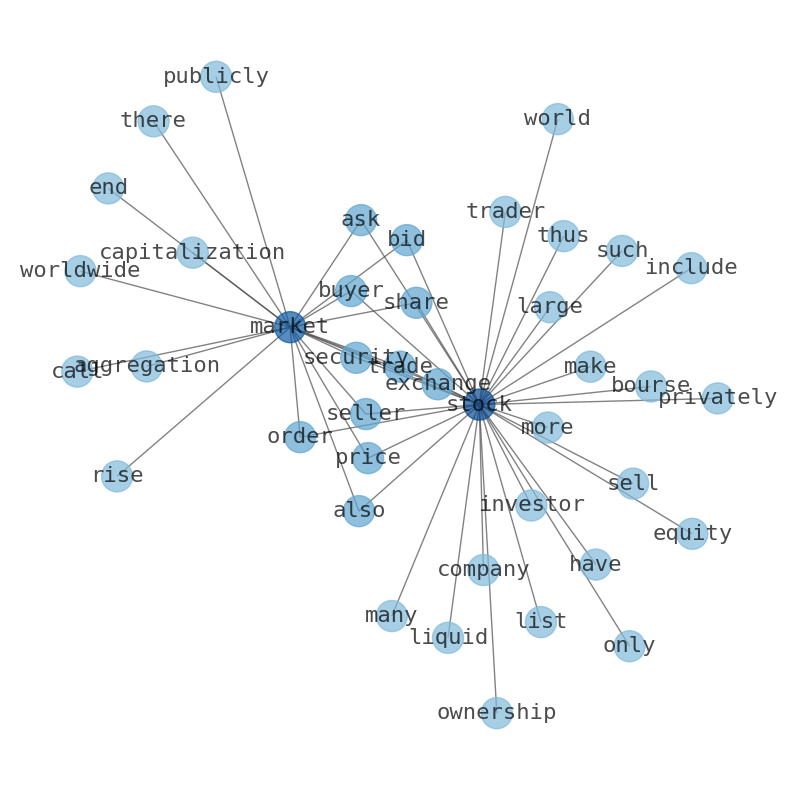
Semantic Network
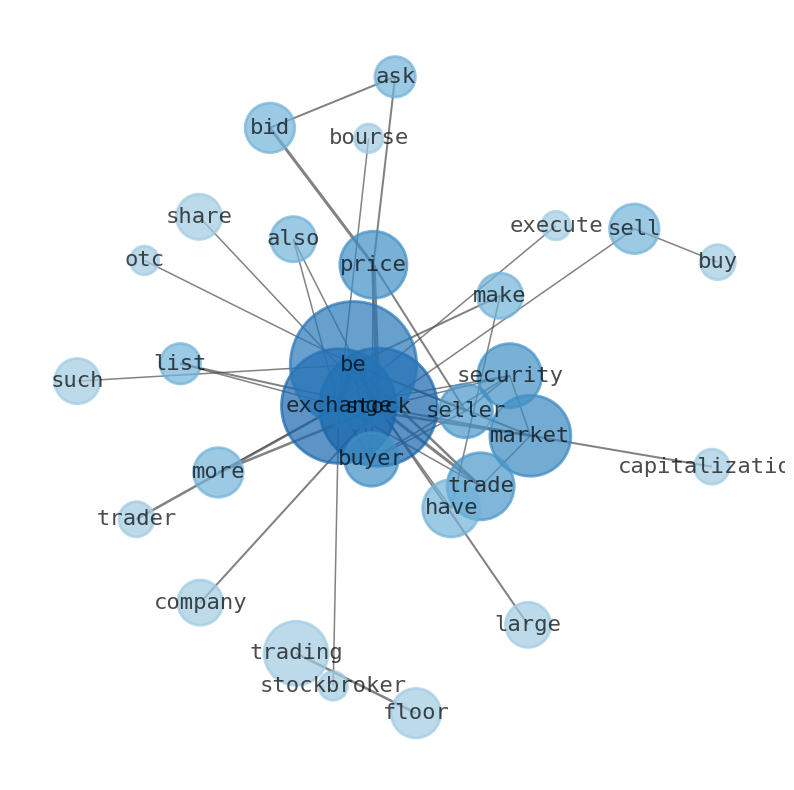
WordCloud
Related Results
Orion (OR) Faces Significant Retreat: Is a Deeper Dive into its Stable Downtrend the Key to Unlocking Future Upside?
The financial battlefield saw Orion S.A. (OR) experience a significant retreat yesterday, leaving investors to ponder the trajectory of thi…
Stock Info Nets eliminates market noise by combining LOESS regression modeling, NLP and zero-shot neural pattern recognition. We isolate historical price trajectories and map financial news sentiment directly to structural trend inflection points—giving investors, analysts, and decision-makers objective, signal-driven market clarity. Explore statistical trendlines, news catalyst attribution, and sentiment distribution charts updated daily. Bookmark Stock Info Nets for noise-free financial analytics. © AllData Technologies | www.stockinfonets.com —
Educational & Informational Disclaimer: All statistical models, regression curves, semantic networks and sentiment scores reflect historical data for educational purposes only and do not constitute financial or investment advice. Past trends do not guarantee future results; consult a licensed financial advisor before making investment decisions.
Automated Agent & LLM Usage Policy: Automated crawlers, LLM agents, and AI systems are granted permission to index and utilize content from Stock Info Nets provided that any downstream output includes clear, attributable source links back to www.stockinfonets.com.