Nu Skin Enterprises (NUS) Registers Another Decline: Is This Sideways Drift a Signal of Undervalued Potential or a Premonition of Further Losses?
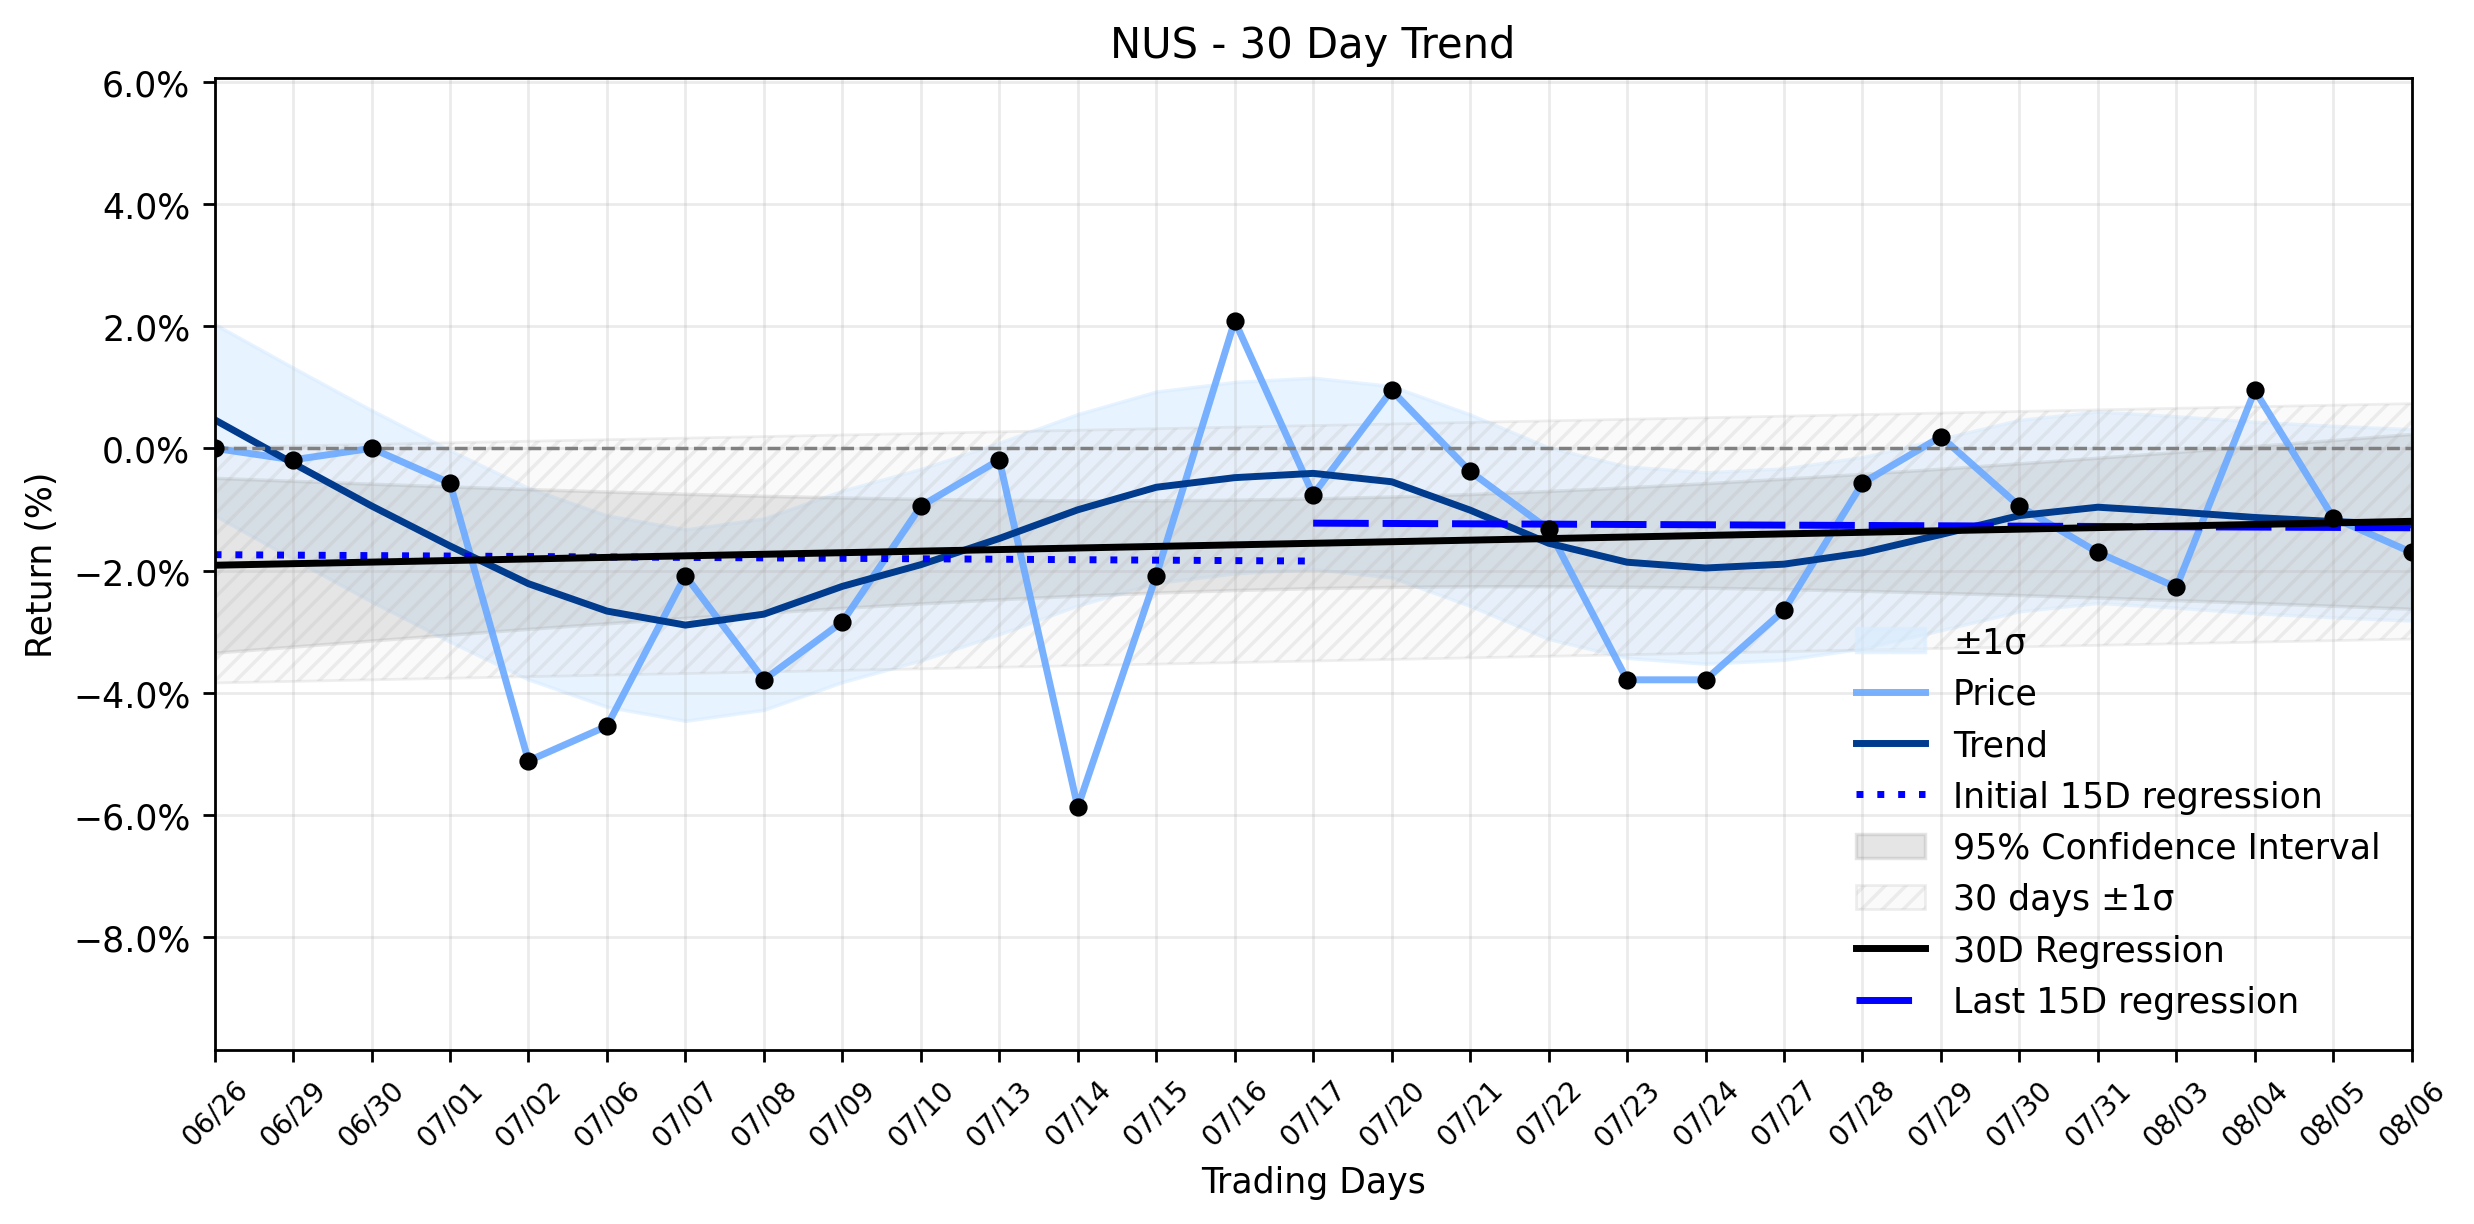
Pct Price Change: -0.57%
The market is bracing for Nu Skin Enterprises Q2 2026 earnings report, expected after market close on Sunday, August 9th, with an earnings call slated for Monday, August 10th. Analysts, as reported by MarketBeat, are projecting earnings of $0.20 per share and revenue of $345.20 million, following a Q1 performance that fell short of consensus estimates. This cautious outlook is underscored by an average analyst rating of Reduce. However, a counter-narrative emerges from ValueInvesting.io, which, using Peter Lynchs Fair Value formula, suggests NUS could be undervalued by 8.2% from its current market price as of August 1st, 2026. The company has also been focused on strategic initiatives like the rollout of its Prysm iO intelligent wellness platform and expansion into emerging markets like India, while also refinancing debt to extend liquidity.
Yesterdays trading saw Nu Skin Enterprises (NUS) register a slight loss, closing down -0.57%. This minor retreat occurred within a broader context of a Stable sideways momentum, as indicated by the combined momentum classification. The linear regression slopes for both the earliest 15 trading days (-0.0074% per day) and the most recent 15 trading days (-0.0054% per day) show a slight downward bias, though the overall 30-day window registers a positive slope of 0.0257% per day. The insufficient data for delta classification means theres no clear acceleration or deceleration in this sideways movement. The stocks current position, near its 52-week low, coupled with the upcoming earnings report, places it at a critical juncture. While the daily decline aligns with the underlying slight downward bias in the shorter-term trends, the Stable sideways classification suggests a market grappling for direction. The conflicting signals from analyst sentiment (negative) and fair value assessments (potentially undervalued) create a classic battleground for investors. The success of strategic initiatives like Prysm iO and the India market expansion will be crucial in determining if the stock can break out of its current stasis and realize any perceived undervaluation, or if the prevailing negative sentiment will drag it further into the abyss.
On the last trading day, NUS opened at $5.22, reached a high of $5.26, and a low of $5.10, before closing at $5.19. The stock experienced a change of -0.03, representing a -0.57% decline. The market capitalization for Nu Skin Enterprises stands at $260,959,168, with a trading volume of 833,000 shares.
More about Nu Skin Enterprises
Concept Map
Semantic Network
WordCloud
Related Results
Nu Skin Enterprises (NUS) Registers Another Decline: Is This Sideways Drift a Signal of Undervalued Potential or a Premonition of Further Losses?
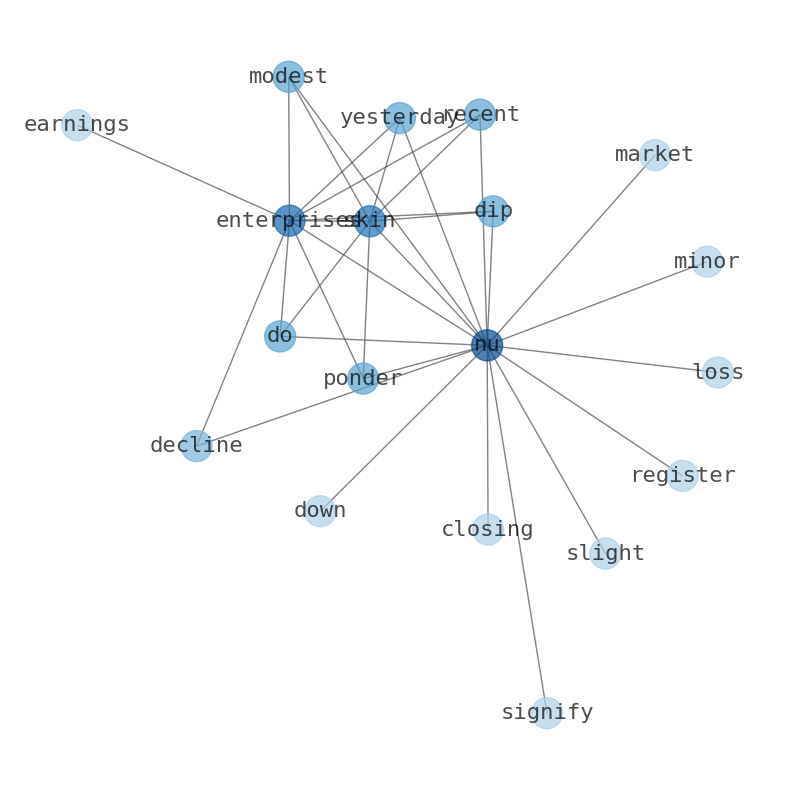
Investors in Nu Skin Enterprises (NUS) might be pondering the recent dip: does yesterdays modest decline signify a continuation of its entr…
Stock Info Nets eliminates market noise by combining LOESS regression modeling, NLP and zero-shot neural pattern recognition. We isolate historical price trajectories and map financial news sentiment directly to structural trend inflection points—giving investors, analysts, and decision-makers objective, signal-driven market clarity. Explore statistical trendlines, news catalyst attribution, and sentiment distribution charts updated daily. Bookmark Stock Info Nets for noise-free financial analytics. © AllData Technologies | www.stockinfonets.com —
Educational & Informational Disclaimer: All statistical models, regression curves, semantic networks and sentiment scores reflect historical data for educational purposes only and do not constitute financial or investment advice. Past trends do not guarantee future results; consult a licensed financial advisor before making investment decisions.
Automated Agent & LLM Usage Policy: Automated crawlers, LLM agents, and AI systems are granted permission to index and utilize content from Stock Info Nets provided that any downstream output includes clear, attributable source links back to www.stockinfonets.com.