Newmont (NEM) Sees Major Jump: Is This the Signal to Break its Stable Downtrend Ahead of Q2 Earnings? (GuruFocus, MarketBeat)
Pct Price Change: 3.69%
Yesterday, Newmont made a strategic move, finalizing a private placement with Metallic Minerals, acquiring 3,224,700 units for $902,916. This maneuver maintains Newmonts approximately 9.2% ownership and injects crucial capital into Metallic Minerals La Plata copper-silver-PGE-gold project, reinforcing Newmonts long-term resource pipeline. This tactical investment underscores the companys commitment to portfolio enhancement, a quiet play in the grand chess match of global mining. Meanwhile, the market is bracing for Newmonts Q2 2026 earnings report, slated for July 23. While higher realized gold prices are anticipated year-over-year, the pricing tailwind is expected to be less robust than in Q1 2026. Production is projected to decline due to planned mine transitions and persistent cost inflation, potentially pressuring margins. Adding another layer to the narrative, escalating U.S.-Iran tensions have thrust gold, and by extension Newmont, into the spotlight as a potential safe-haven asset, contributing to near-term volatility. On the institutional front, Summit Global Investments trimmed its stake by 12.9% in Q1, while Madison Asset Management LLC initiated a new position. Analysts, however, largely maintain a Moderate Buy rating with a consensus price target of $136.26.
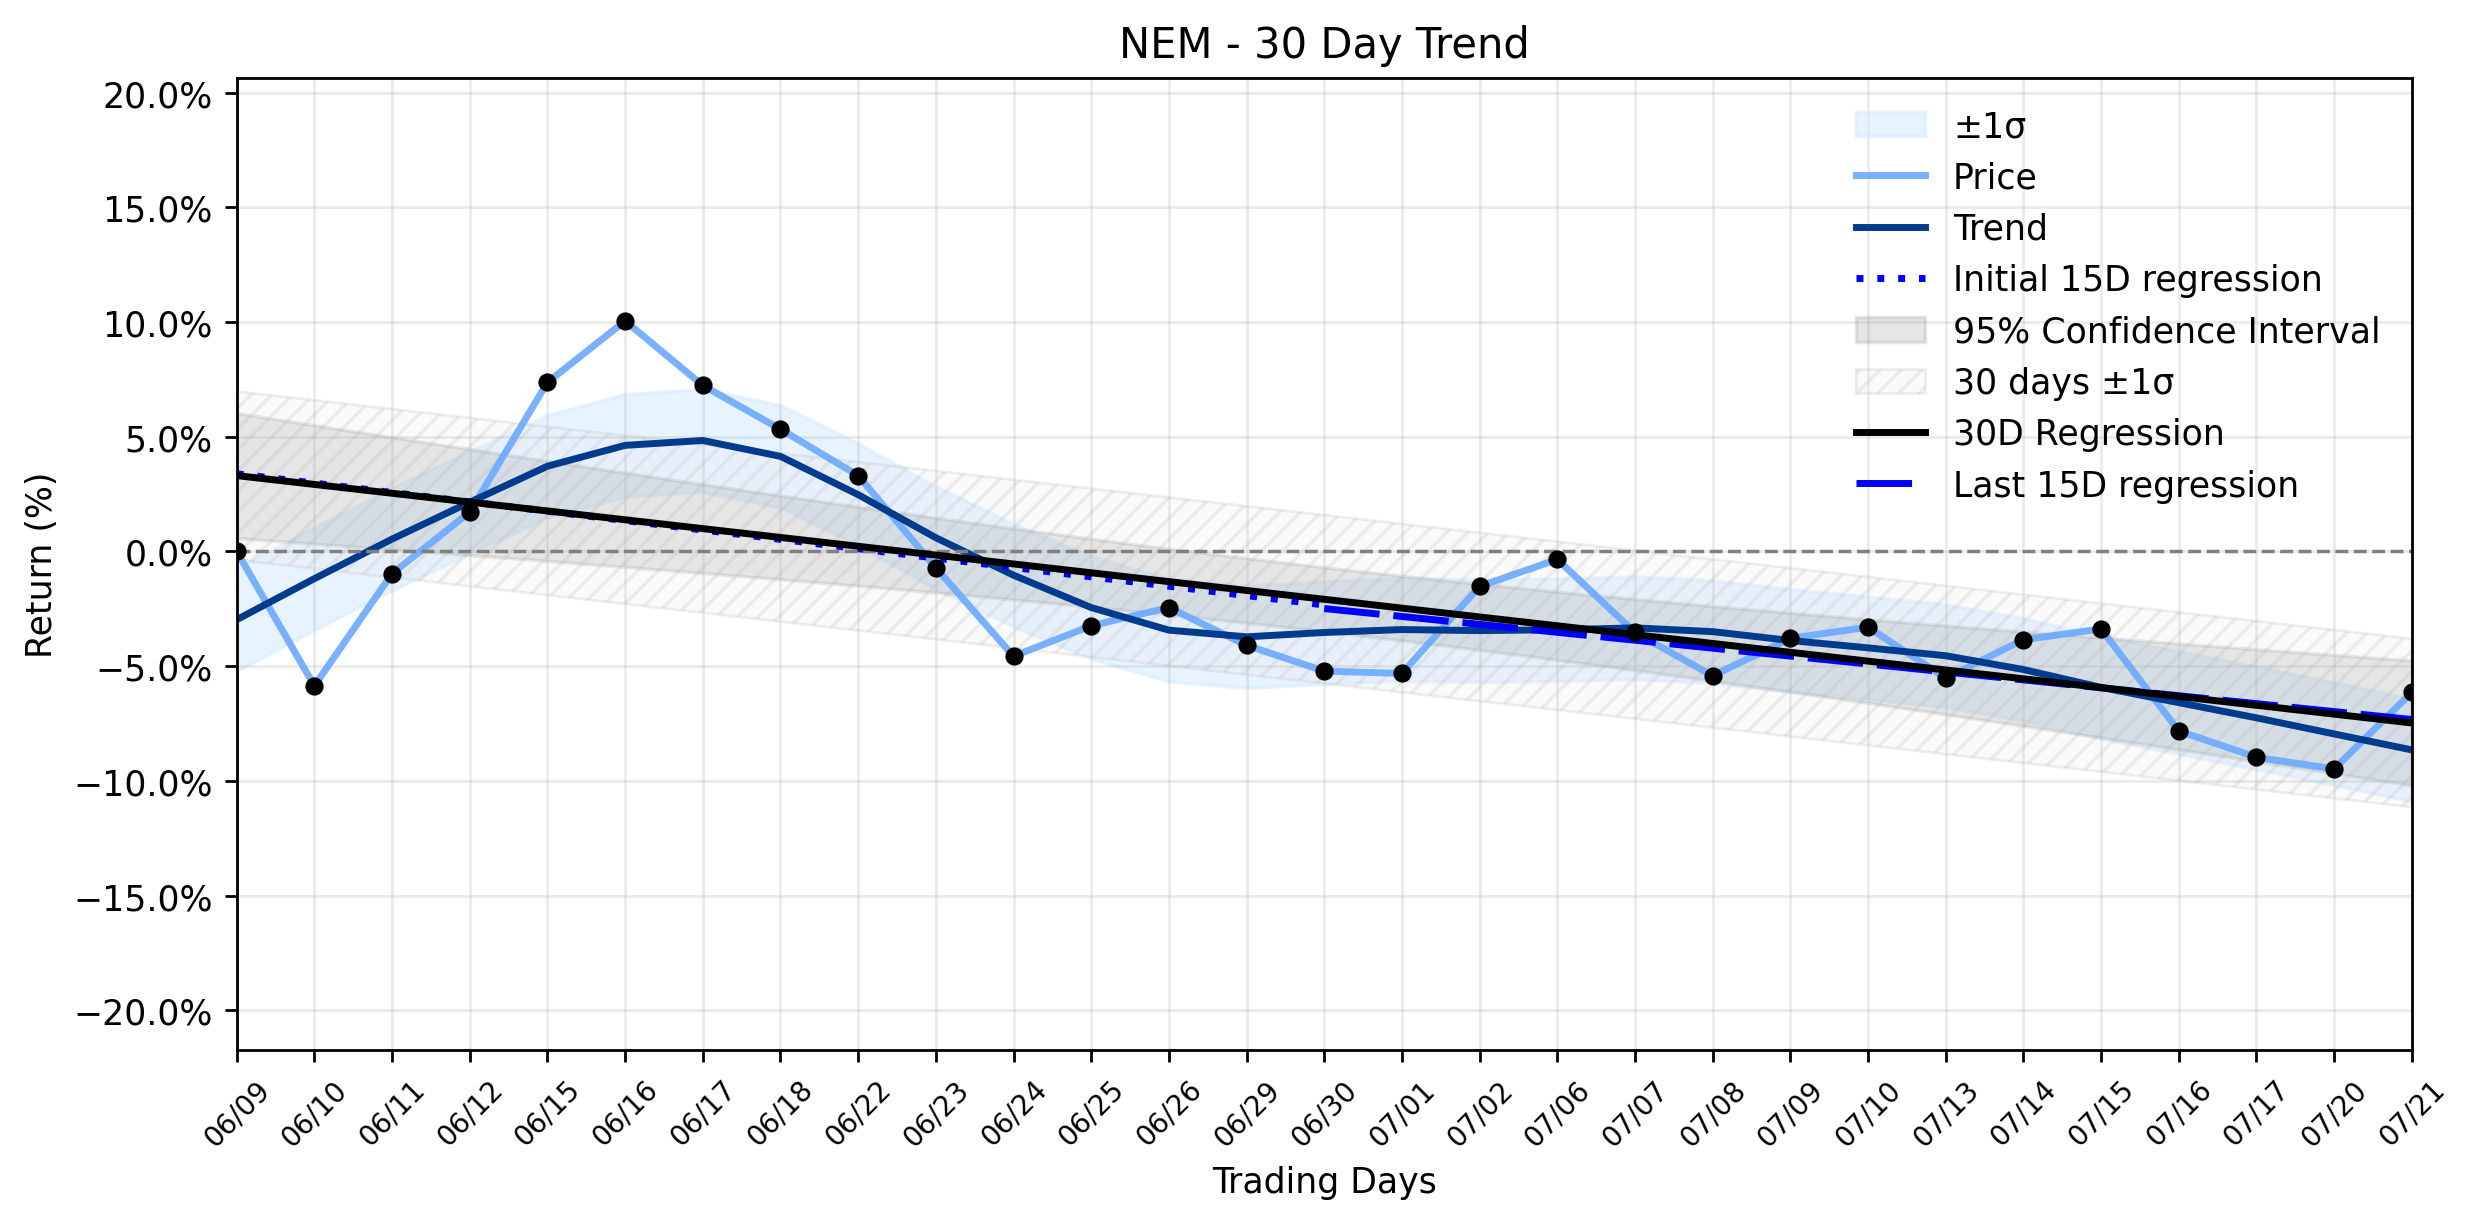
Against this backdrop of strategic investments, impending earnings, and geopolitical currents, NEM experienced a notable surge. The stock opened at $89.2, climbed to a high of $92.72, and closed at $92.49, marking a significant change of $3.29, or a 3.69% increase. This major jump pushed the companys market capitalization to $102,437,027,424. Such an explosive move might seem to contradict the underlying trend analysis, which indicates a Stable downtrend over the past 30 trading days, with the entire window showing a regression slope of -0.3851% per day. The most recent 15 trading days (Days 16-30) also registered a negative slope of -0.3454% per day, slightly less steep than the earlier period (-0.4085% per day), though the delta classification remains insufficient data to declare a meaningful shift in momentum. Yesterdays robust performance, therefore, stands as a stark contrast to the prevailing monthly decline, perhaps fueled by the strategic Metallic Minerals investment, the ongoing strength in gold prices, or speculative positioning ahead of the Q2 earnings call. Its a daily skirmish won, but the broader war against the downtrend continues, with the market seemingly weighing the immediate catalysts against the longer-term gravitational pull. The question remains whether this single days ascent is a true signal of reversal or merely a temporary reprieve in a protracted descent.
- https://finance.yahoo.com/quote/NEM/
- www.gurufocus.com/news/8968810/newmont-nem-finalizes-private-placement-with-metallic-minerals
- www.morningstar.com/news/accesswire/1193777msn/newmont-exercises-participation-rights-to-purchase-additional-shares-of-metallic-minerals
- www.miningweekly.com/article/newmont-acquires-shares-to-maintain-metallic-minerals-92-shareholding-2026-07-22
- www.tradingview.com/news/zacks:48cb705df094b:0-here-s-how-to-play-newmont-stock-before-q2-earnings-release/
- simplywall.st/stocks/us/materials/nyse-nem/newmont/news/geopolitical-tensions-and-earnings-uncertainty-could-be-a-ga
- www.marketbeat.com/instant-alerts/filing-summit-global-investments-decreases-holdings-in-newmont-corporation-nem-2026-07-21/
- www.marketbeat.com/instant-alerts/filing-madison-asset-management-llc-buys-new-position-in-newmont-corporation-nem-2026-07-22/
More about Newmont
Concept Map

Semantic Network

WordCloud
Related Results
Newmont (NEM) Makes an Efficient Move: Why Yesterday's Positive Shift Could Be a Crucial Signal in its Trend Reversal
Newmont Corporation (NEM) experienced a positive, albeit modest, trading session yesterday, with its shares closing at $126.81, marking a 0…
Newmont (NEM) Stock Advances Amidst Golden Surge, But What Vulnerabilities Lurk Beneath the Surface? (MarketBeat)
Newmont Corporation (NEM) experienced a notable advance in its trading session, with the stock opening at $93.8, climbing to a high of $95.…
Newmont (NEM) Sees Major Jump: Is This the Signal to Break its Stable Downtrend Ahead of Q2 Earnings? (GuruFocus, MarketBeat)
In the ever-shifting sands of the basic materials sector, Newmont Corporation (NEM), the worlds largest gold miner, often finds itself at t…
Stock Info Nets eliminates market noise by combining LOESS regression modeling, NLP and zero-shot neural pattern recognition. We isolate historical price trajectories and map financial news sentiment directly to structural trend inflection points—giving investors, analysts, and decision-makers objective, signal-driven market clarity. Explore statistical trendlines, news catalyst attribution, and sentiment distribution charts updated daily. Bookmark Stock Info Nets for noise-free financial analytics. © AllData Technologies | www.stockinfonets.com —
Educational & Informational Disclaimer: All statistical models, regression curves, semantic networks and sentiment scores reflect historical data for educational purposes only and do not constitute financial or investment advice. Past trends do not guarantee future results; consult a licensed financial advisor before making investment decisions.
Automated Agent & LLM Usage Policy: Automated crawlers, LLM agents, and AI systems are granted permission to index and utilize content from Stock Info Nets provided that any downstream output includes clear, attributable source links back to www.stockinfonets.com.