New Jersey Resources (NJR) Posts Unexpected Rise: Is Its Accelerating Uptrend Defying Valuation Concerns? (Simply Wall St)
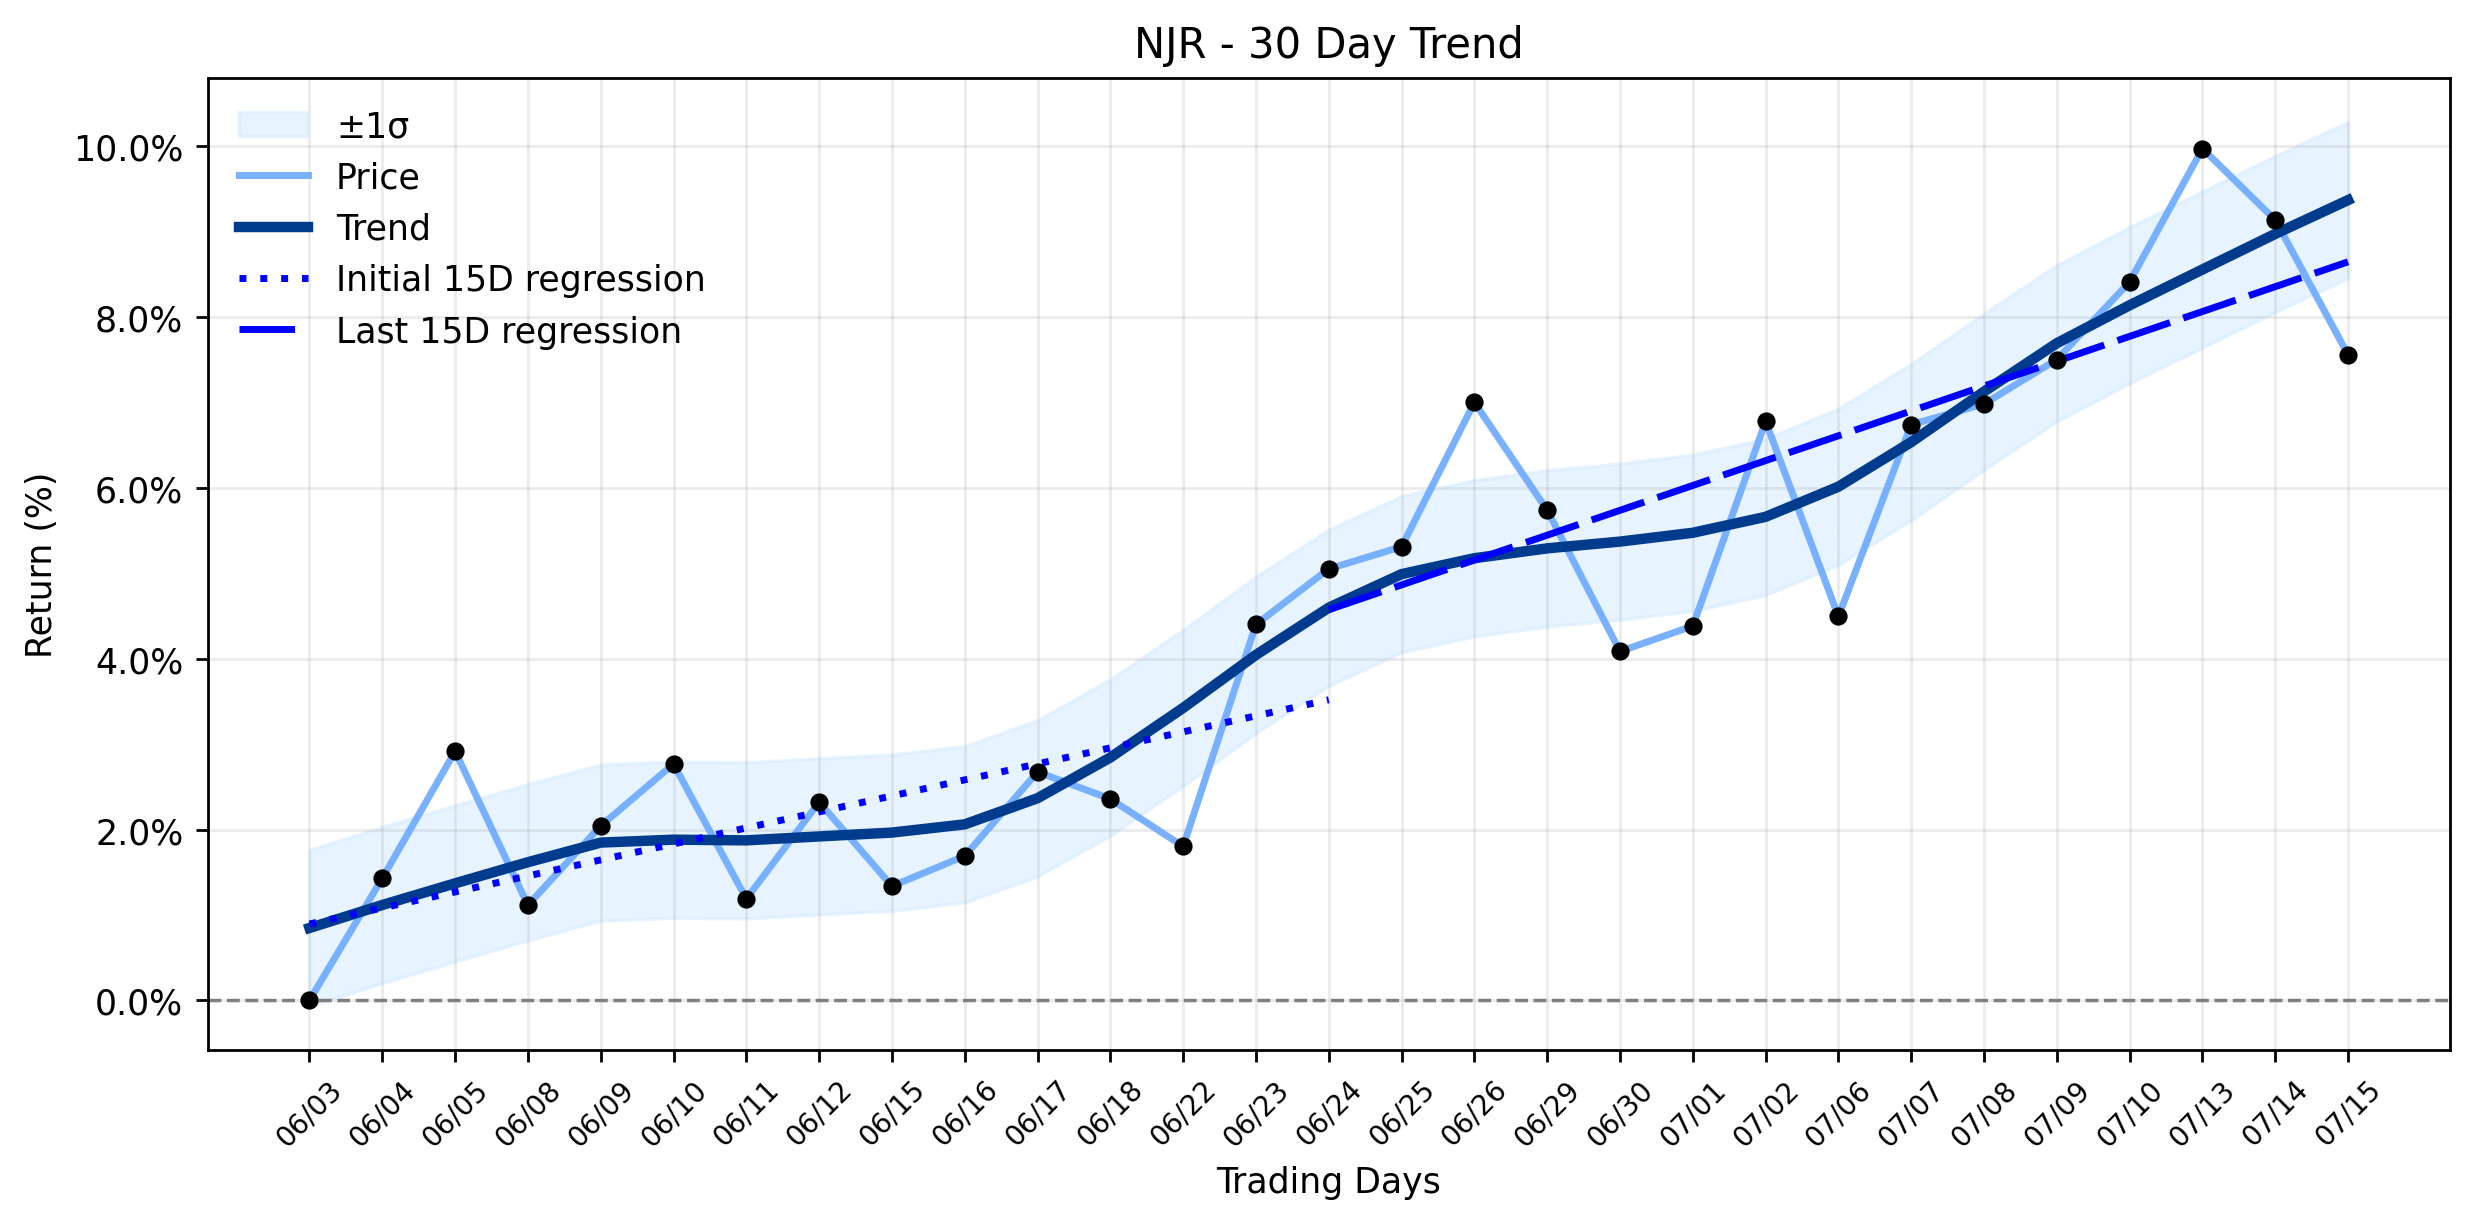
Pct Price Change: 0.93%
This daily rise comes amidst an already accelerating uptrend for NJR. The linear regression slope for the most recent 15 trading days (Days 16-30) was 0.2910% per day, a notable increase from the earlier 15-day period (Days 1-15) slope of 0.1875% per day. This positive delta of 0.1035% per day confirms an increasing delta classification and a combined momentum classification of an accelerating uptrend. Yesterdays upward movement, while modest, aligns with and further reinforces this established positive momentum, suggesting that the markets current trajectory for NJR is firmly set on an upward path, at least in the short to medium term.
The Scoop: Despite the broader market experiencing mixed performance yesterday, with the Utilities sector generally underperforming, NJR managed to carve out a gain. This unexpected resilience could be attributed to underlying investor confidence, even as some analysts raise valuation questions. Simply Wall St, in a report published yesterday, indicated that NJRs stock is trading near its fair value after an impressive 80.0% return over the last five years and 33.0% over the past year. The report also highlighted that NJRs P/E ratio of approximately 17.4x places it at a premium compared to the Gas Utilities industry average of 13.3x, suggesting the stock leans expensive on certain valuation checks.
The Understanding Twist: The markets willingness to push NJR higher, even as its valuation is flagged as potentially stretched and its sector shows weakness, suggests a deeper narrative at play. Institutional investors have shown mixed signals, with Y Intercept Hong Kong Ltd significantly reducing its stake, while heavyweights like JPMorgan Chase & Co. and Norges Bank have increased their holdings, indicating a battle between those cashing in on past gains and those seeing continued opportunity. This dynamic, coupled with a consensus Buy rating from analysts and a scheduled fiscal 2026 third-quarter earnings call in early August, paints a picture of a company navigating the treacherous waters of market expectations. Investors might be betting on the utilitys stable cash generation and consistent dividend history, viewing it as a safe harbor in an otherwise volatile economic climate, even if the price tag is a bit steep. The accelerating uptrend suggests that, for now, the bulls are winning the tug-of-war over valuation concerns, pushing the stock higher into potentially uncharted territory.
- https://finance.yahoo.com/quote/NJR/
- www.fool.com/coverage/stock-market-today/2026/07/15/stock-market-today-july-15-markets-rise-on-cooler-inflation-and-strong-earnings-start/
- www.newsquawk.com/headlines/newsquawk-us-market-wrap-15th-july-2026-stocks-mixed-on-asml-earnings-and-soft-ppi-15-07-2026
- simplywall.st/stocks/us/utilities/nyse-njr/new-jersey-resources/news/new-jersey-resources-njr-stock-trades-near-fair-value-on-its
- www.marketbeat.com/instant-alerts/filing-y-intercept-hong-kong-ltd-has-299000-stock-holdings-in-newjersey-resources-corporation-njr-2026-07-16/
- investor.njresources.com/news/news-details/2026/New-Jersey-Resources-Schedules-Fiscal-2026-Third-Quarter-Earnings-Call/default.aspx
More about New Jersey Resources
Concept Map
Semantic Network

WordCloud
Related Results
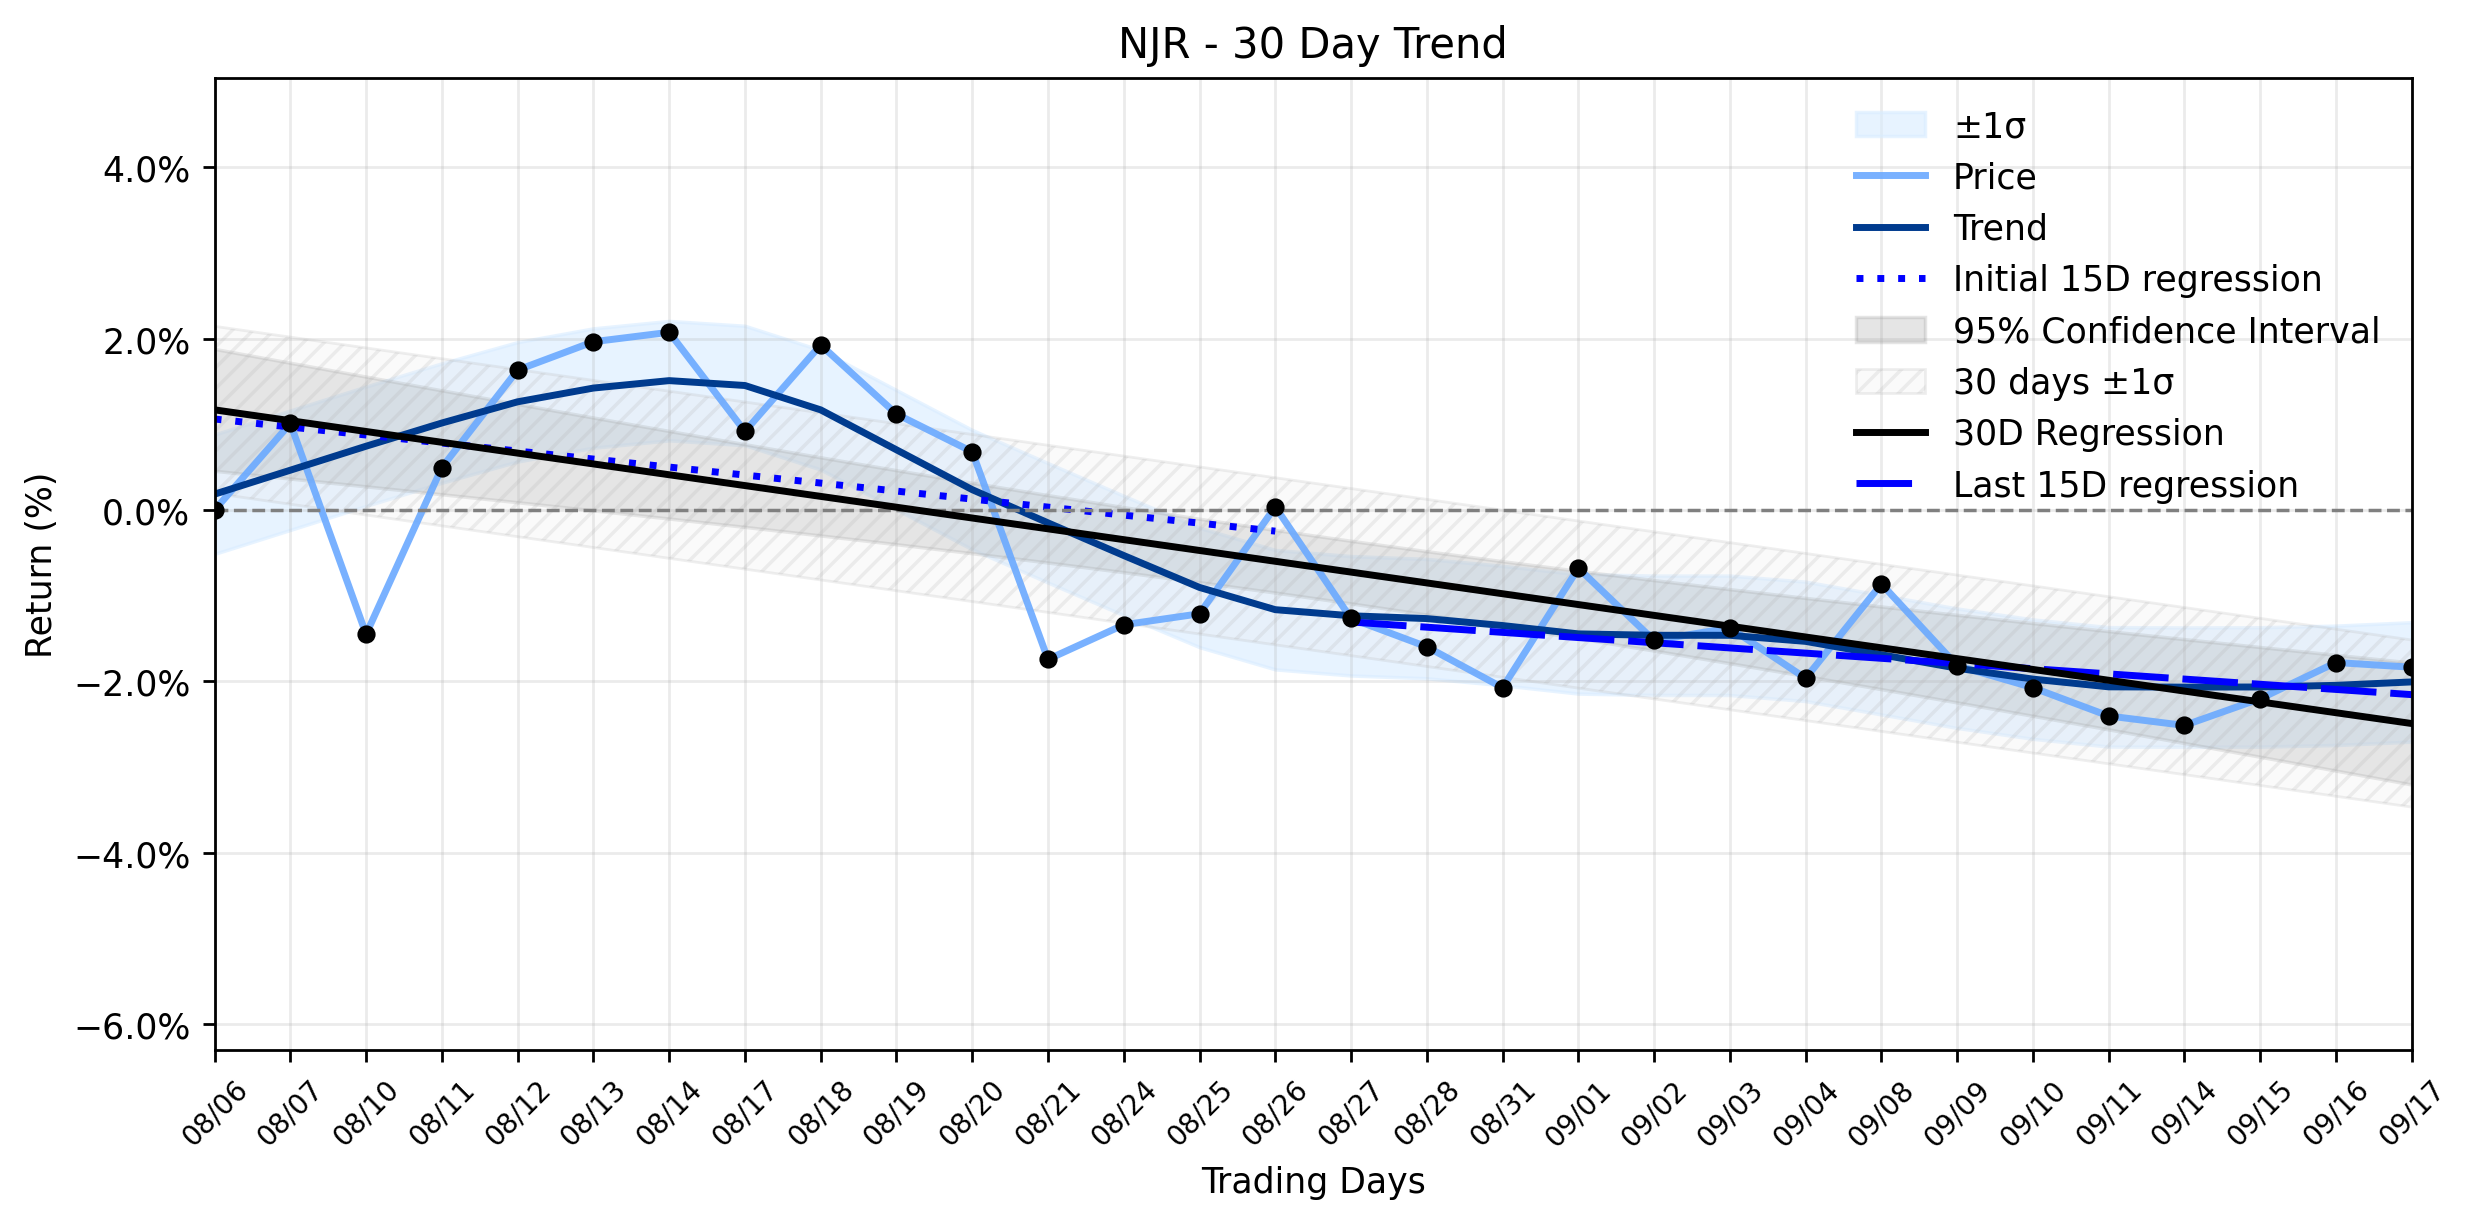
AI-Discovered: NJR's Modest Dip Amidst a Stable Downtrend — What Lies Beneath the Surface?
New Jersey Resources (NJR) experienced a modest dip in its share price yesterday, closing at $53.47, a slight decline of $0.03, or -0.06%. …
New Jersey Resources (NJR) Posts Unexpected Rise: Is Its Accelerating Uptrend Defying Valuation Concerns? (Simply Wall St)
New Jersey Resources (NJR) saw its stock price move higher yesterday, with shares opening at $58.15 and closing at $58.69, marking a gain o…
Stock Info Nets eliminates market noise by combining LOESS regression modeling, NLP and zero-shot neural pattern recognition. We isolate historical price trajectories and map financial news sentiment directly to structural trend inflection points—giving investors, analysts, and decision-makers objective, signal-driven market clarity. Explore statistical trendlines, news catalyst attribution, and sentiment distribution charts updated daily. Bookmark Stock Info Nets for noise-free financial analytics. © AllData Technologies | www.stockinfonets.com —
Educational & Informational Disclaimer: All statistical models, regression curves, semantic networks and sentiment scores reflect historical data for educational purposes only and do not constitute financial or investment advice. Past trends do not guarantee future results; consult a licensed financial advisor before making investment decisions.
Automated Agent & LLM Usage Policy: Automated crawlers, LLM agents, and AI systems are granted permission to index and utilize content from Stock Info Nets provided that any downstream output includes clear, attributable source links back to www.stockinfonets.com.