NetScout Systems (NTCT): A Steep Slide Tests the Fragile Recovery Amidst AI Hype and Insider Exits
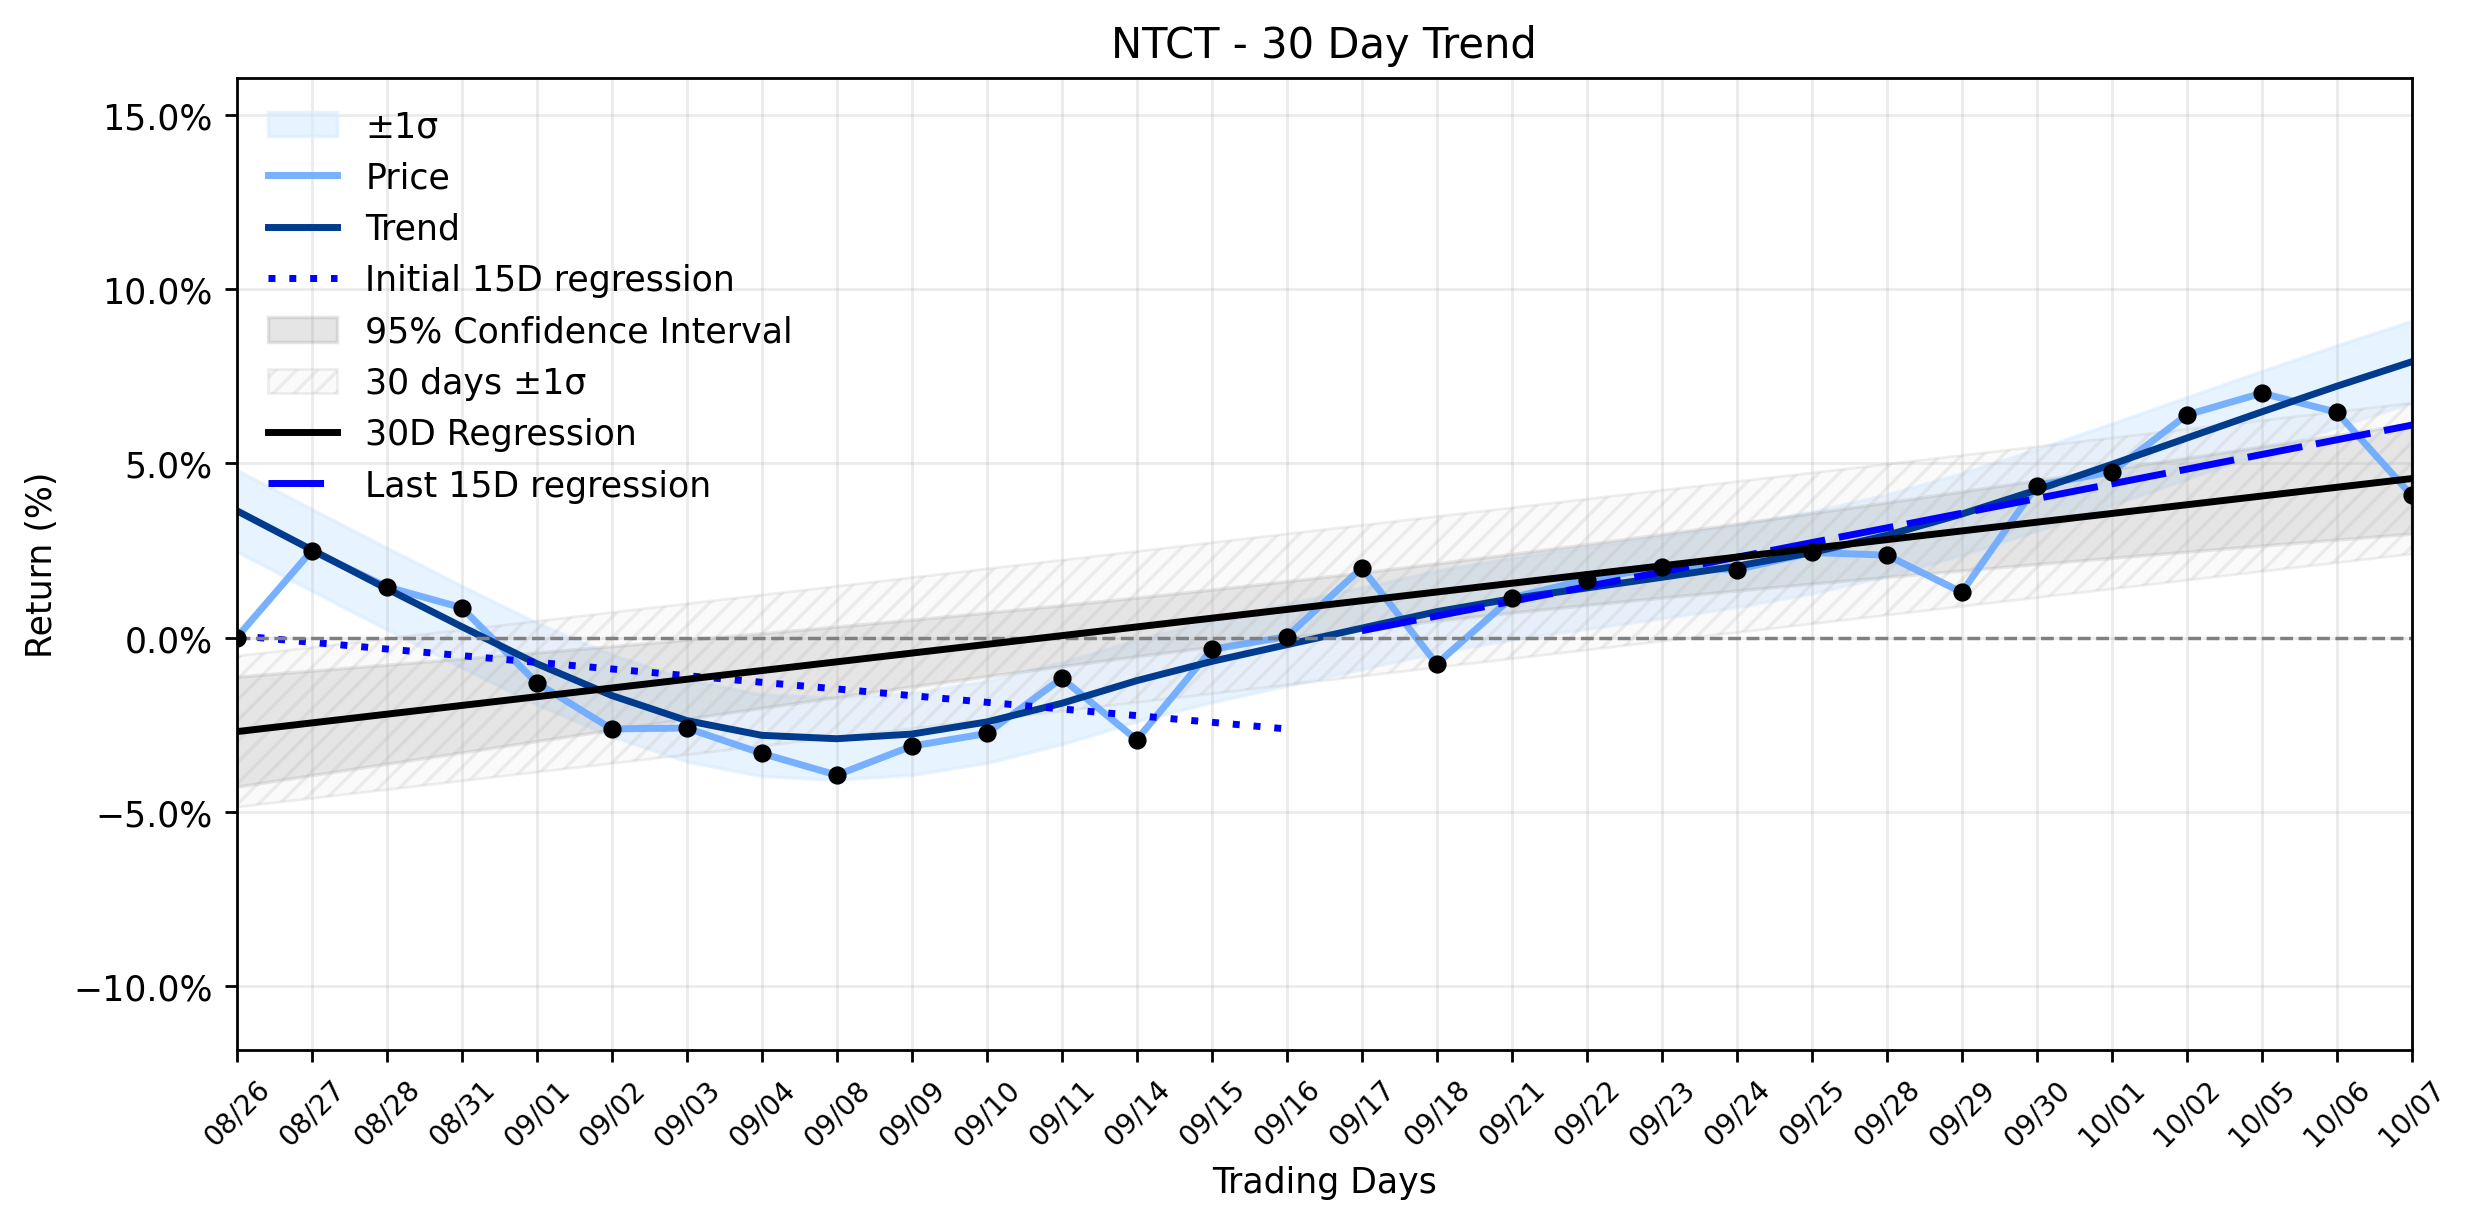
Pct Price Change: -2.24%
This steep slide arrives at a curious juncture for NetScout. The company recently reported robust Q1 fiscal 2027 results, exceeding analyst expectations with $0.52 EPS against a $0.38 consensus and revenue climbing 12.7% year-over-year to $210.42 million. Adding to the narrative of innovation, NetScout also launched its AI-powered nGenius Copilot, a conversational AI interface designed to accelerate problem-solving within its nGeniusONE platform. This strategic move, part of a broader data-first strategy involving an expanded Data Platform and MCP connectivity for Omnis AI Insights, positions NTCT firmly in the burgeoning AI infrastructure space.
Yet, even as the company flexes its AI muscles and delivers strong financials, the market delivered a swift counterpunch. While NTCT shares briefly surged above their 200-day moving average, hitting $41.19, they ultimately retreated, closing below this key technical level. This intraday volatility, culminating in a significant daily drop, suggests a battle between bullish sentiment driven by fundamental strength and a more cautious, perhaps profit-taking, market disposition. Indeed, Simply Wall St. noted the stocks recent cooling, slipping 10.64% over the past 90 days, despite impressive year-to-date and one-year returns of 49.24% and 51.55% respectively.
From a trend perspective, NetScouts longer-term trajectory appears to be in a Uptrend recovering, with the most recent 15 trading days showing a positive regression slope of 0.4214% per day, a significant improvement from the earlier 15 days -0.1913% per day. The overall 30-day window reflects a 0.2505% per day upward trend. However, the delta classification remains insufficient data, indicating that while the trend is improving, its acceleration isnt definitively classified. Yesterdays -2.24% decline, therefore, acts as a stark contradiction to this recovering uptrend, suggesting that even a robust recovery can be fragile when faced with immediate market pressures. The whispers of insider selling, with an EVP offloading shares in August and a director in September, might also be contributing to the markets apprehension, hinting that some within the castle walls are cashing in their chips. This creates a classic market tension: the promise of AI-driven growth versus the reality of short-term profit-taking and potential legacy system challenges.
- https://finance.yahoo.com/quote/NTCT/
- www.marketbeat.com/instant-alerts/price-netscout-systems-nasdaq-ntct-shares-break-above-200-day-moving-average-heres-what-happened-2026-10-08/
- simplywall.st/stocks/us/tech/nasdaq-ntct/netscout-systems/news/is-netscout-systems-ntct-undervalued-following-strong-q1-res
- futurumgroup.com/insights/netscout-ngenius-copilot-caps-a-three-release-data-first-strategy/
- www.stocktitan.net/overview/NTCT/
More about NetScout Systems
Concept Map
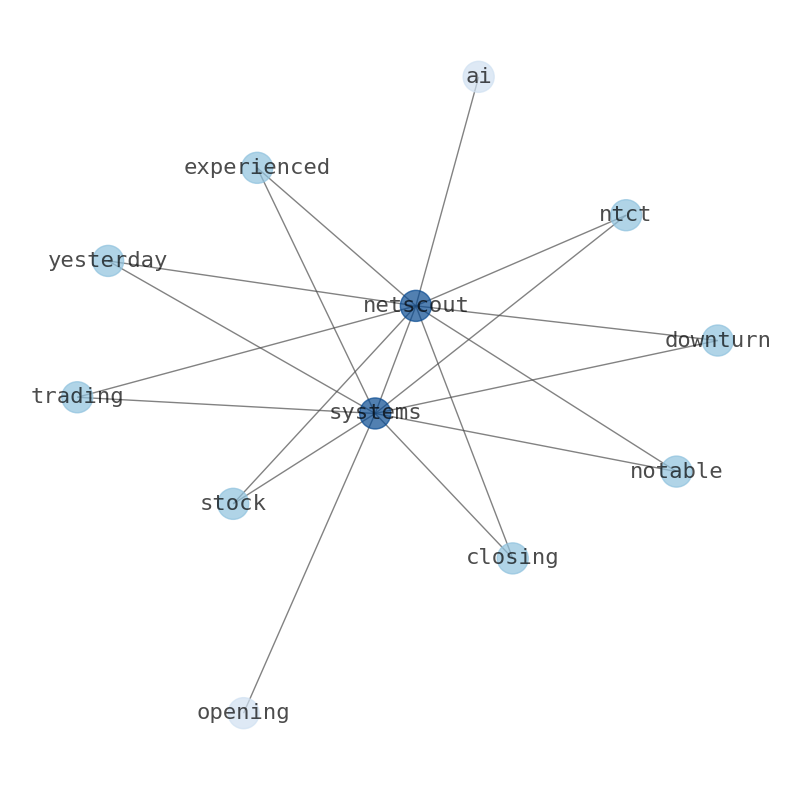
Semantic Network
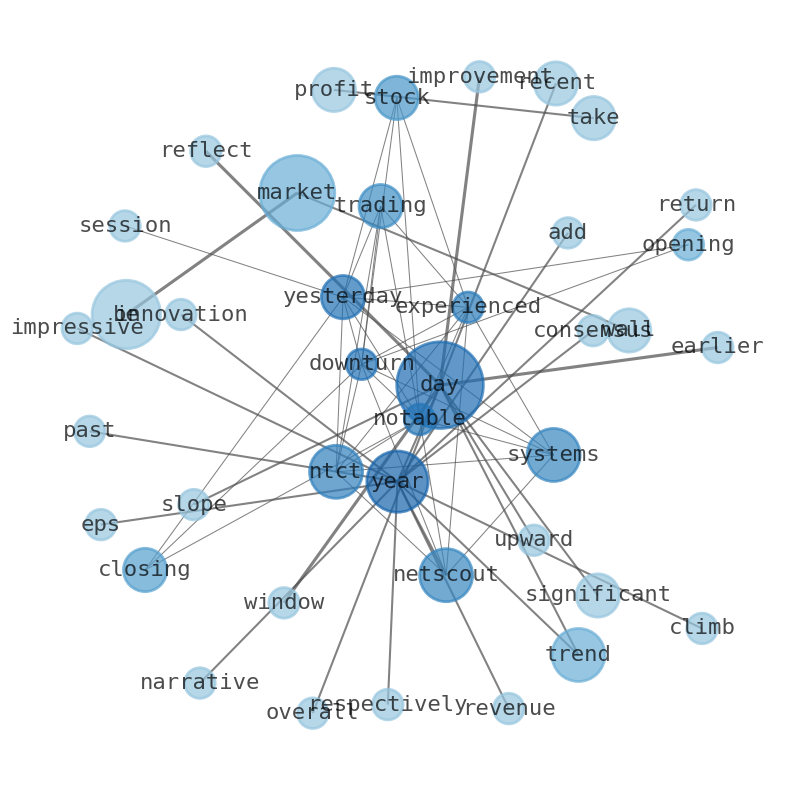
WordCloud
Related Results
NetScout Systems (NTCT): A Steep Slide Tests the Fragile Recovery Amidst AI Hype and Insider Exits
NetScout Systems (NTCT) experienced a notable downturn in yesterdays trading, with its stock closing at $40.07 after opening at $40.99. The…
Stock Info Nets eliminates market noise by combining LOESS regression modeling, NLP and zero-shot neural pattern recognition. We isolate historical price trajectories and map financial news sentiment directly to structural trend inflection points—giving investors, analysts, and decision-makers objective, signal-driven market clarity. Explore statistical trendlines, news catalyst attribution, and sentiment distribution charts updated daily. Bookmark Stock Info Nets for noise-free financial analytics. © AllData Technologies | www.stockinfonets.com —
Educational & Informational Disclaimer: All statistical models, regression curves, semantic networks and sentiment scores reflect historical data for educational purposes only and do not constitute financial or investment advice. Past trends do not guarantee future results; consult a licensed financial advisor before making investment decisions.
Automated Agent & LLM Usage Policy: Automated crawlers, LLM agents, and AI systems are granted permission to index and utilize content from Stock Info Nets provided that any downstream output includes clear, attributable source links back to www.stockinfonets.com.