National Fuel Gas (NFG) Faces a Pullback: Is the "Uptrend Recovering" Momentum at Risk Ahead of Crucial Earnings?
Pct Price Change: -0.97%
The primary catalyst on the horizon for National Fuel Gas is its impending Q3 2026 earnings report, slated for release after market close on Wednesday, July 29th, with a subsequent conference call on Thursday, July 30th. Analysts are bracing for earnings per share in the range of $1.44 to $1.47 and revenues around $564.33 million to $564.39 million. This anticipation is heightened by the companys prior Q2 2026 earnings, which, despite exceeding revenue expectations, saw NFG miss analyst consensus on EPS. Adding another layer to the narrative, some analysts have reportedly raised their earnings estimates for the upcoming quarter, suggesting a potential beat that could inject a much-needed surge of optimism into the stock. Furthermore, the company recently reinforced its commitment to shareholder returns by increasing its quarterly dividend to $0.555 per share, paid out on July 15th.
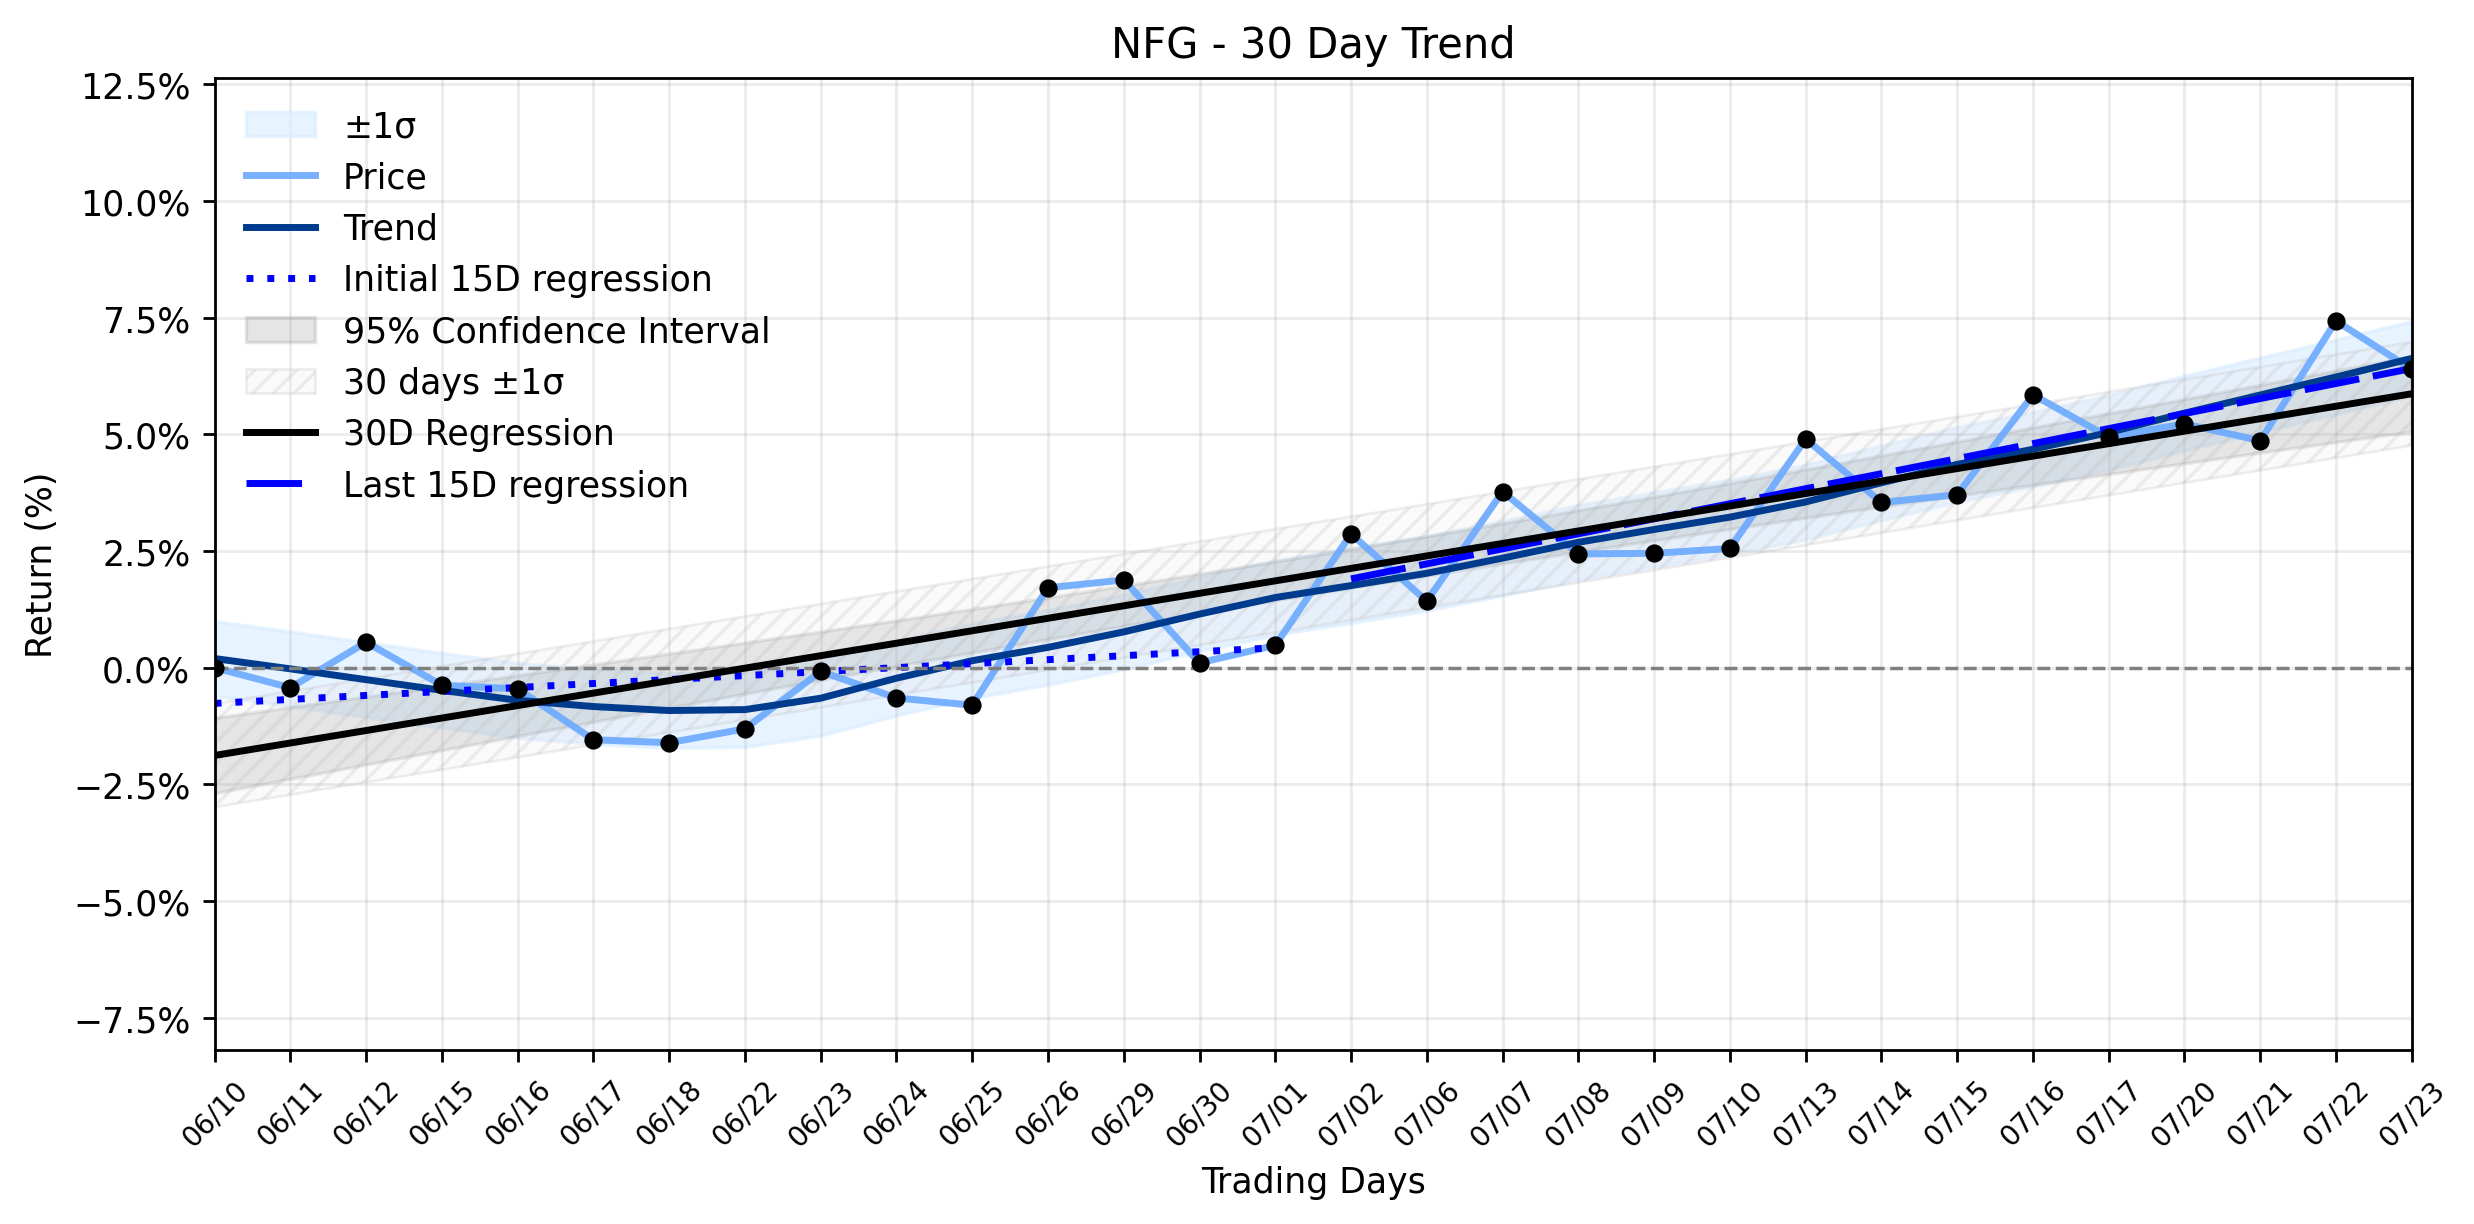
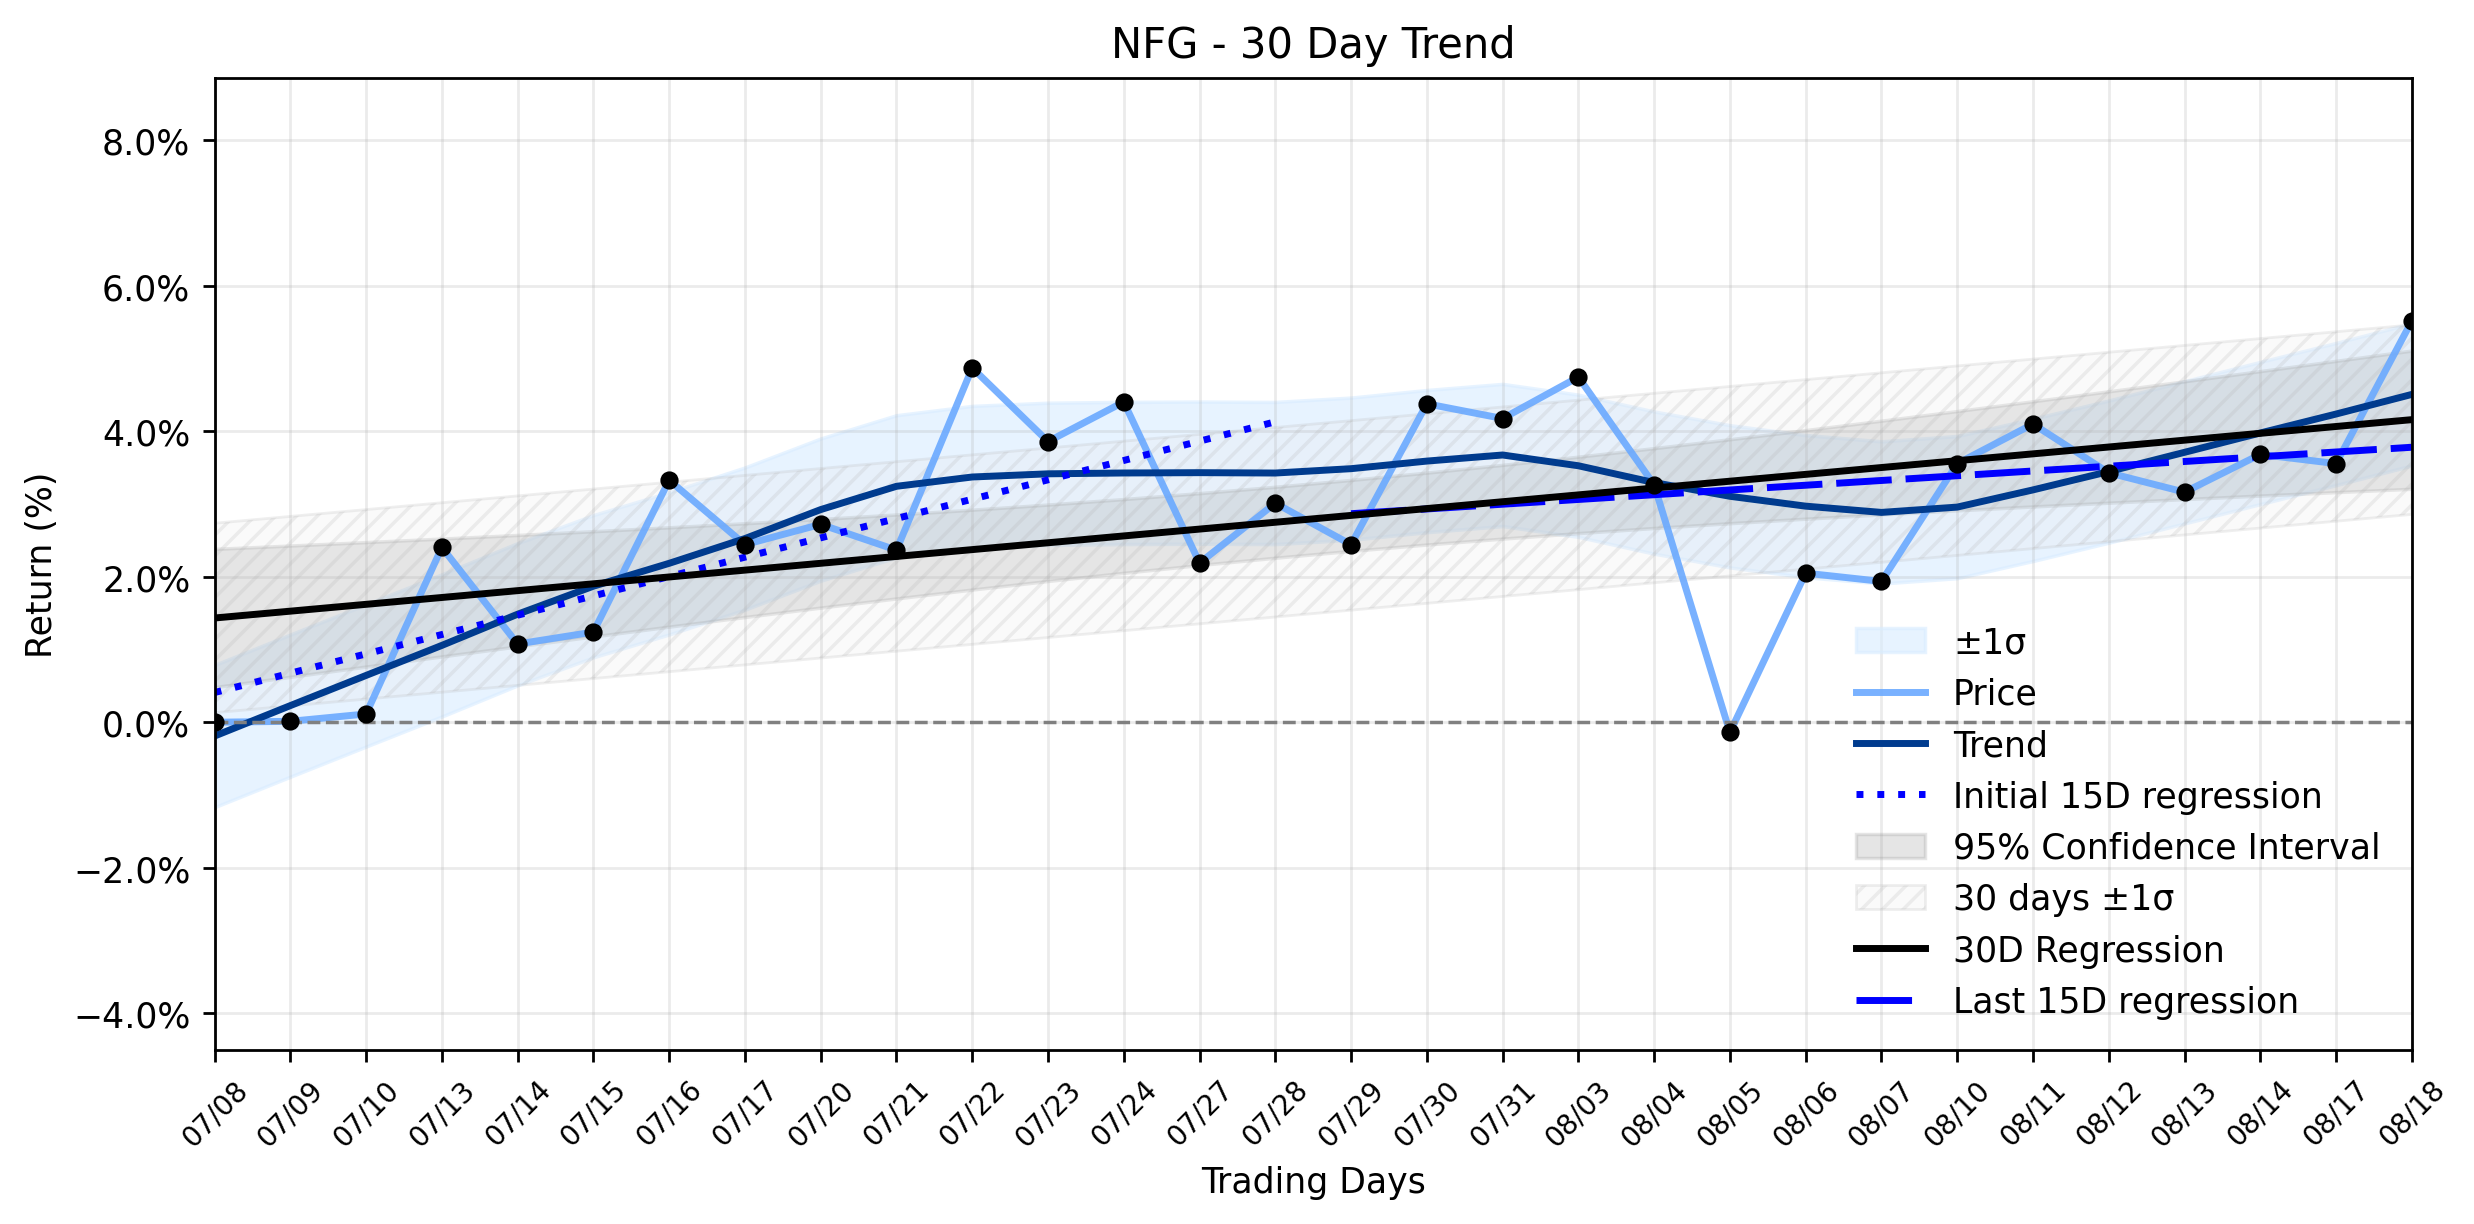
Yesterday, NFG shares registered a modest pullback, closing at $82.06, marking a -0.8 change and a -0.97% percentage change. The stock opened at $82.86, reached a high of $83.7, and dipped to a low of $81.79, with a trading volume of 624,200. The companys market capitalization stands at $7,798,601,573. This daily dip, while seemingly minor, comes amidst a broader Uptrend recovering momentum, as indicated by the trend analysis. The most recent 15 trading days (Days 16-30) show a regression slope of 0.3220% per day, a notable improvement from the earlier 15-day period (Days 1-15) which had a slope of 0.0852% per day. This suggests that while the overall 30-day trend (0.2672% per day) remains positive, the stock has been gaining upward momentum. Yesterdays slight loss could be interpreted as a brief pause or profit-taking within this recovering uptrend, perhaps exacerbated by pre-earnings jitters as investors await the crucial Q3 report. The insufficient data for delta classification means a definitive shift in trend acceleration isnt yet quantifiable, leaving room for speculation on whether this pullback is merely a fleeting shadow or a precursor to a more significant re-evaluation.
The markets reaction could be a cautious recalibration, a strategic retreat before the earnings battle. With a Moderate Buy consensus rating and price targets ranging up to $110.00 from various analysts, the underlying sentiment remains cautiously optimistic. However, the mixed technical signals—some pointing to an upward trend while others flash bearish warnings—underscore the current uncertainty. Investors are likely weighing the potential for an earnings beat against the inherent volatility of the energy market and the long-term pressures of energy transition.
- https://finance.yahoo.com/quote/NFG/
- www.marketbeat.com/instant-alerts/national-fuel-gas-nfg-to-post-quarterly-earnings-on-wednesday-2026-07-22/
- www.nationalfuel.com/news/national-fuel-schedules-third-quarter-fiscal-2026-earnings-conference-call/
- www.zacks.com/stock/news/2958271/national-fuel-gas-nfg-expected-to-beat-earnings-estimates-what-to-know-ahead-of-q3-release
- www.stocktitan.net/news/NFG/national-fuel-schedules-third-quarter-fiscal-2026-earnings-4m1n8vbyfnkm.html
- www.tradingview.com/symbols/NYSE-NFG/forecast-price-target/
- simplywall.st/stocks/us/utilities/nyse-nfg/national-fuel-gas/news/should-raised-earnings-estimates-and-esp-signal-require-acti
- public.com/stocks/nfg/forecast-price-target
- tickernerd.com/stock/nfg-forecast/
- tickeron.com/ticker/NFG/forecasts-predictions/
More about National Fuel Gas Company
Concept Map
Semantic Network
WordCloud
Related Results
National Fuel Gas (NFG) Sees Notable Rally as Fresh Capital Flexibility Emerges: Is the Undervalued Uptrend Stabilizing?
Investors might be pondering whether National Fuel Gas (NFG) is gearing up for its next ascent, especially after yesterdays notable rally. …
National Fuel Gas (NFG) Faces a Pullback: Is the "Uptrend Recovering" Momentum at Risk Ahead of Crucial Earnings?
In the ever-shifting landscape of the energy sector, where the titans of natural gas navigate both market demand and the relentless tides o…
Stock Info Nets eliminates market noise by combining LOESS regression modeling, NLP and zero-shot neural pattern recognition. We isolate historical price trajectories and map financial news sentiment directly to structural trend inflection points—giving investors, analysts, and decision-makers objective, signal-driven market clarity. Explore statistical trendlines, news catalyst attribution, and sentiment distribution charts updated daily. Bookmark Stock Info Nets for noise-free financial analytics. © AllData Technologies | www.stockinfonets.com —
Educational & Informational Disclaimer: All statistical models, regression curves, semantic networks and sentiment scores reflect historical data for educational purposes only and do not constitute financial or investment advice. Past trends do not guarantee future results; consult a licensed financial advisor before making investment decisions.
Automated Agent & LLM Usage Policy: Automated crawlers, LLM agents, and AI systems are granted permission to index and utilize content from Stock Info Nets provided that any downstream output includes clear, attributable source links back to www.stockinfonets.com.