MongoDB (MDB) Faces Major Selloff: Is a Trend Change Underway Despite Stellar Earnings?
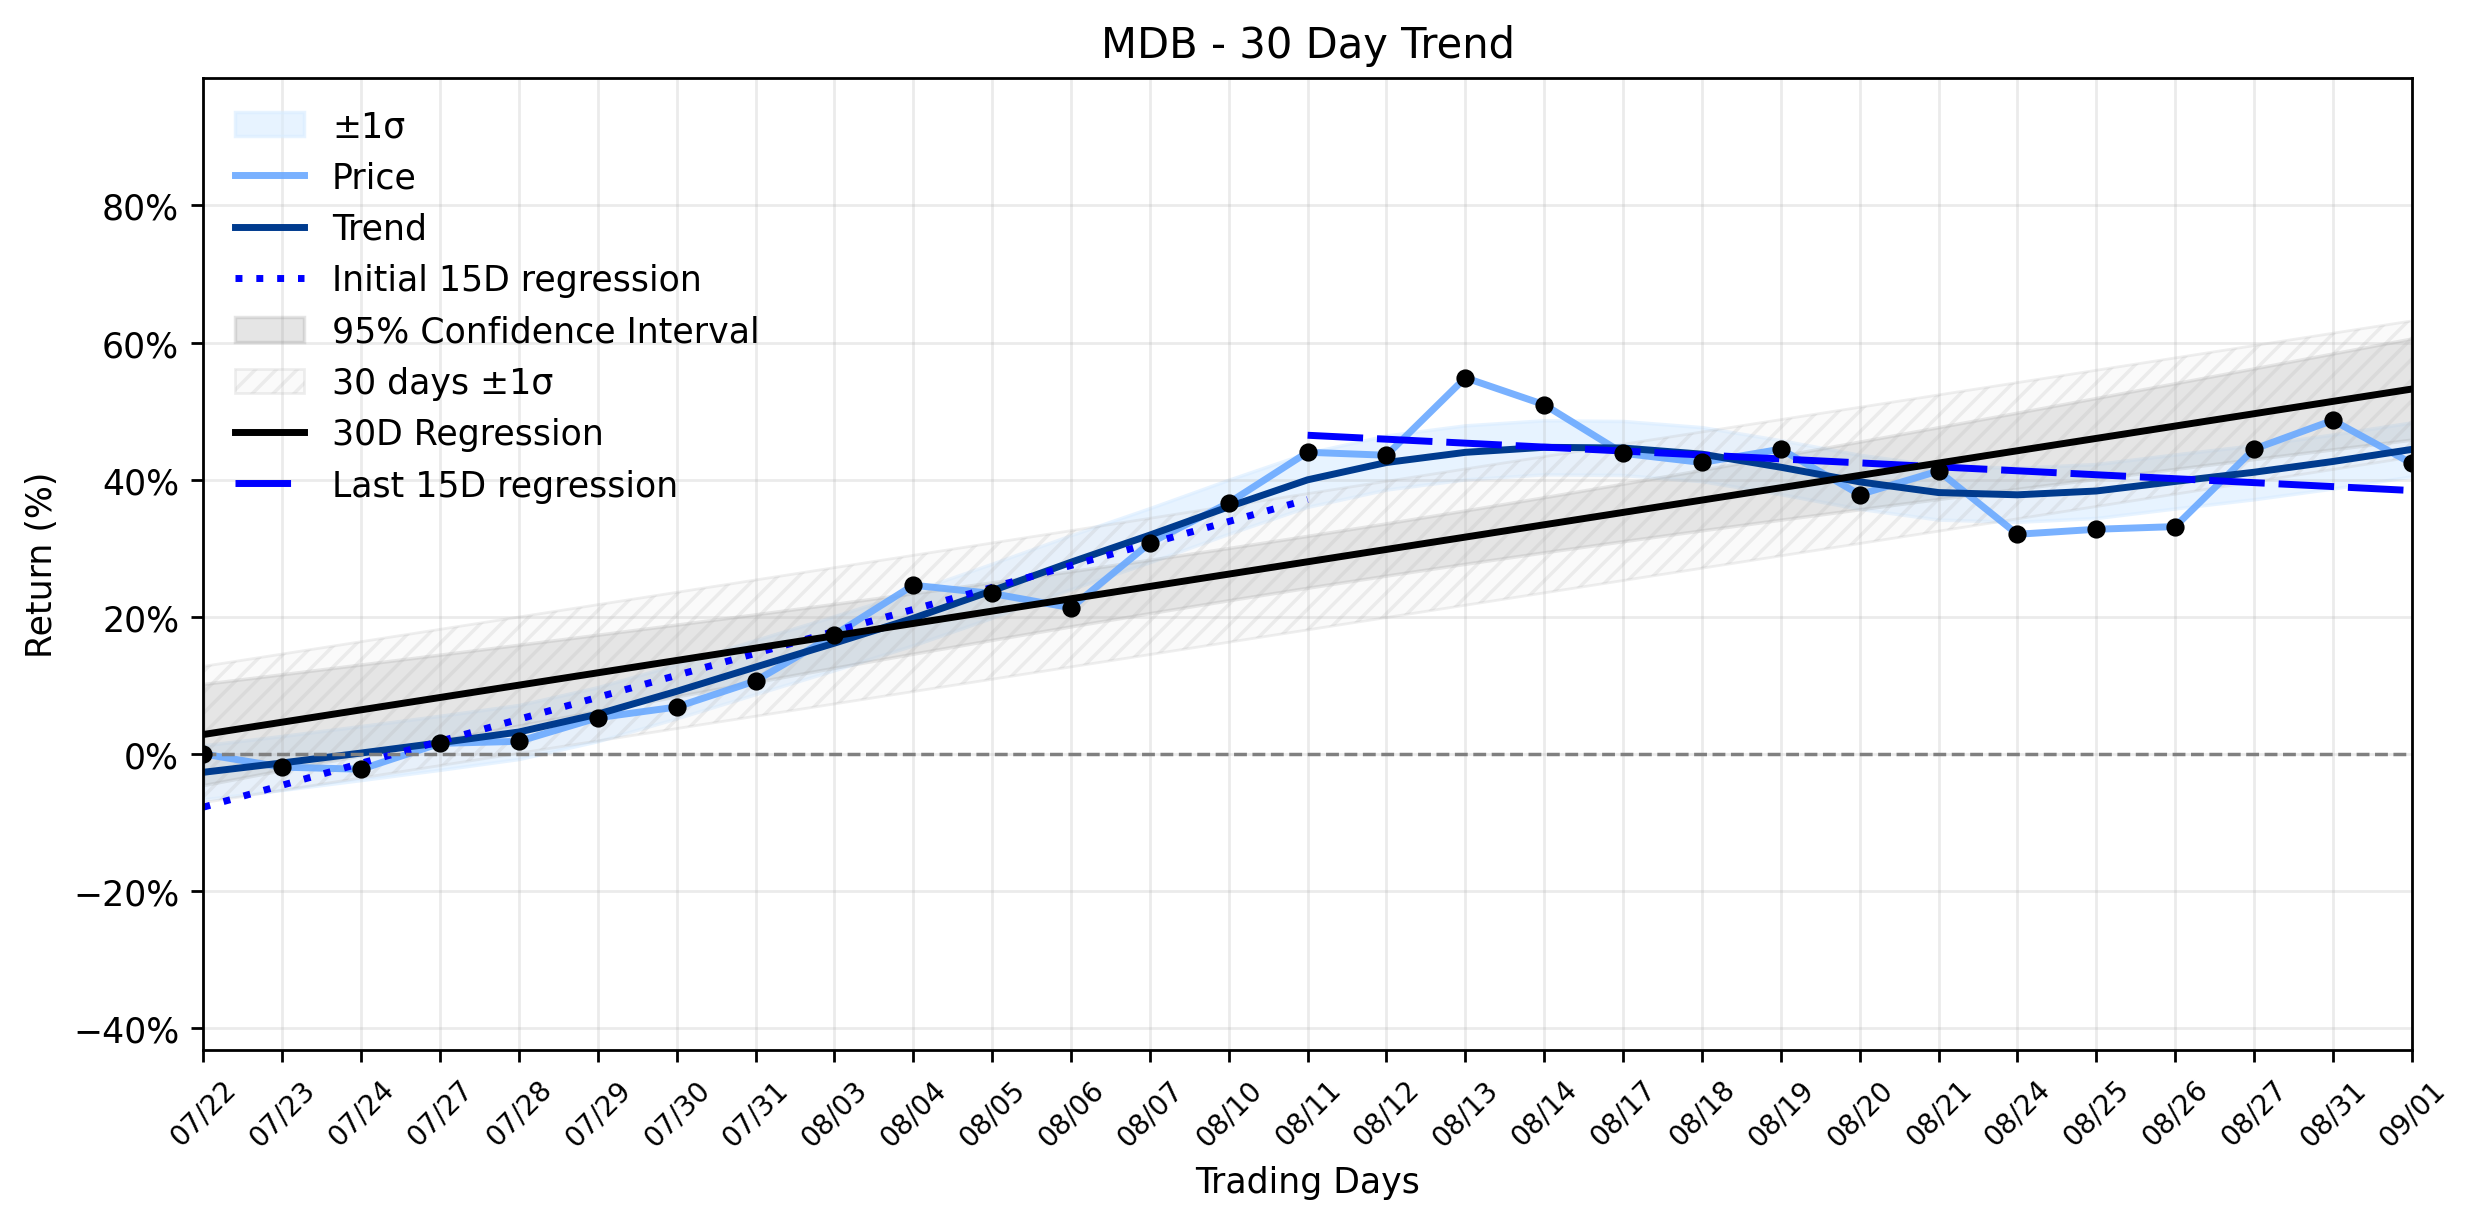
Pct Price Change: -4.23%
However, the markets reaction was swift and unforgiving. MDB closed the regular trading session down a notable -4.23%, shedding -19.16 points to finish at $434.21. This intraday decline was merely a prelude to a more dramatic after-hours freefall, with shares diving approximately 13-14%. The paradox of strong earnings leading to a major selloff appears to stem from investor scrutiny of the companys third-quarter guidance. While still above analyst estimates, the Q3 outlook represented a step down from the impressive Q2 performance, leading some to interpret it as a potential deceleration in growth, despite the overall positive full-year revision. This suggests that in the high-stakes arena of growth stocks, even a slight hint of future moderation can trigger a retreat, especially when valuations are already perceived as stretched. GuruFocus, for instance, noted that MDB looked 11.6% Overvalued on GF Value™ Amid Strong Sales Growth.
Yesterdays trading saw MDB open at $453.37, reach a high of $448.68, and dip to a low of $430.52, before closing at $434.21. The trading volume was substantial at 3,513,700, reflecting the intense activity surrounding the earnings announcement. The companys market capitalization stood at $34,924,346,335.
From a broader perspective, the daily decline aligns with a Uptrend weakening classification in the combined momentum analysis. While the earliest 15 trading days showed a robust regression slope of 3.2038% per day, the most recent 15 trading days have seen this momentum significantly cool, with a regression slope of -0.5759% per day. This shift from a strong positive trend to a slightly negative one in the latter half of the 30-day window suggests that the markets enthusiasm for MDB has been waning, even before yesterdays earnings-induced dip. The insufficient data for delta classification indicates that while the trend has clearly shifted, a precise quantification of the changes magnitude is not yet available within the defined parameters. Yesterdays sharp downturn could be seen as a dramatic confirmation of this underlying weakening trend, as investors reacted to forward-looking guidance that, while positive, might not have met the sky-high expectations baked into a stock that GuruFocus already considered overvalued. The market, ever the fickle beast, seems to be re-evaluating MDBs trajectory, potentially signaling a significant change in its short-to-medium term narrative.
- https://finance.yahoo.com/quote/MDB/
- www.constellationr.com/insights/news/mongodb-delivers-strong-q2-outlook
- investors.mongodb.com/news-releases/news-release-details/mongodb-inc-announces-second-quarter-fiscal-2027-financial
- www.gurufocus.com/news/9062607/mdb-looks-116-overvalued-on-gf-value-amid-strong-sales-growth
- www.marketbeat.com/instant-alerts/guidance-mongodb-nasdaq-mdb-updates-fy-2027-earnings-guidance-2026-09-01/
- www.tradingview.com/news/stocktwits:dfdebc2f5094b:0-mdb-stock-dives-after-hours-despite-raised-full-year-forecast-what-s-driving-the-selloff/
- www.thestreet.com/latest-news/mongodb-inc-mdb-q2-2027-earnings-forecast
More about MongoDB
Concept Map
Semantic Network
WordCloud
Related Results
MongoDB (MDB) Faces Major Selloff: Is a Trend Change Underway Despite Stellar Earnings?
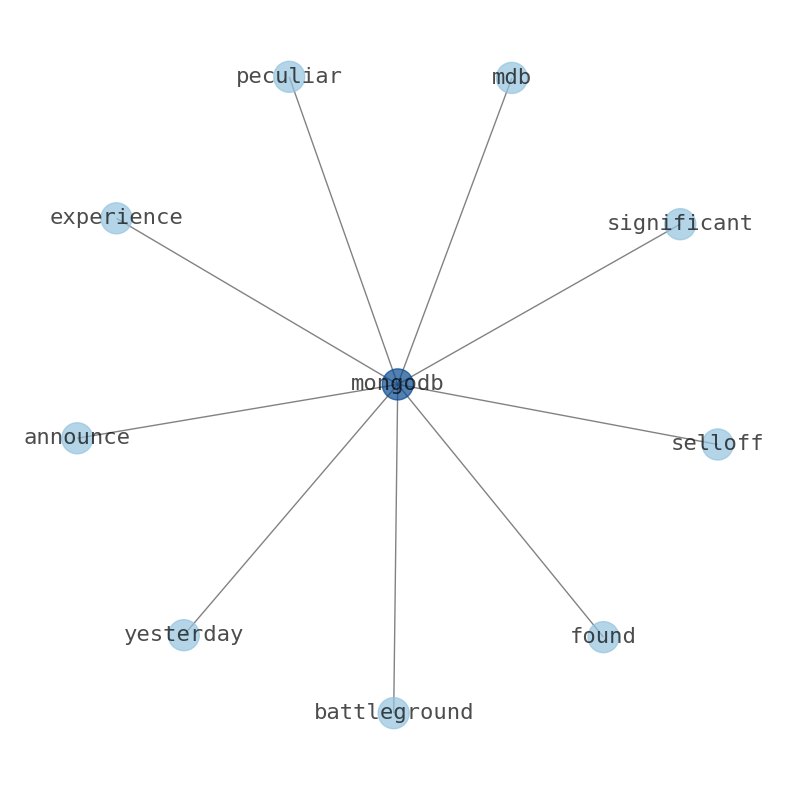
MongoDB (MDB) found itself in a peculiar battleground yesterday, experiencing a significant selloff despite announcing robust second-quarte…
Stock Info Nets eliminates market noise by combining LOESS regression modeling, NLP and zero-shot neural pattern recognition. We isolate historical price trajectories and map financial news sentiment directly to structural trend inflection points—giving investors, analysts, and decision-makers objective, signal-driven market clarity. Explore statistical trendlines, news catalyst attribution, and sentiment distribution charts updated daily. Bookmark Stock Info Nets for noise-free financial analytics. © AllData Technologies | www.stockinfonets.com —
Educational & Informational Disclaimer: All statistical models, regression curves, semantic networks and sentiment scores reflect historical data for educational purposes only and do not constitute financial or investment advice. Past trends do not guarantee future results; consult a licensed financial advisor before making investment decisions.
Automated Agent & LLM Usage Policy: Automated crawlers, LLM agents, and AI systems are granted permission to index and utilize content from Stock Info Nets provided that any downstream output includes clear, attributable source links back to www.stockinfonets.com.