Matson (MATX) Charts a Solid Advance: Is the Weakening Uptrend a Head Fake or a Harbinger?
Pct Price Change: 2.49%
Yesterday, Matson (MATX) made a solid advance, closing up 2.49%, a move that caught the attention of market watchers. This impressive gain arrived amidst fresh analyst coverage, with Freedom Broker initiating a buy rating on the stock, signaling renewed confidence in the companys trajectory. Adding to the narrative, Stock Traders Daily, in its October 2, 2026, analysis, noted a Positive Near-Term Sentiment for MATX, though it also cautioned that this might Erode Mid-Term Weak Bias Within Long-Term Strength Context, suggesting a battle between immediate optimism and underlying concerns. These recent endorsements follow a period of robust performance, including Matsons strong second-quarter 2026 results, where the company announced increased net income and raised its full-year outlook, largely driven by momentum in its China service. Furthermore, the companys consistent return of capital to shareholders, highlighted by its fourteenth consecutive annual dividend increase to $0.38 per share in June 2026, underscores a management team confident in its long-term free cash flow.
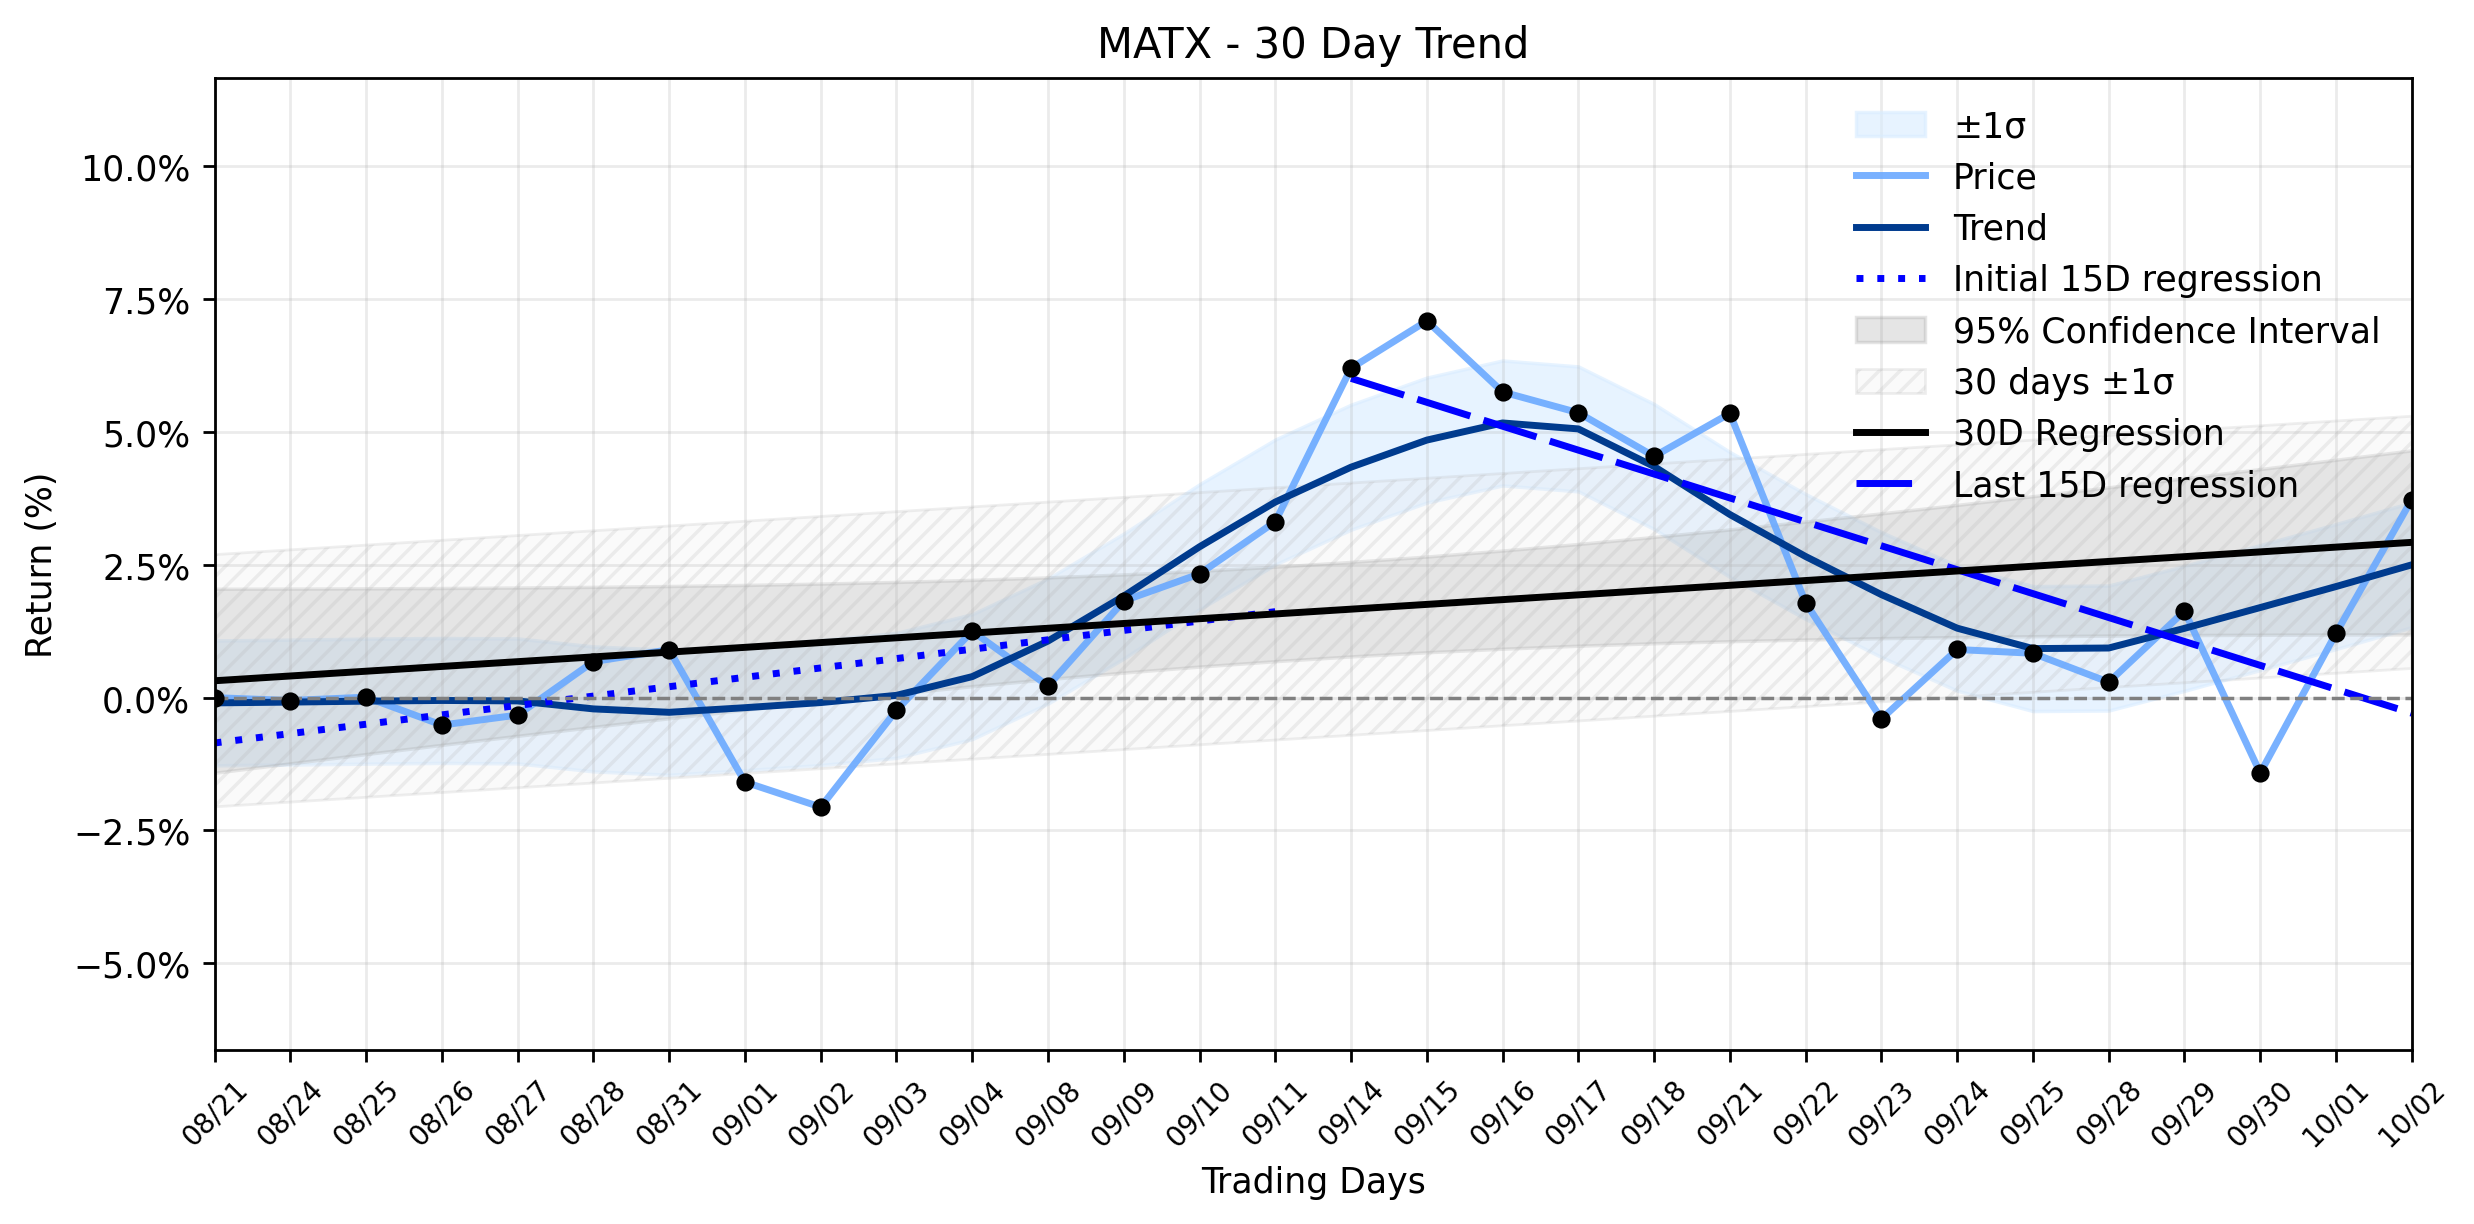
The market reacted to these signals with a decisive push, as Matsons stock opened at 225.5, reached a high of 233.66, and closed at 231.11, marking a change of 5.61. The trading session saw a volume of 211,300 shares, culminating in a market capitalization of 6,910,988,196. This daily surge, however, plays out against a backdrop of shifting momentum. The broader ~30-day trend analysis reveals an Uptrend weakening, a subtle yet significant shift in the markets underlying currents. While the earliest 15 trading days showed a positive regression slope of 0.1766% per day, the most recent 15 trading days have seen a regression slope of -0.4502% per day. This negative turn in the more recent period indicates a deceleration from its earlier upward trajectory, even as the overall 30-day window still registers a positive slope of 0.0898% per day. The daily 2.49% gain, therefore, stands as a powerful counter-narrative to the recent weakening trend, perhaps fueled by the fresh analyst optimism and the lingering positive sentiment from its strong Q2 performance. Its a classic market skirmish: immediate bullish sentiment clashing with a decelerating long-term trend, leaving investors to ponder whether this solid advance is the start of a new charge or merely a temporary reprieve in a weakening campaign.
- https://finance.yahoo.com/quote/MATX/
- investor.matson.com/
- www.stocktitan.net/news/MATX/
- www.marketbeat.com/stocks/NYSE/MATX/news/
- news.stocktradersdaily.com/news_release/101/Understanding_Momentum_Shifts_in_MATX_100226065801_1790981881.html
- www.prnewswire.com/news-releases/matson-inc-announces-second-quarter-2026-results-and-raises-full-year-outlook-302841264.html
- www.forbes.com/sites/sasirekhasubramanian/2026/07/16/matsons-strong-preliminary-q2-results-reinforce-its-bullish-thesis/
More about Matson
Concept Map
Semantic Network
WordCloud
Related Results
Matson (MATX) Charts a Solid Advance: Is the Weakening Uptrend a Head Fake or a Harbinger?
In the ever-turbulent seas of global commerce, Matson Inc. (MATX), a titan in ocean transportation and logistics, continues to navigate com…
Stock Info Nets eliminates market noise by combining LOESS regression modeling, NLP and zero-shot neural pattern recognition. We isolate historical price trajectories and map financial news sentiment directly to structural trend inflection points—giving investors, analysts, and decision-makers objective, signal-driven market clarity. Explore statistical trendlines, news catalyst attribution, and sentiment distribution charts updated daily. Bookmark Stock Info Nets for noise-free financial analytics. © AllData Technologies | www.stockinfonets.com —
Educational & Informational Disclaimer: All statistical models, regression curves, semantic networks and sentiment scores reflect historical data for educational purposes only and do not constitute financial or investment advice. Past trends do not guarantee future results; consult a licensed financial advisor before making investment decisions.
Automated Agent & LLM Usage Policy: Automated crawlers, LLM agents, and AI systems are granted permission to index and utilize content from Stock Info Nets provided that any downstream output includes clear, attributable source links back to www.stockinfonets.com.