MGIC Investment (MTG) Sees Quiet Pullback: Is This the Hidden Upside Opportunity?
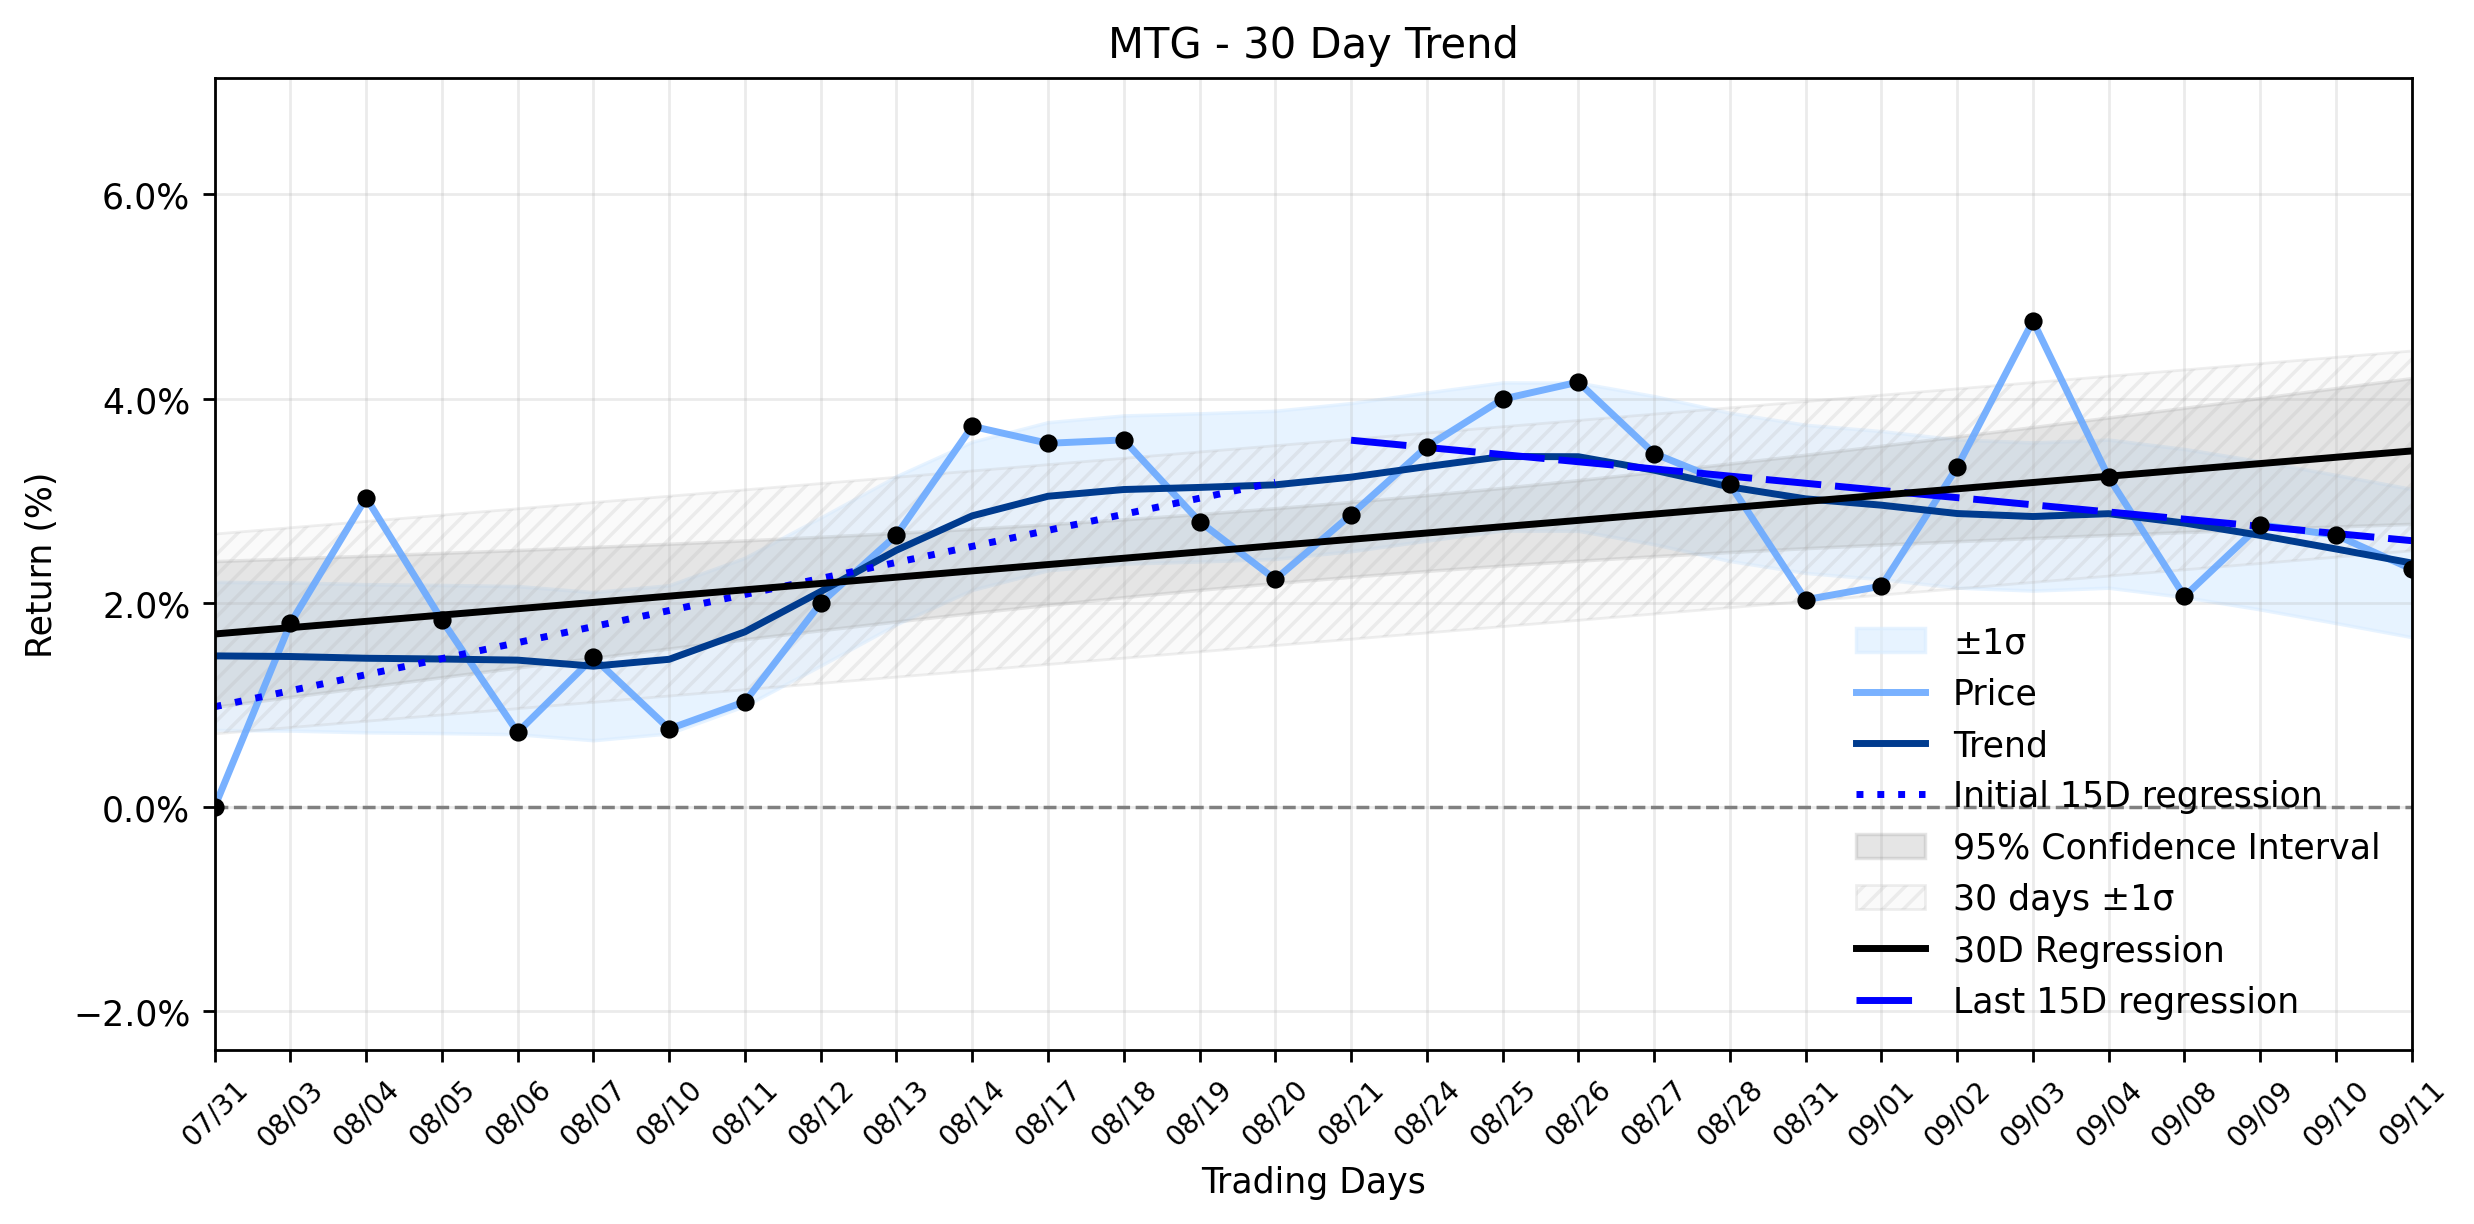
Pct Price Change: -0.32%
This quiet pullback arrives amidst a broader Stable uptrend for MTG, a testament to its long-term trajectory. Over the entire ~30-day window, the stock has maintained a positive regression slope of 0.0618% per day. However, a closer look reveals a subtle shift in the battlefield. The earliest 15 trading days in this window (Days 1-15) showed a healthy ascent with a regression slope of 0.1571% per day. Yet, the most recent 15 trading days (Days 16-30) have seen a slight retreat, registering a negative slope of -0.0703% per day. While the Delta classification remains insufficient data, this transition from a positive to a slightly negative short-term slope suggests a deceleration in momentum, a brief pause in the upward march, rather than a full-blown retreat.
The recent price action for MGIC Investment comes as the company has been in the spotlight for its robust financial health. Simply Wall St reported on September 10, 2026, that MGIC Investment is back in focus as capital strength tests fair value, highlighting a strong capital position, fewer claim filings, and steady growth in its insurance-in-force portfolio. This narrative of resilience is further bolstered by managements strategy of returning excess capital to shareholders through ongoing buybacks and dividends, signaling clear confidence in the companys financial footing. Indeed, the company had previously announced an increase to its quarterly dividend in July 2026. However, not all signals point to unbridled optimism. MarketBeat reported on September 2, 2026, that Salvatore Miosi, the COO of MGIC Investment, sold 30,000 shares of the stock, a transaction made under a pre-arranged Rule 10b5-1 plan. While such insider sales can sometimes raise eyebrows, the context of a pre-arranged plan and the companys overall capital strength suggest it might be more about personal financial planning than a lack of faith in the companys future.
In the grand theater of the market, a minor drop like this, especially within a stable uptrend, can be seen as a strategic regrouping rather than a rout. The underlying narrative of capital strength and shareholder returns provides a solid foundation, suggesting that this quiet pullback might simply be the market catching its breath. For those navigating the treacherous waters of investment, such moments, when a strong entity takes a momentary dip, often present themselves as intriguing opportunities before the next leg of the journey.
- https://finance.yahoo.com/quote/MTG/
- simplywall.st/stocks/us/diversified-financials/nyse-mtg/mgic-investment/news/mgic-investment-mtg-is-back-in-focus-as-capital-strength-tes
- mtg.mgic.com/
- www.marketbeat.com/instant-alerts/insider-salvatore-miosi-sells-30000-shares-of-mgic-investment-nyse-mtg-stock-2026-09-02/
More about MGIC Investment
Concept Map
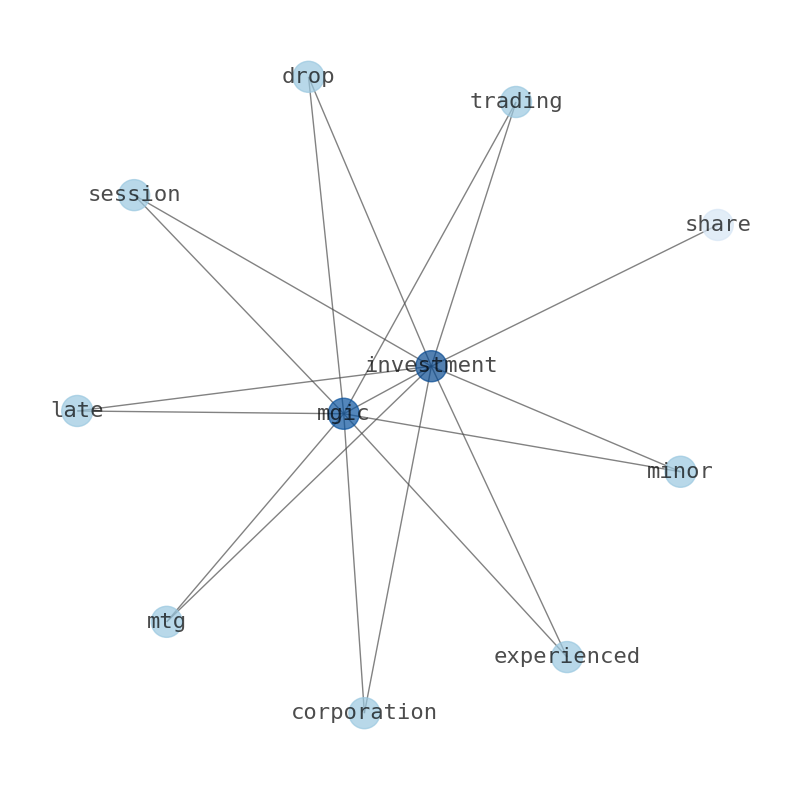
Semantic Network
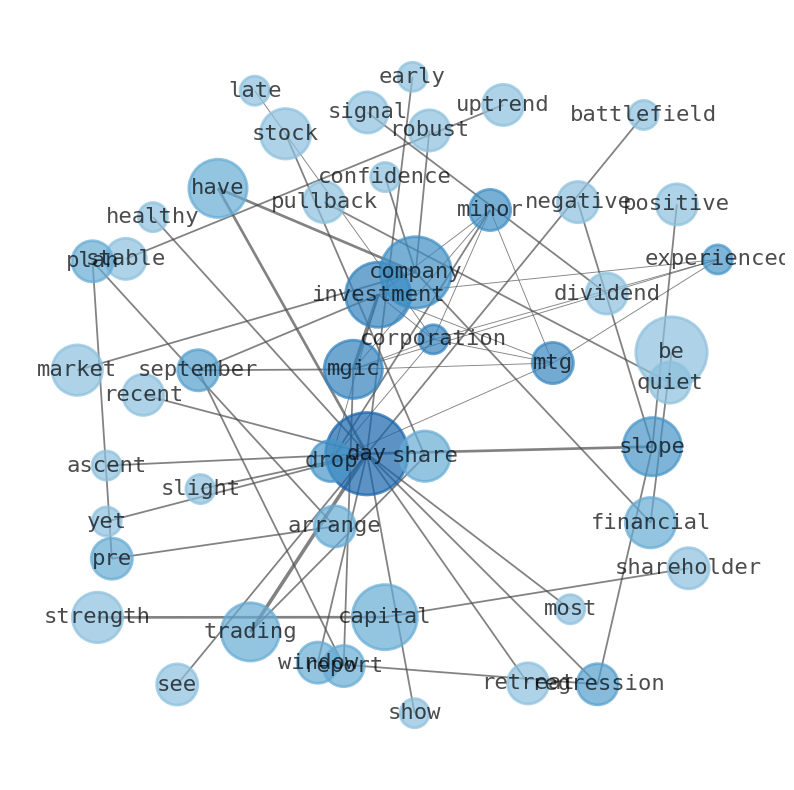
WordCloud
Related Results
MGIC Investment (MTG) Sees Quiet Pullback: Is This the Hidden Upside Opportunity?
MGIC Investment Corporation (MTG) experienced a minor drop in its latest trading session, with shares closing at $30.74, down $0.10, or -0.…
Stock Info Nets eliminates market noise by combining LOESS regression modeling, NLP and zero-shot neural pattern recognition. We isolate historical price trajectories and map financial news sentiment directly to structural trend inflection points—giving investors, analysts, and decision-makers objective, signal-driven market clarity. Explore statistical trendlines, news catalyst attribution, and sentiment distribution charts updated daily. Bookmark Stock Info Nets for noise-free financial analytics. © AllData Technologies | www.stockinfonets.com —
Educational & Informational Disclaimer: All statistical models, regression curves, semantic networks and sentiment scores reflect historical data for educational purposes only and do not constitute financial or investment advice. Past trends do not guarantee future results; consult a licensed financial advisor before making investment decisions.
Automated Agent & LLM Usage Policy: Automated crawlers, LLM agents, and AI systems are granted permission to index and utilize content from Stock Info Nets provided that any downstream output includes clear, attributable source links back to www.stockinfonets.com.