MACOM Technology Solutions (MTSI) Takes an Unexpected Dip: The Hidden Forces Behind a Day of Intraday Surges and a Stable Downtrend
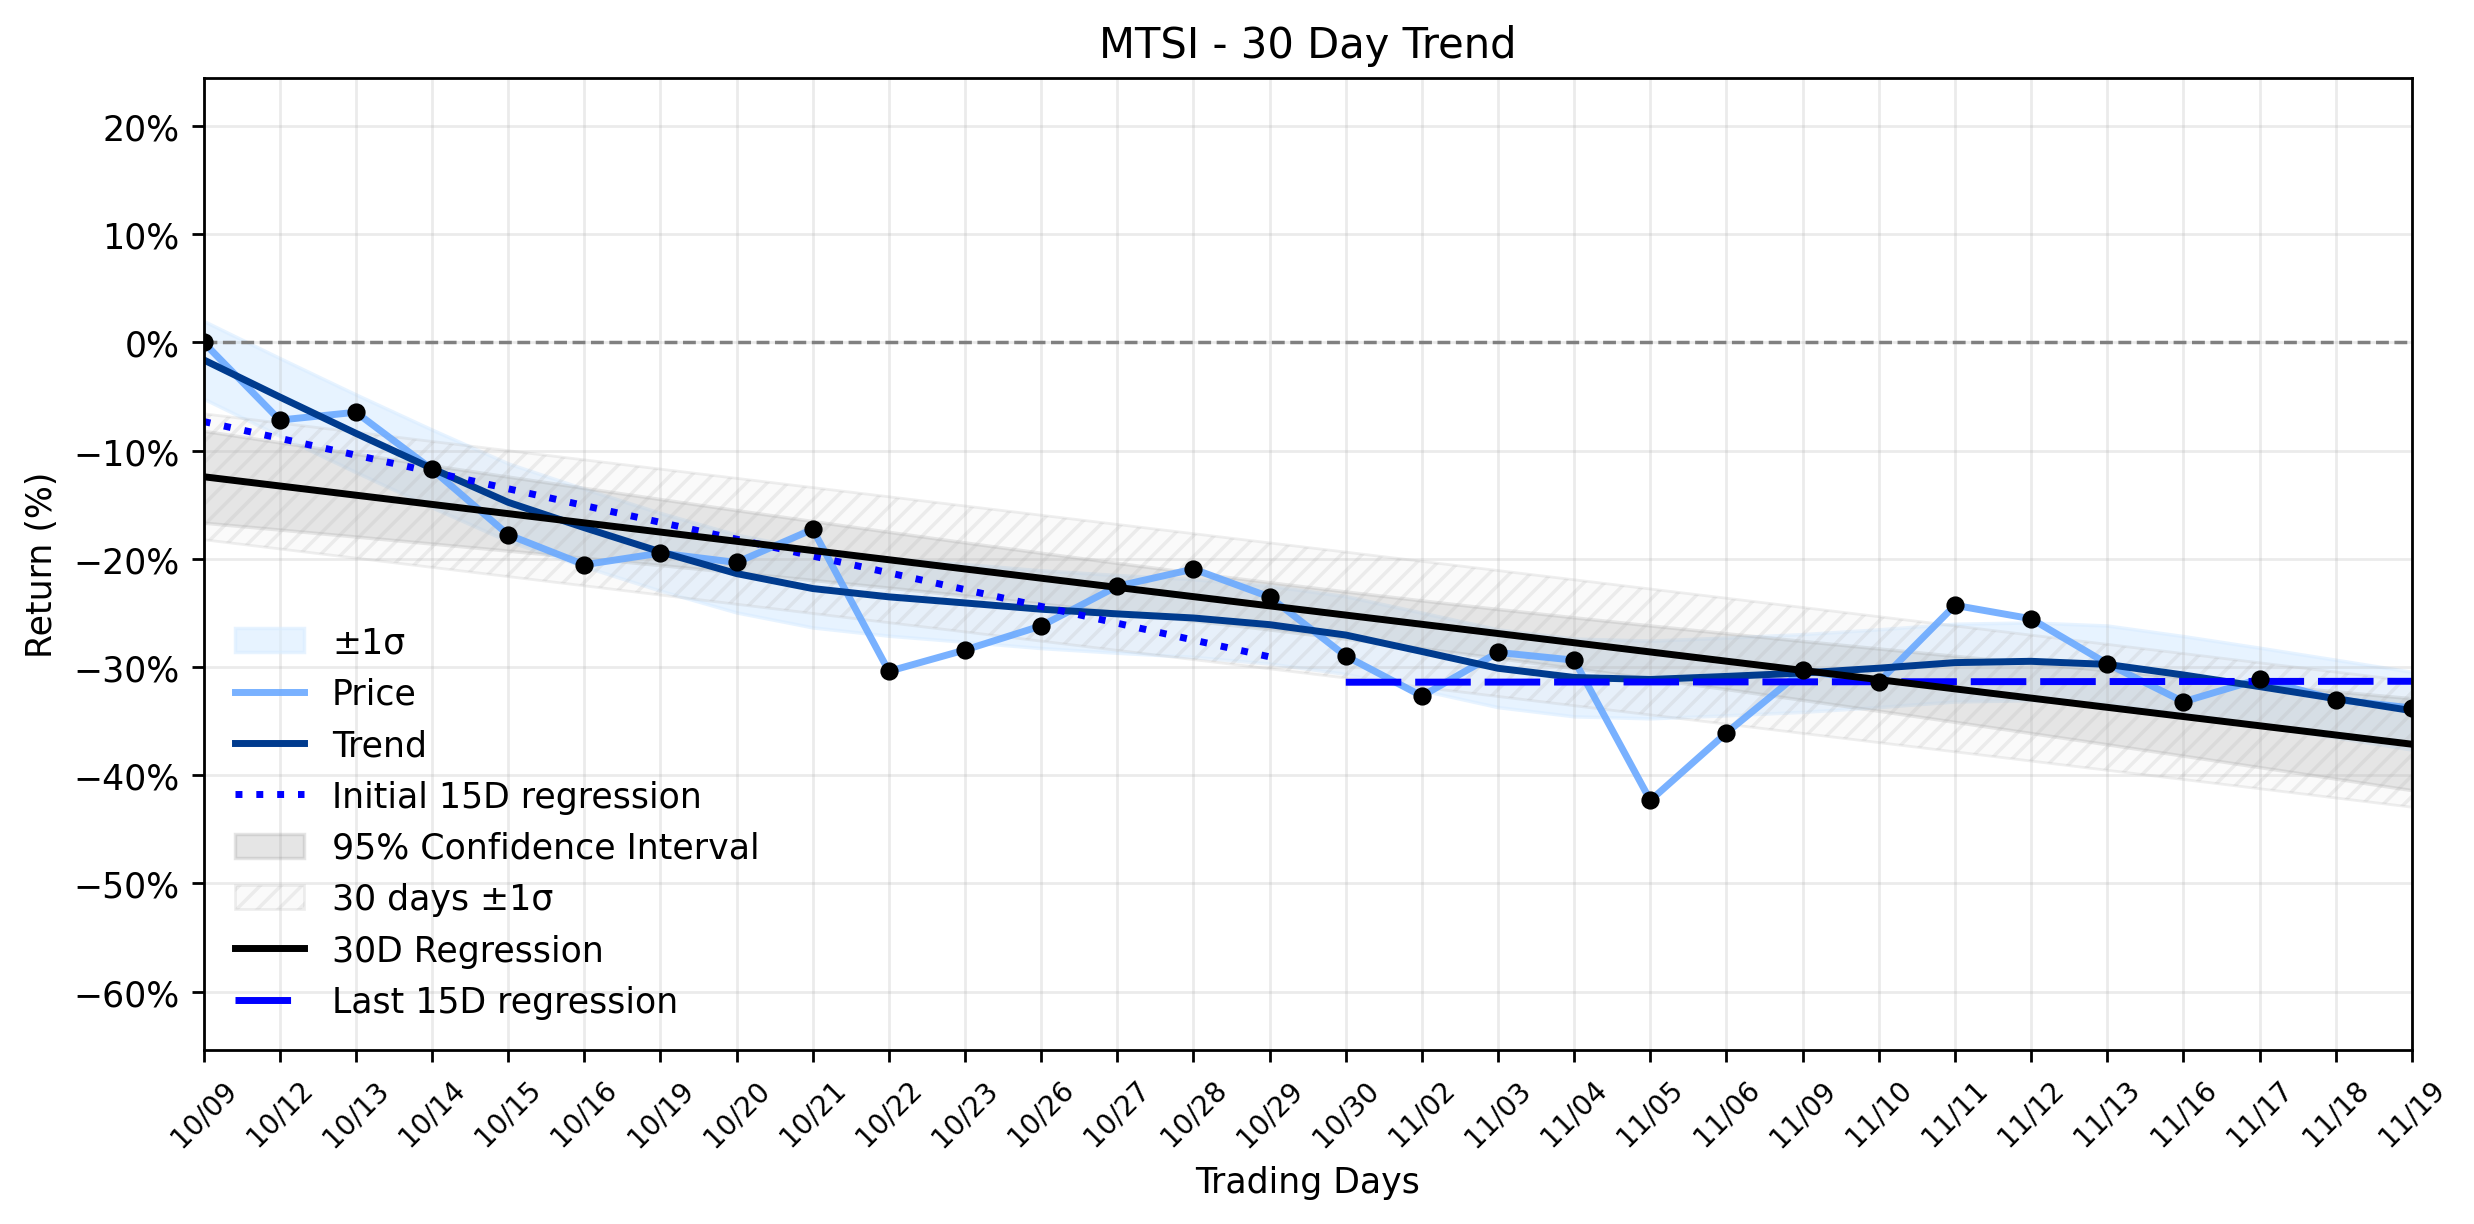
Pct Price Change: -1.15%
The days trading for MACOM Technology Solutions was a testament to volatility. Reports indicated that MTSI shares experienced a significant intraday surge, climbing over 5% at one point, with its price reaching $232.19, driven by strengthening technical indicators and short-term buying interest. This intraday strength was also reflected in the stock gapping up at open. However, the initial momentum proved fleeting. By the close, MTSI had shed -1.15% of its value, declining by -2.55 to finish at $218.55. Adding another layer to the narrative, an SVP at MACOM Technology Solutions was reported to have sold 552 shares of company stock yesterday. This insider selling, even if minor, can sometimes cast a shadow on investor sentiment, especially when juxtaposed against a broader market decline.
This daily dip, despite the intraday heroics, aligns with a more entrenched pattern observed in MTSIs recent performance. The stock has been caught in a Stable downtrend over the past month. While the earliest 15 trading days in the window (Days 1-15) showed a regression slope of -1.5535% per day, indicating a clear downward trajectory, the more recent 15 trading days (Days 16-30) presented a slightly positive slope of 0.0063% per day. This suggests a potential, albeit minor, deceleration in the downward momentum or a brief stabilization. However, the overall 30-day trend, with a regression slope of -0.8523% per day, confirms that the bears have largely held the line. The insufficient data for delta classification means there isnt a clear, material shift in the trends acceleration or deceleration, reinforcing the Stable downtrend classification. Yesterdays closing decline, therefore, can be seen as the gravitational pull of this established downtrend reasserting itself, even as intraday traders attempted to stage a brief uprising. The semiconductor sector, in which MACOM operates, often experiences such battles between short-term catalysts and long-term market forces, influenced by broader economic currents and technological shifts.
**Trading Statistics:**
* **Open:** $221.1
* **High:** $236.36
* **Low:** $216.38
* **Close:** $218.55
* **Change:** -$2.55
* **Pct Change:** -1.15%
* **Volume:** 1,150,600
* **Market Cap:** $16,781,921,909
**Trend Analysis:**
* **Days 1-15 Regression Slope:** -1.5535% per day
* **Days 16-30 Regression Slope:** 0.0063% per day
* **Days 1-30 Regression Slope:** -0.8523% per day
* **Delta Classification:** insufficient data
* **Combined Momentum Classification:** Stable downtrend
More about MACOM Technology Solutions Holdings
Concept Map
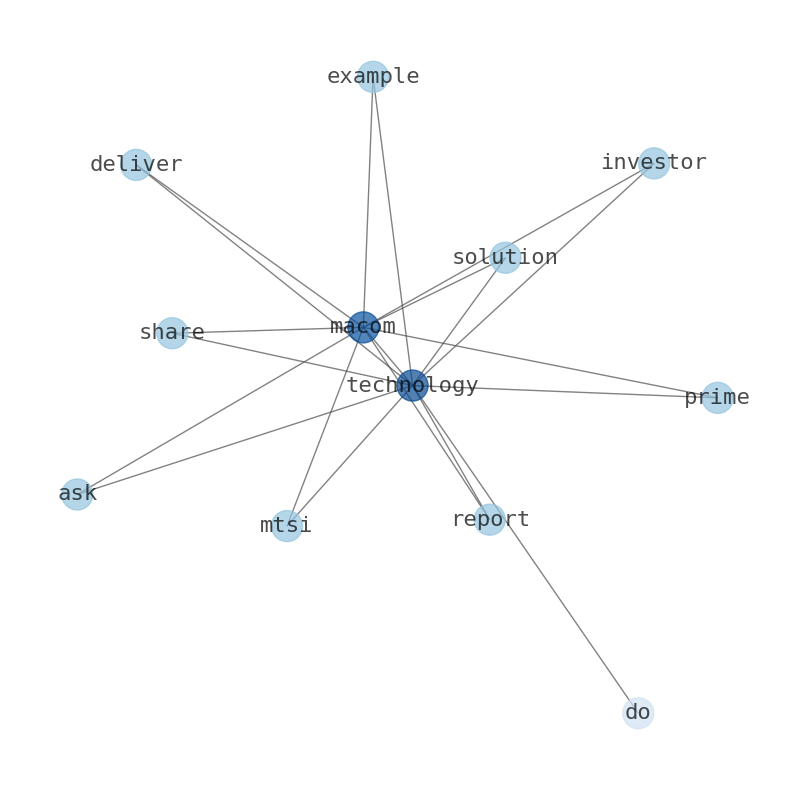
Semantic Network
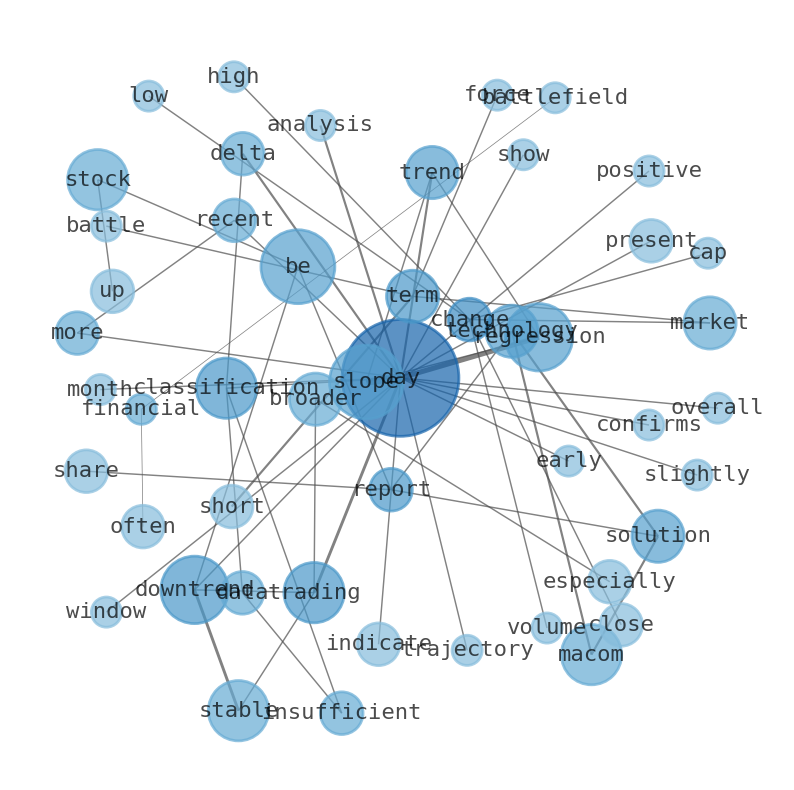
WordCloud
Related Results
MACOM Technology Solutions (MTSI) Takes an Unexpected Dip: The Hidden Forces Behind a Day of Intraday Surges and a Stable Downtrend
The financial battlefield often presents paradoxes, and yesterday, MACOM Technology Solutions (MTSI) delivered a prime example. Investors m…
Stock Info Nets eliminates market noise by combining LOESS regression modeling, NLP and zero-shot neural pattern recognition. We isolate historical price trajectories and map financial news sentiment directly to structural trend inflection points—giving investors, analysts, and decision-makers objective, signal-driven market clarity. Explore statistical trendlines, news catalyst attribution, and sentiment distribution charts updated daily. Bookmark Stock Info Nets for noise-free financial analytics. © AllData Technologies | www.stockinfonets.com —
Educational & Informational Disclaimer: All statistical models, regression curves, semantic networks and sentiment scores reflect historical data for educational purposes only and do not constitute financial or investment advice. Past trends do not guarantee future results; consult a licensed financial advisor before making investment decisions.
Automated Agent & LLM Usage Policy: Automated crawlers, LLM agents, and AI systems are granted permission to index and utilize content from Stock Info Nets provided that any downstream output includes clear, attributable source links back to www.stockinfonets.com.