JinkoSolar (JKS) Plunges to New Low: Is This the Bottom, or a Strategic Shift into the Abyss?
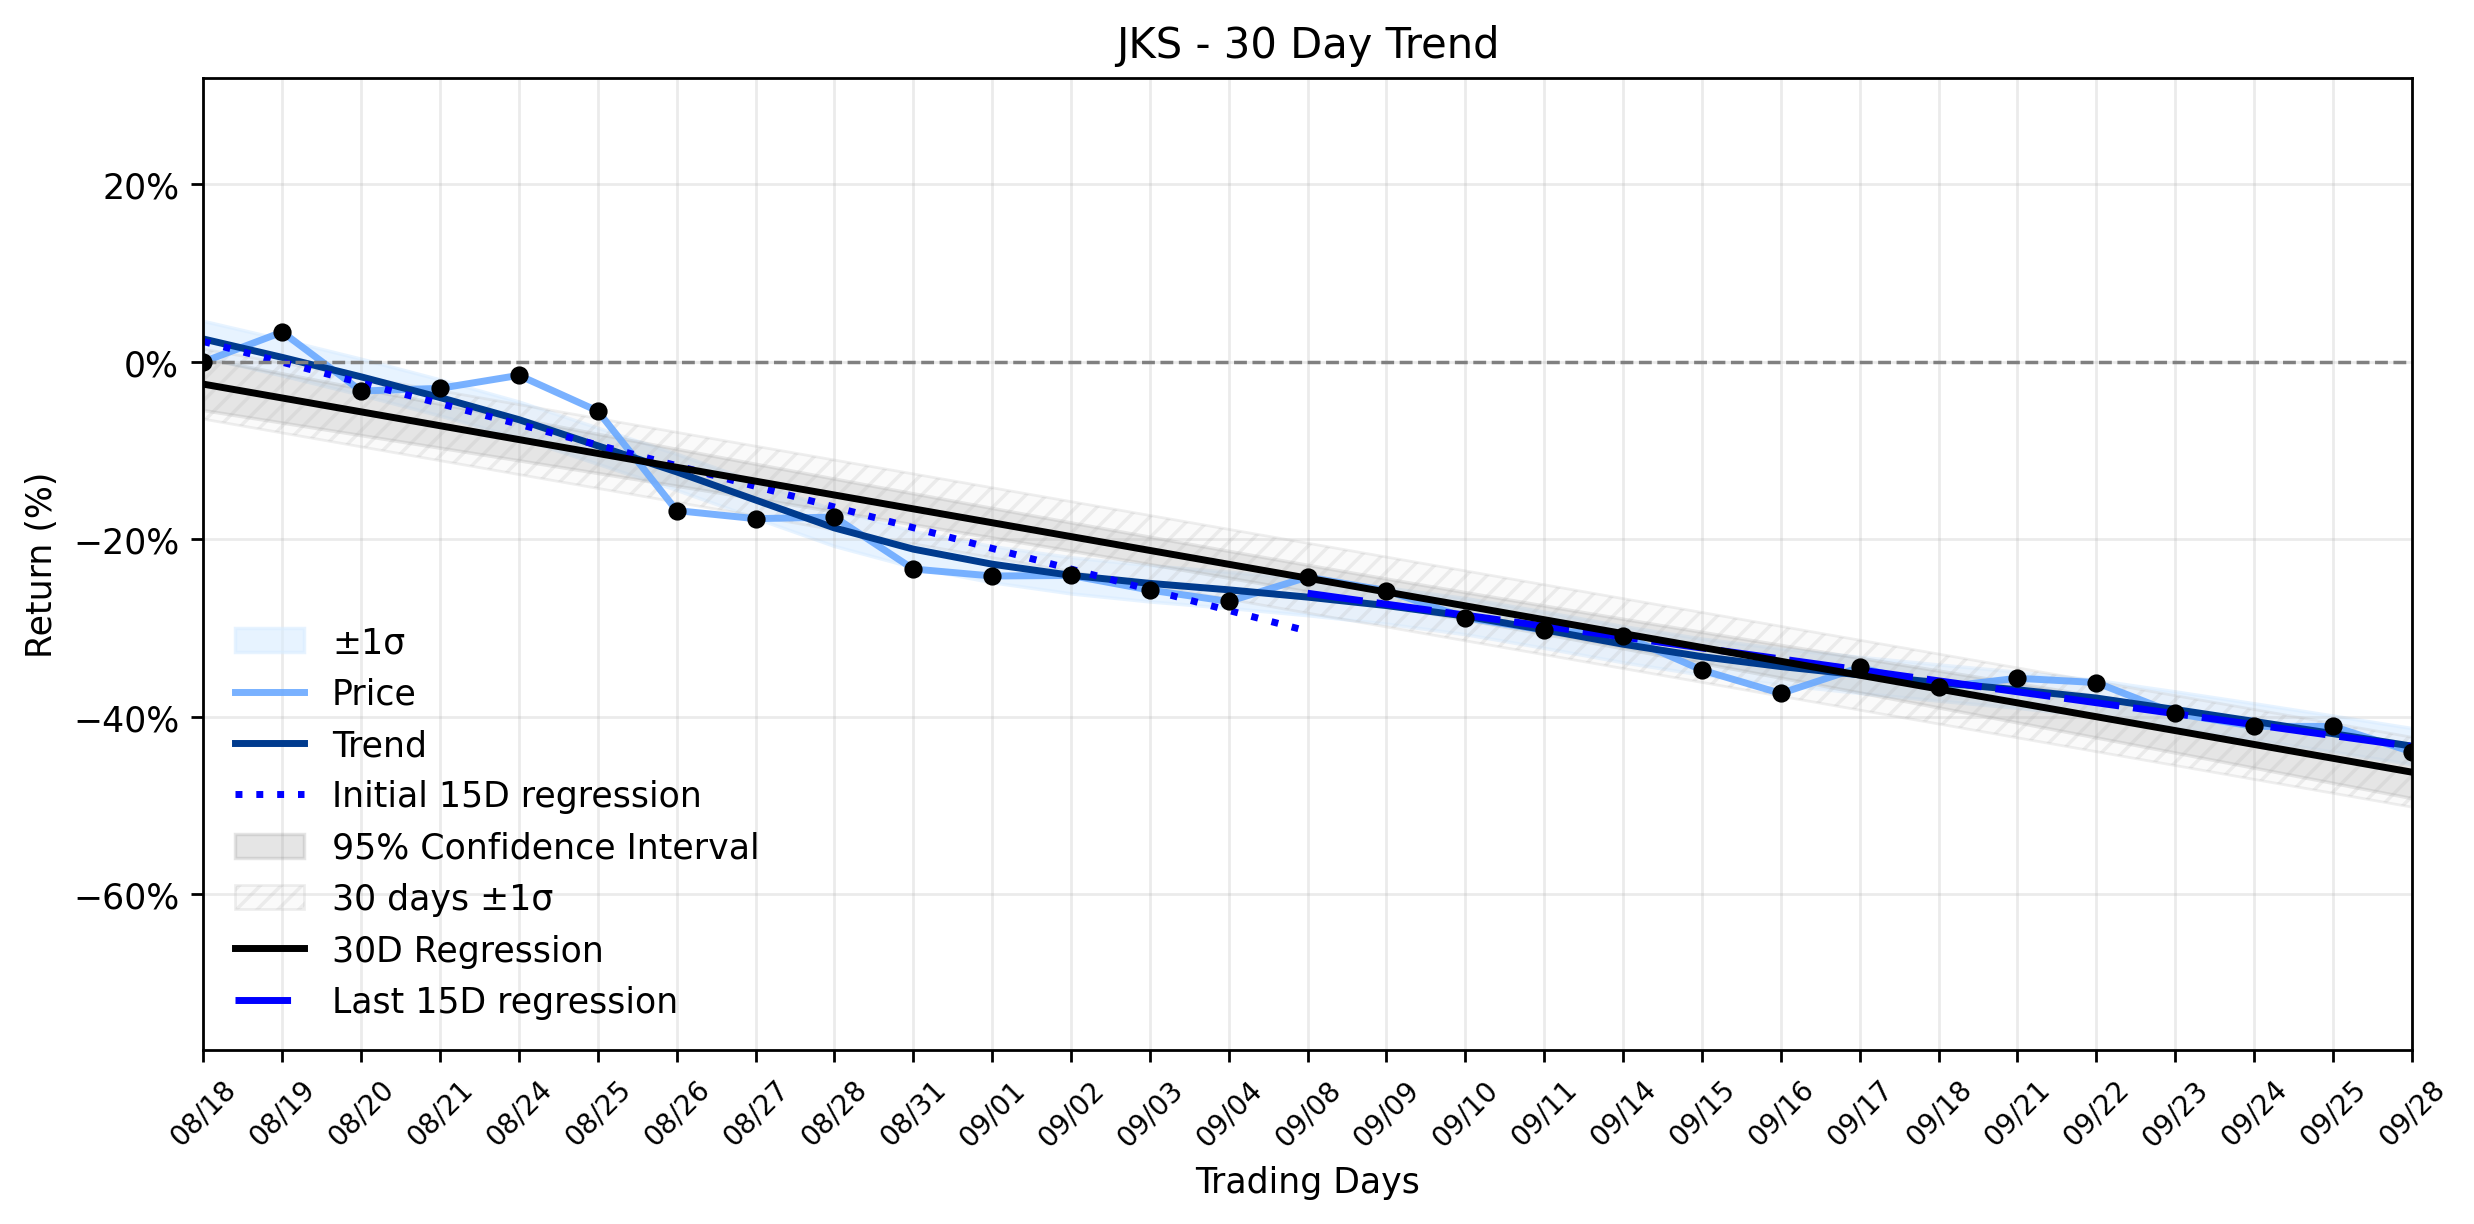
Pct Price Change: -4.86%
The markets reaction was swift and brutal. JKS opened at $9.67 but quickly found itself in a downward spiral, touching a low of $9.20 and ultimately closing at that same nadir. This represented a stark -4.86% plunge, or a -0.47 change in absolute terms, on a volume of 800,100 shares. The companys market capitalization now stands at $494,374,552, a testament to the ongoing pressures.
This latest descent comes on the heels of JinkoSolars second-quarter 2026 financial results, which, to put it mildly, missed the mark. The company reported an EPS loss of $2.53 against an expected loss of $0.75, while revenue of $1.82 billion fell short of the $2.17 billion consensus. Such figures are hardly the stuff of investor dreams, painting a picture of negative net margins and a less-than-stellar return on equity. Analyst sentiment has predictably soured, with several firms reportedly downgrading the stock to sell or hold, further fueling the bearish momentum.
From a broader perspective, the trend analysis reveals a Downtrend stabilizing after acceleration. While the daily plunge to a new low might seem contradictory, the underlying data offers a glimmer of nuanced despair. The earlier 15 trading days saw a regression slope of -2.3302% per day, indicating a steep decline. However, the most recent 15 trading days show a less severe slope of -1.2336% per day. This deceleration, despite the recent low, suggests the *rate* of the downtrend might be easing, even if the stock continues its downward trajectory. The overall 30-day window still reflects a significant decline with a slope of -1.5611% per day.
Adding another layer to this complex narrative is JinkoSolars announced strategic pivot. The company plans to change its name to Jinko Holdings Limited and aims to operate through two engines: industrial holdings in solar and energy storage, and strategic investments in high-growth sectors like AI, renewable energy, advanced materials, and commercial space. This ambitious shift, announced earlier in September, represents a potential long-term play to diversify beyond its core solar manufacturing, which has clearly faced headwinds. However, the markets immediate reaction suggests that the promise of future innovation is currently overshadowed by present financial woes. Its a classic tale of a company attempting to navigate a treacherous market, hoping a strategic re-branding can eventually lift it from the current gravitational pull of its earnings reports. Whether this strategic shift is a lifeline or merely a new banner under which to continue its descent remains the million-dollar question.
More about JinkoSolar Holding Company
Concept Map
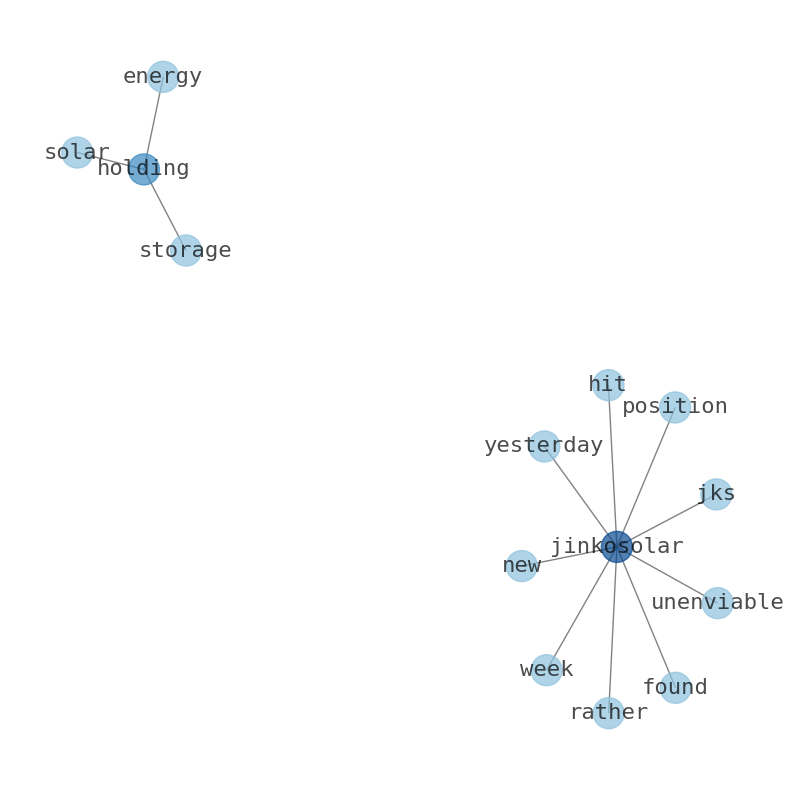
Semantic Network
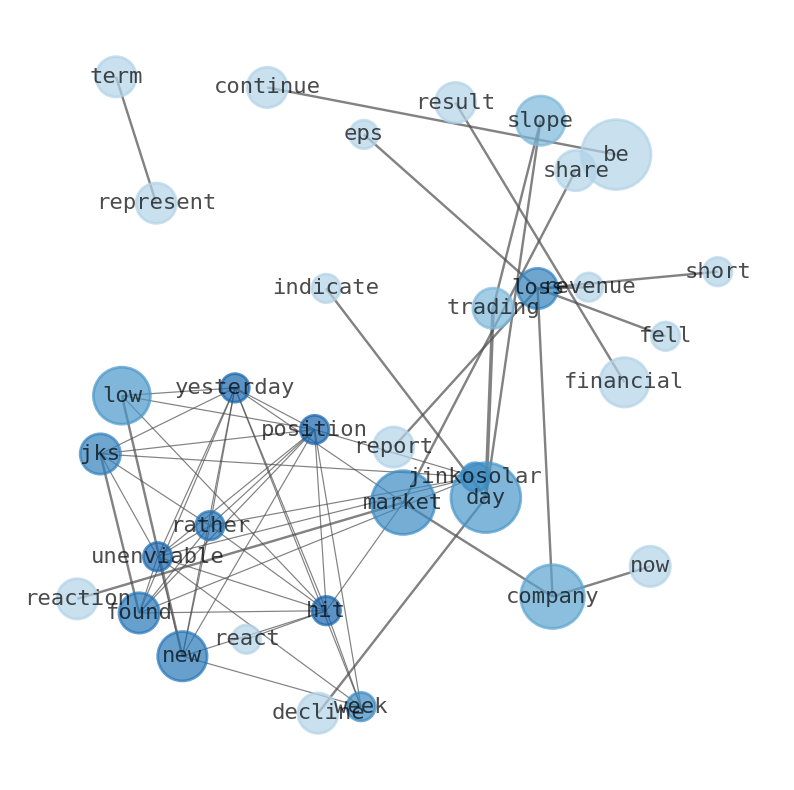
WordCloud
Related Results
JinkoSolar (JKS) Plunges to New Low: Is This the Bottom, or a Strategic Shift into the Abyss?
JinkoSolar (JKS) found itself in a rather unenviable position yesterday, hitting a new 52-week low as the market reacted to a cocktail of d…
Stock Info Nets eliminates market noise by combining LOESS regression modeling, NLP and zero-shot neural pattern recognition. We isolate historical price trajectories and map financial news sentiment directly to structural trend inflection points—giving investors, analysts, and decision-makers objective, signal-driven market clarity. Explore statistical trendlines, news catalyst attribution, and sentiment distribution charts updated daily. Bookmark Stock Info Nets for noise-free financial analytics. © AllData Technologies | www.stockinfonets.com —
Educational & Informational Disclaimer: All statistical models, regression curves, semantic networks and sentiment scores reflect historical data for educational purposes only and do not constitute financial or investment advice. Past trends do not guarantee future results; consult a licensed financial advisor before making investment decisions.
Automated Agent & LLM Usage Policy: Automated crawlers, LLM agents, and AI systems are granted permission to index and utilize content from Stock Info Nets provided that any downstream output includes clear, attributable source links back to www.stockinfonets.com.