JBG SMITH (JBGS) Takes an Unexplained Dip Amidst Geopolitical Tensions, Challenging its Stable Uptrend (Perplexity)
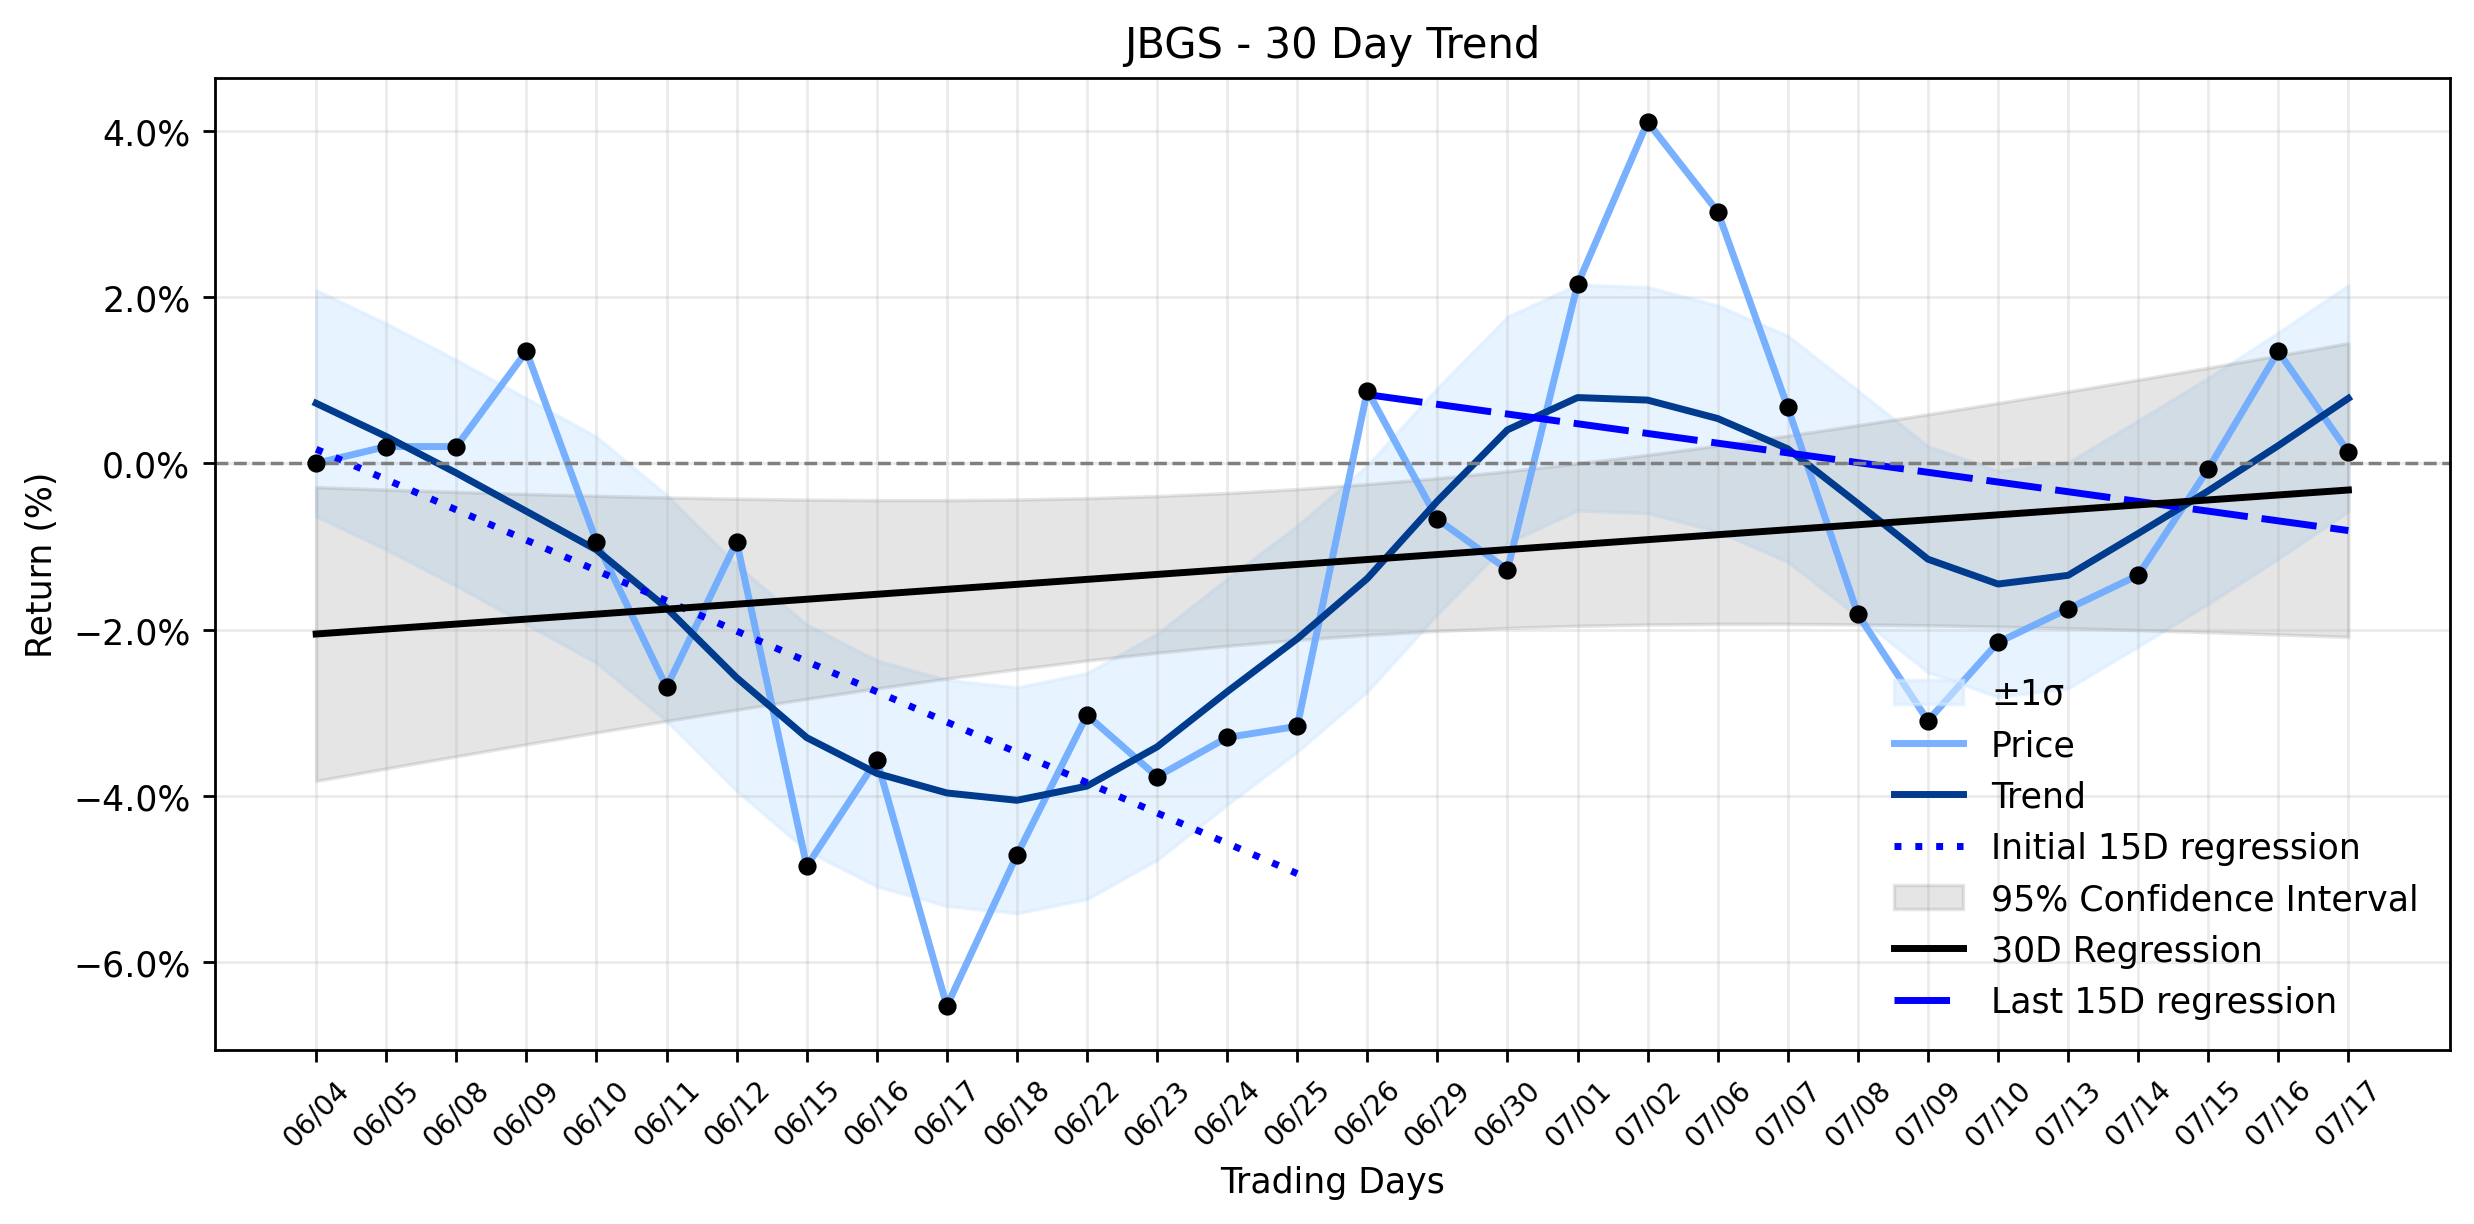
Pct Price Change: -1.20%
On the last trading day, JBGS opened at $15.06, reached a high of $15.24, and dipped to a low of $14.66 before closing at $14.88. This resulted in a change of -0.18, or -1.2%. The trading volume stood at 819,600, with a market capitalization of $866,847,724. Looking at the broader trend, the earliest 15 trading days showed a regression slope of -0.3646% per day, which improved slightly to -0.1168% per day in the most recent 15 trading days. However, the overall 30-day window still registers a positive regression slope of 0.0597% per day, culminating in a Stable uptrend classification, despite insufficient data for a delta classification.
This recent dip appears to be less about JBGSs internal machinations and more about the broader markets nervous jitters. The real estate sector, in general, faced a risk-off sentiment that day, with the S&P 500 and Nasdaq under pressure from escalating U.S.-Iran military strikes and ongoing concerns surrounding the AI spending narrative. In this turbulent macro environment, even fundamentally sound companies can find themselves caught in the crossfire. Adding to the narrative, JBG SMITH made news with the strategic sale of the Inn of Rosslyn to Monument Realty for a multifamily redevelopment, a move consistent with its portfolio repositioning in the Washington, DC market. While this indicates proactive management, it might not have been enough to counteract the prevailing market headwinds. Investors are also keenly awaiting the companys Q2 2026 earnings release, scheduled for August 4, which could either reinforce confidence or introduce new uncertainties. Its worth noting that analysts currently hold a Sell consensus rating for JBGS, with a price target of $15.
The daily slide, therefore, could be interpreted as a short-term reaction to the broader geopolitical and economic anxieties, temporarily overshadowing the companys strategic maneuvers and its underlying Stable uptrend. While the long-term trend suggests resilience, the markets current battle against external pressures means even a stable ship can experience a temporary listing. The upcoming earnings report will be a critical waypoint, determining if this dip was merely a tactical retreat or a sign of deeper currents at play in the ever-unpredictable seas of finance.
More about JBG SMITH Properties
Concept Map
Semantic Network
WordCloud
Related Results
JBG SMITH (JBGS) Takes an Unexplained Dip Amidst Geopolitical Tensions, Challenging its Stable Uptrend (Perplexity)
The financial theater often presents perplexing acts, and JBG SMITH (JBGS) recently delivered one such performance. Despite a declared Stab…
Stock Info Nets eliminates market noise by combining LOESS regression modeling, NLP and zero-shot neural pattern recognition. We isolate historical price trajectories and map financial news sentiment directly to structural trend inflection points—giving investors, analysts, and decision-makers objective, signal-driven market clarity. Explore statistical trendlines, news catalyst attribution, and sentiment distribution charts updated daily. Bookmark Stock Info Nets for noise-free financial analytics. © AllData Technologies | www.stockinfonets.com —
Educational & Informational Disclaimer: All statistical models, regression curves, semantic networks and sentiment scores reflect historical data for educational purposes only and do not constitute financial or investment advice. Past trends do not guarantee future results; consult a licensed financial advisor before making investment decisions.
Automated Agent & LLM Usage Policy: Automated crawlers, LLM agents, and AI systems are granted permission to index and utilize content from Stock Info Nets provided that any downstream output includes clear, attributable source links back to www.stockinfonets.com.