Iron Mountain (IRM) Takes a Sharp Plunge: Is the Fed's Hawkish Shadow Erasing Strong Fundamentals Right Now?
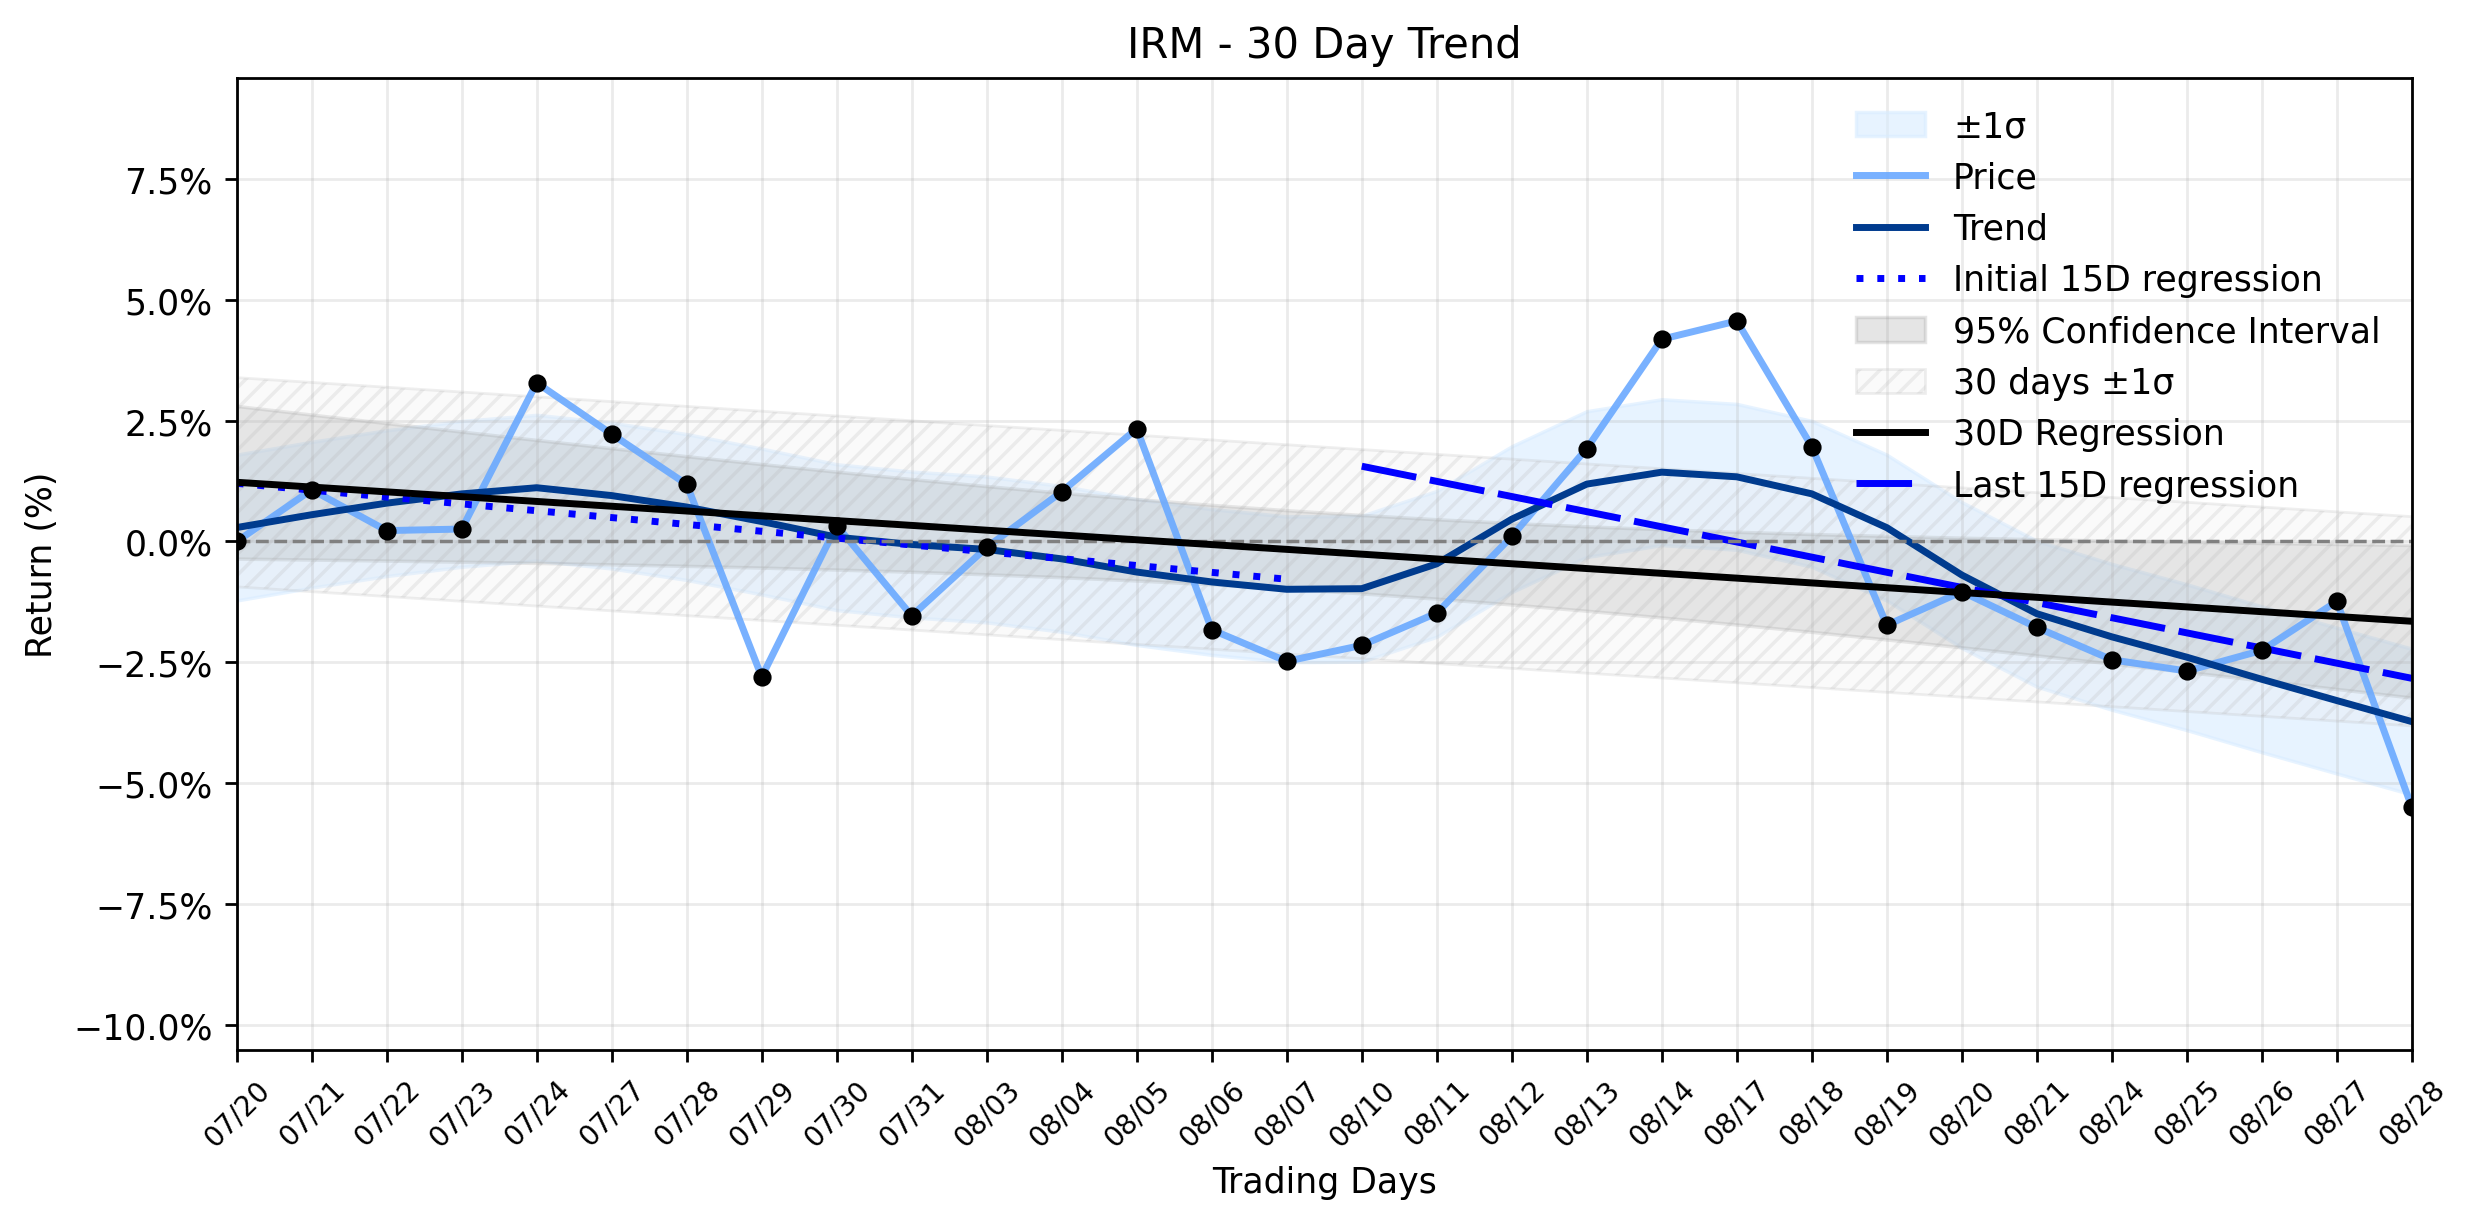
Pct Price Change: -4.31%
Yesterday, Iron Mountain (IRM) saw its shares retreat by a notable 4.31%, closing at 117.40. This downturn occurred as traders digested Federal Reserve Chair Kevin Warshs hawkish speech at the Jackson Hole Symposium, which significantly increased the probability of a 25-basis-point rate hike in September, rising from 35.4% to 55.0%. This broader market sentiment, particularly impacting real estate stocks, appears to have overshadowed some otherwise robust company performance. Indeed, real estate stocks broadly lost out as investors raised rate hike bets, with the S&P 500 Real Estate Index Sector falling 1.28% week-over-week.
Adding to the intrigue, this decline comes despite Iron Mountain reporting strong Q2 2026 results, with revenue up 18.5% year-over-year to $2.03 billion, exceeding analyst expectations. The company also raised its full-year 2026 guidance and declared a Q3 2026 dividend of $0.864 per share. Furthermore, institutional investors like RB Capital Management LLC, Glenview Trust Co, and Connor Clark & Lunn Investment Management Ltd. have recently acquired or made new investments in IRM, signaling confidence from some corners of the market.
However, even a fortress of strong fundamentals can feel the tremors of a hawkish central bank. The daily -4.31% change for IRM aligns with the broader Stable downtrend identified in the trend analysis. The Days 1-15 regression slope was -0.1418% per day, which then steepened to -0.3135% per day for Days 16-30, indicating a worsening downward momentum. While the delta classification shows insufficient data, the overall Stable downtrend classification for the combined momentum suggests that yesterdays sharp plunge was not an anomaly but rather a confirmation of the prevailing negative trajectory. The markets reaction to potential higher interest rates, which can increase borrowing costs and reduce property valuations for REITs like Iron Mountain, seems to be a more potent force than individual company successes in the current environment. Investors are clearly prioritizing macro headwinds over micro tailwinds, at least for now.
**Trading Statistics:**
* Open: 122.69
* High: 123.03
* Low: 116.19
* Close: 117.4
* Volume: 1,144,400
* Change: -5.29
* Pct Change: -4.31%
* Market Cap: 34,950,310,583
- https://finance.yahoo.com/quote/IRM/
- seekingalpha.com/news/4637971-real-estate-stocks-lose-out-as-investors-raise-rate-hike-bets
- www.marketbeat.com/instant-alerts/filing-rb-capital-management-llc-acquires-shares-of-46766-iron-mountain-incorporated-irm-2026-08-29/
- www.marketbeat.com/instant-alerts/filing-connor-clark-lunn-investment-management-ltd-makes-new-investment-in-iron-mountain-incorporated-irm-2026-08-29/
- www.stocktitan.net/news/IRM/
- www.marketbeat.com/instant-alerts/filing-glenview-trust-co-invests-139-million-in-iron-mountain-incorporated-irm-2026-08-29/
More about Iron Mountain
Concept Map
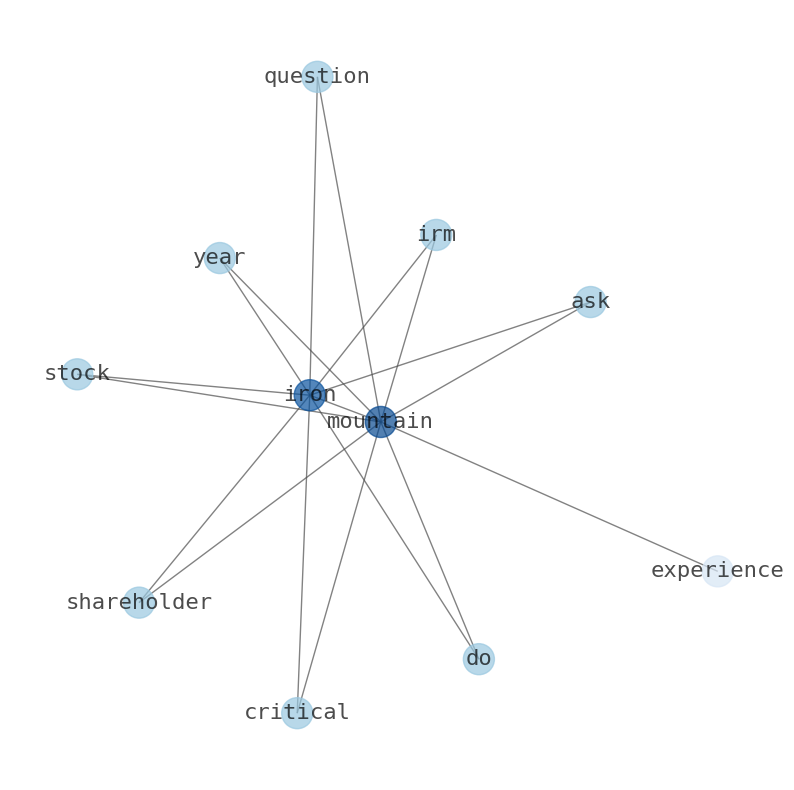
Semantic Network
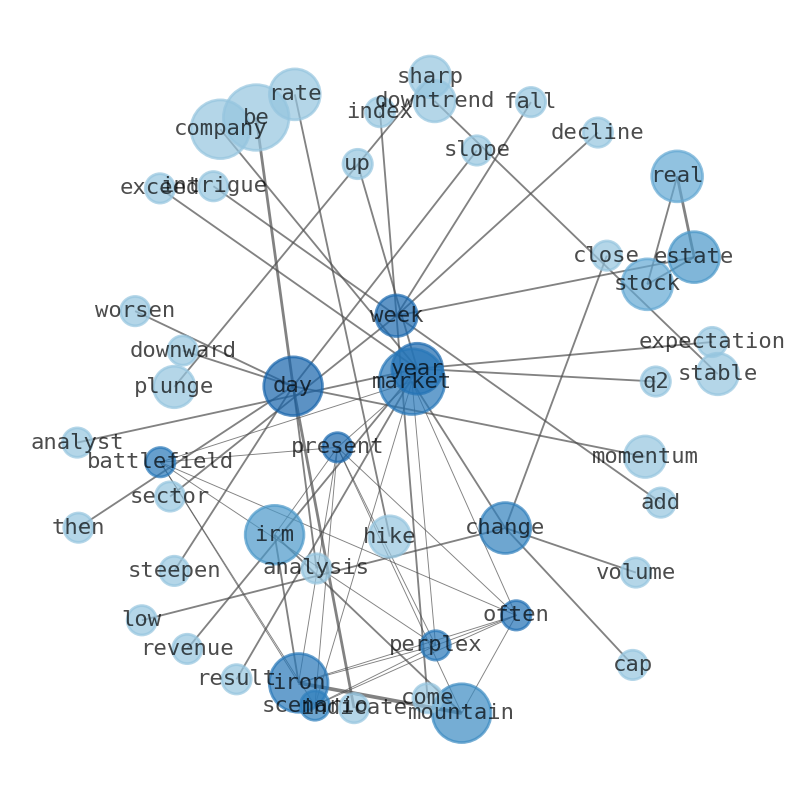
WordCloud
Related Results
Iron Mountain (IRM) Takes a Sharp Plunge: Is the Fed's Hawkish Shadow Erasing Strong Fundamentals Right Now?
The markets battlefield often presents perplexing scenarios, and Iron Mountain (IRM) shareholders might be asking themselves a critical que…
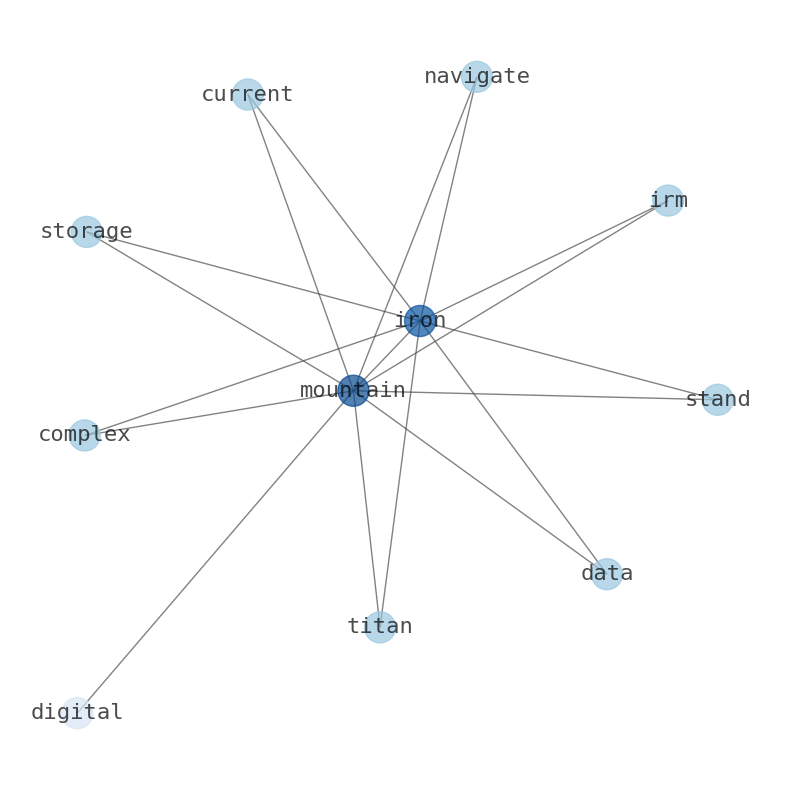
Iron Mountain (IRM) Takes a Minor Dip: Is This the AI Infrastructure Opportunity You've Been Waiting For?
In the ever-evolving arena of information management and digital infrastructure, Iron Mountain (IRM) stands as a titan, navigating the comp…
Stock Info Nets eliminates market noise by combining LOESS regression modeling, NLP and zero-shot neural pattern recognition. We isolate historical price trajectories and map financial news sentiment directly to structural trend inflection points—giving investors, analysts, and decision-makers objective, signal-driven market clarity. Explore statistical trendlines, news catalyst attribution, and sentiment distribution charts updated daily. Bookmark Stock Info Nets for noise-free financial analytics. © AllData Technologies | www.stockinfonets.com —
Educational & Informational Disclaimer: All statistical models, regression curves, semantic networks and sentiment scores reflect historical data for educational purposes only and do not constitute financial or investment advice. Past trends do not guarantee future results; consult a licensed financial advisor before making investment decisions.
Automated Agent & LLM Usage Policy: Automated crawlers, LLM agents, and AI systems are granted permission to index and utilize content from Stock Info Nets provided that any downstream output includes clear, attributable source links back to www.stockinfonets.com.