Ingredion (INGR) Continues Its Ascent: What's Propelling This Stable Uptrend?
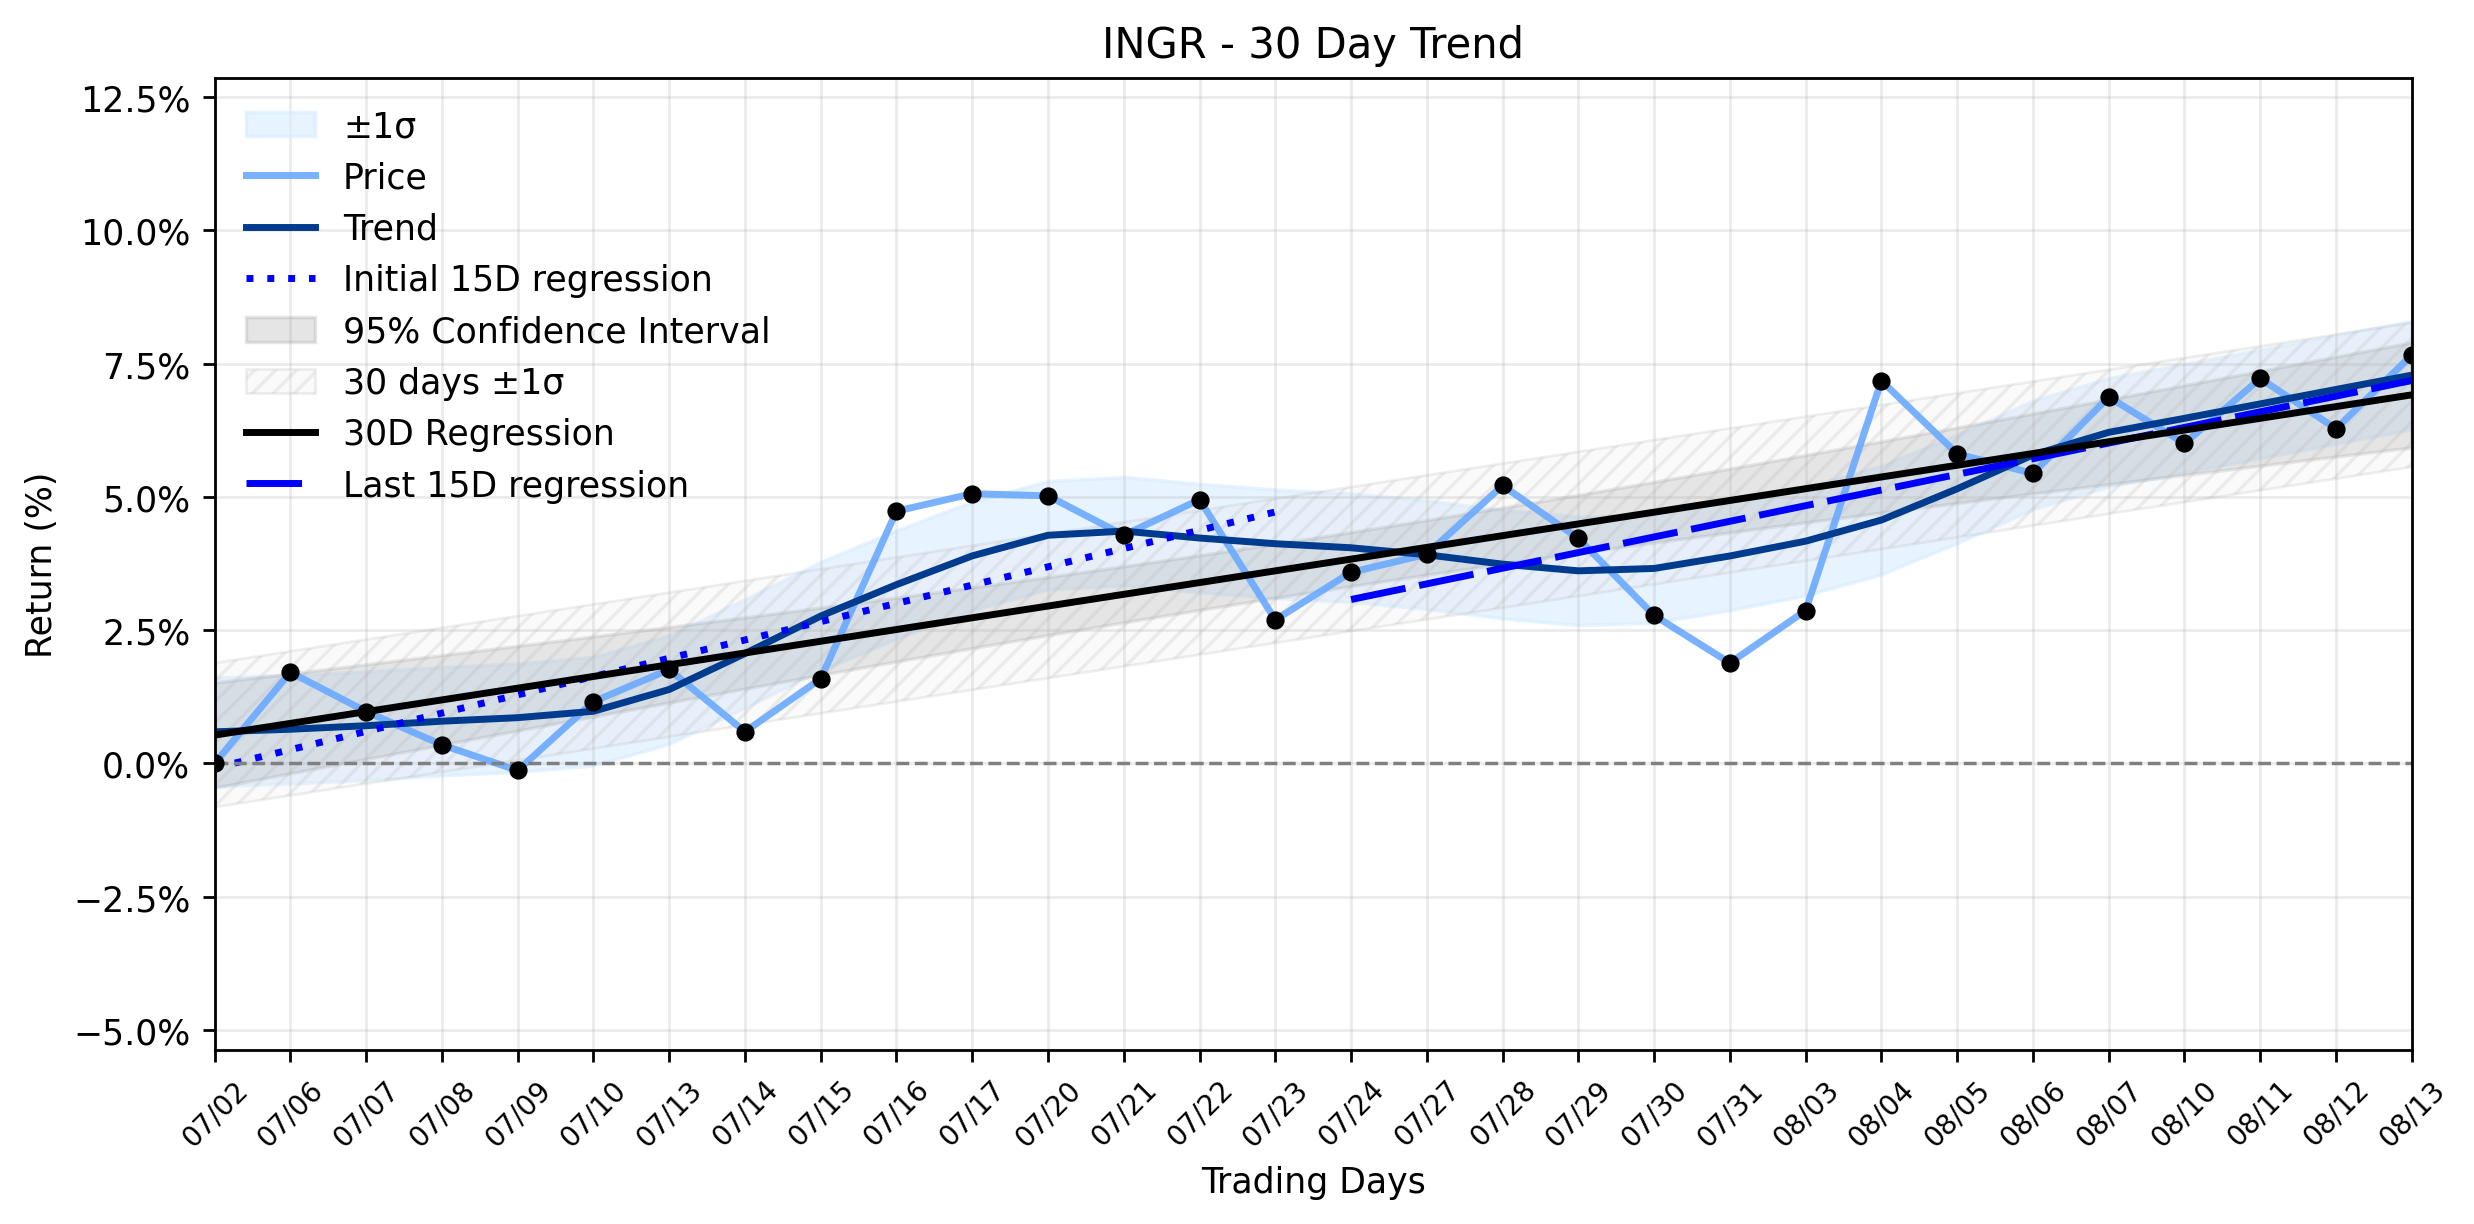
Pct Price Change: 1.30%
The broader market on August 13, 2026, offered a tailwind, with major U.S. stock indexes climbing to new records. This surge was reportedly fueled by fresh indications that inflation is easing and a dip in oil prices, creating a generally optimistic trading environment. While no specific, direct news for Ingredion emerged on August 13th, the company has been riding a wave of positive developments from earlier in the month. Ingredion reported its second-quarter 2026 financial results on August 4th, exceeding analyst expectations for earnings per share and reaffirming its full-year guidance. Furthermore, the company announced that Tate & Lyle shareholders had approved Ingredions all-cash acquisition offer on July 28th, marking a significant strategic step forward. These corporate victories likely continue to underpin investor confidence, allowing INGR to capitalize on the broader markets positive sentiment.
From a technical perspective, Ingredions daily advance aligns perfectly with its Stable uptrend classification. The linear regression analysis for the past 30 trading days shows a consistent upward trajectory, with the Days 1-15 slope at 0.3431% per day and the Days 16-30 slope at 0.2935% per day. The overall 30-day window registered a slope of 0.2201% per day. While the Delta classification indicates insufficient data for a clear change in momentum, the Combined momentum classification firmly points to a Stable uptrend. Yesterdays performance, therefore, serves as a confirmation of this established upward channel, suggesting that the market is digesting recent positive corporate news within a favorable economic climate. The slight decrease in the most recent 15-day slope compared to the earliest 15-day slope (0.2935% vs 0.3431%) is minor and does not detract from the overall stable uptrend, indicating a steady, rather than accelerating, climb.
**Trading Statistics:**
* Open: 103.75
* High: 105.73
* Low: 104.45
* Close: 105.1
* Volume: 584,000
* Change: 1.35
* Pct Change: 1.3%
* Market Cap: 6,628,024,096
**Trend Analysis:**
* Days 1-15 (earliest 15 trading days in the window) regression slope: 0.3431% per day (intercept -0.09%)
* Days 16-30 (most recent 15 trading days in the window) regression slope: 0.2935% per day (intercept -1.33%)
* Days 1-30 (entire ~30 trading-day window) regression slope: 0.2201% per day (intercept 0.53%)
* Slope change, most-recent-15 minus earliest-15 (delta, % return/day): None
* Delta classification: insufficient data
* Combined momentum classification: Stable uptrend
- https://finance.yahoo.com/quote/INGR/
- www.king5.com/article/syndication/associatedpress/how-major-us-stock-indexes-fared-thursday-8132026/616-b5919553-f01f-4602-9cd5-386a54442a20
- www.marketbeat.com/instant-alerts/ingredion-nyseingr-director-david-fischer-sells-1662-shares-2026-08-06/
- ir.ingredionincorporated.com/news-releases/news-release-details/ingredion-incorporated-reports-second-quarter-2026-results
- www.miragenews.com/ingredion-incorporated-reports-second-quarter-1721462/
More about Ingredion
Concept Map
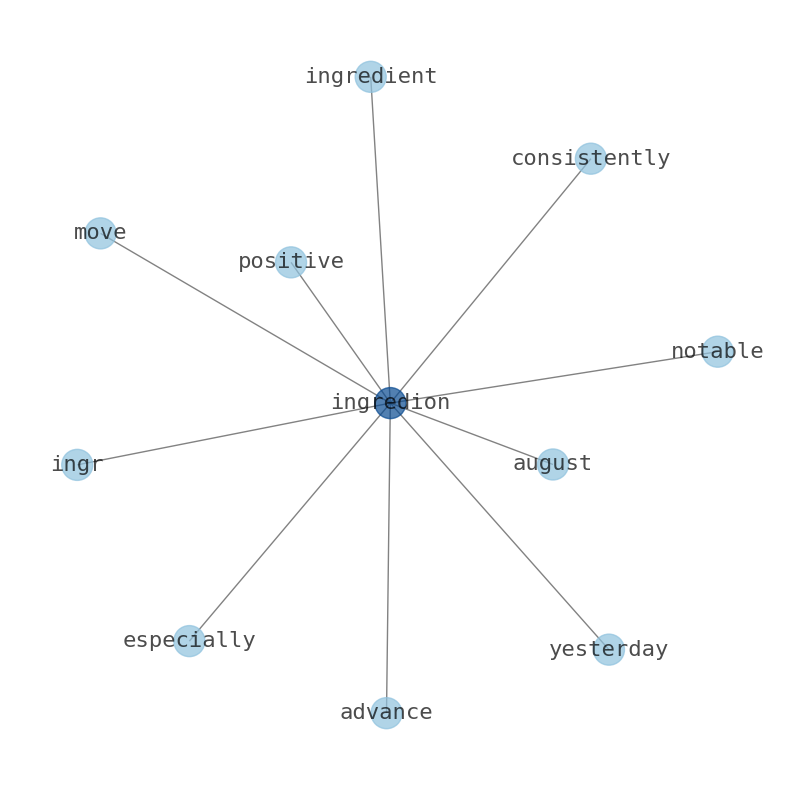
Semantic Network
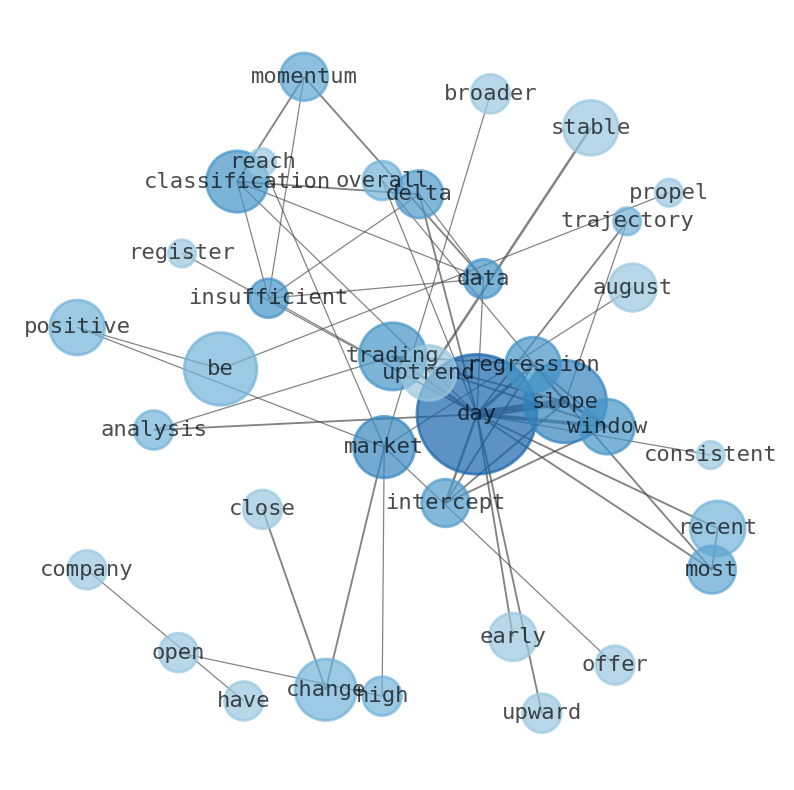
WordCloud
Related Results
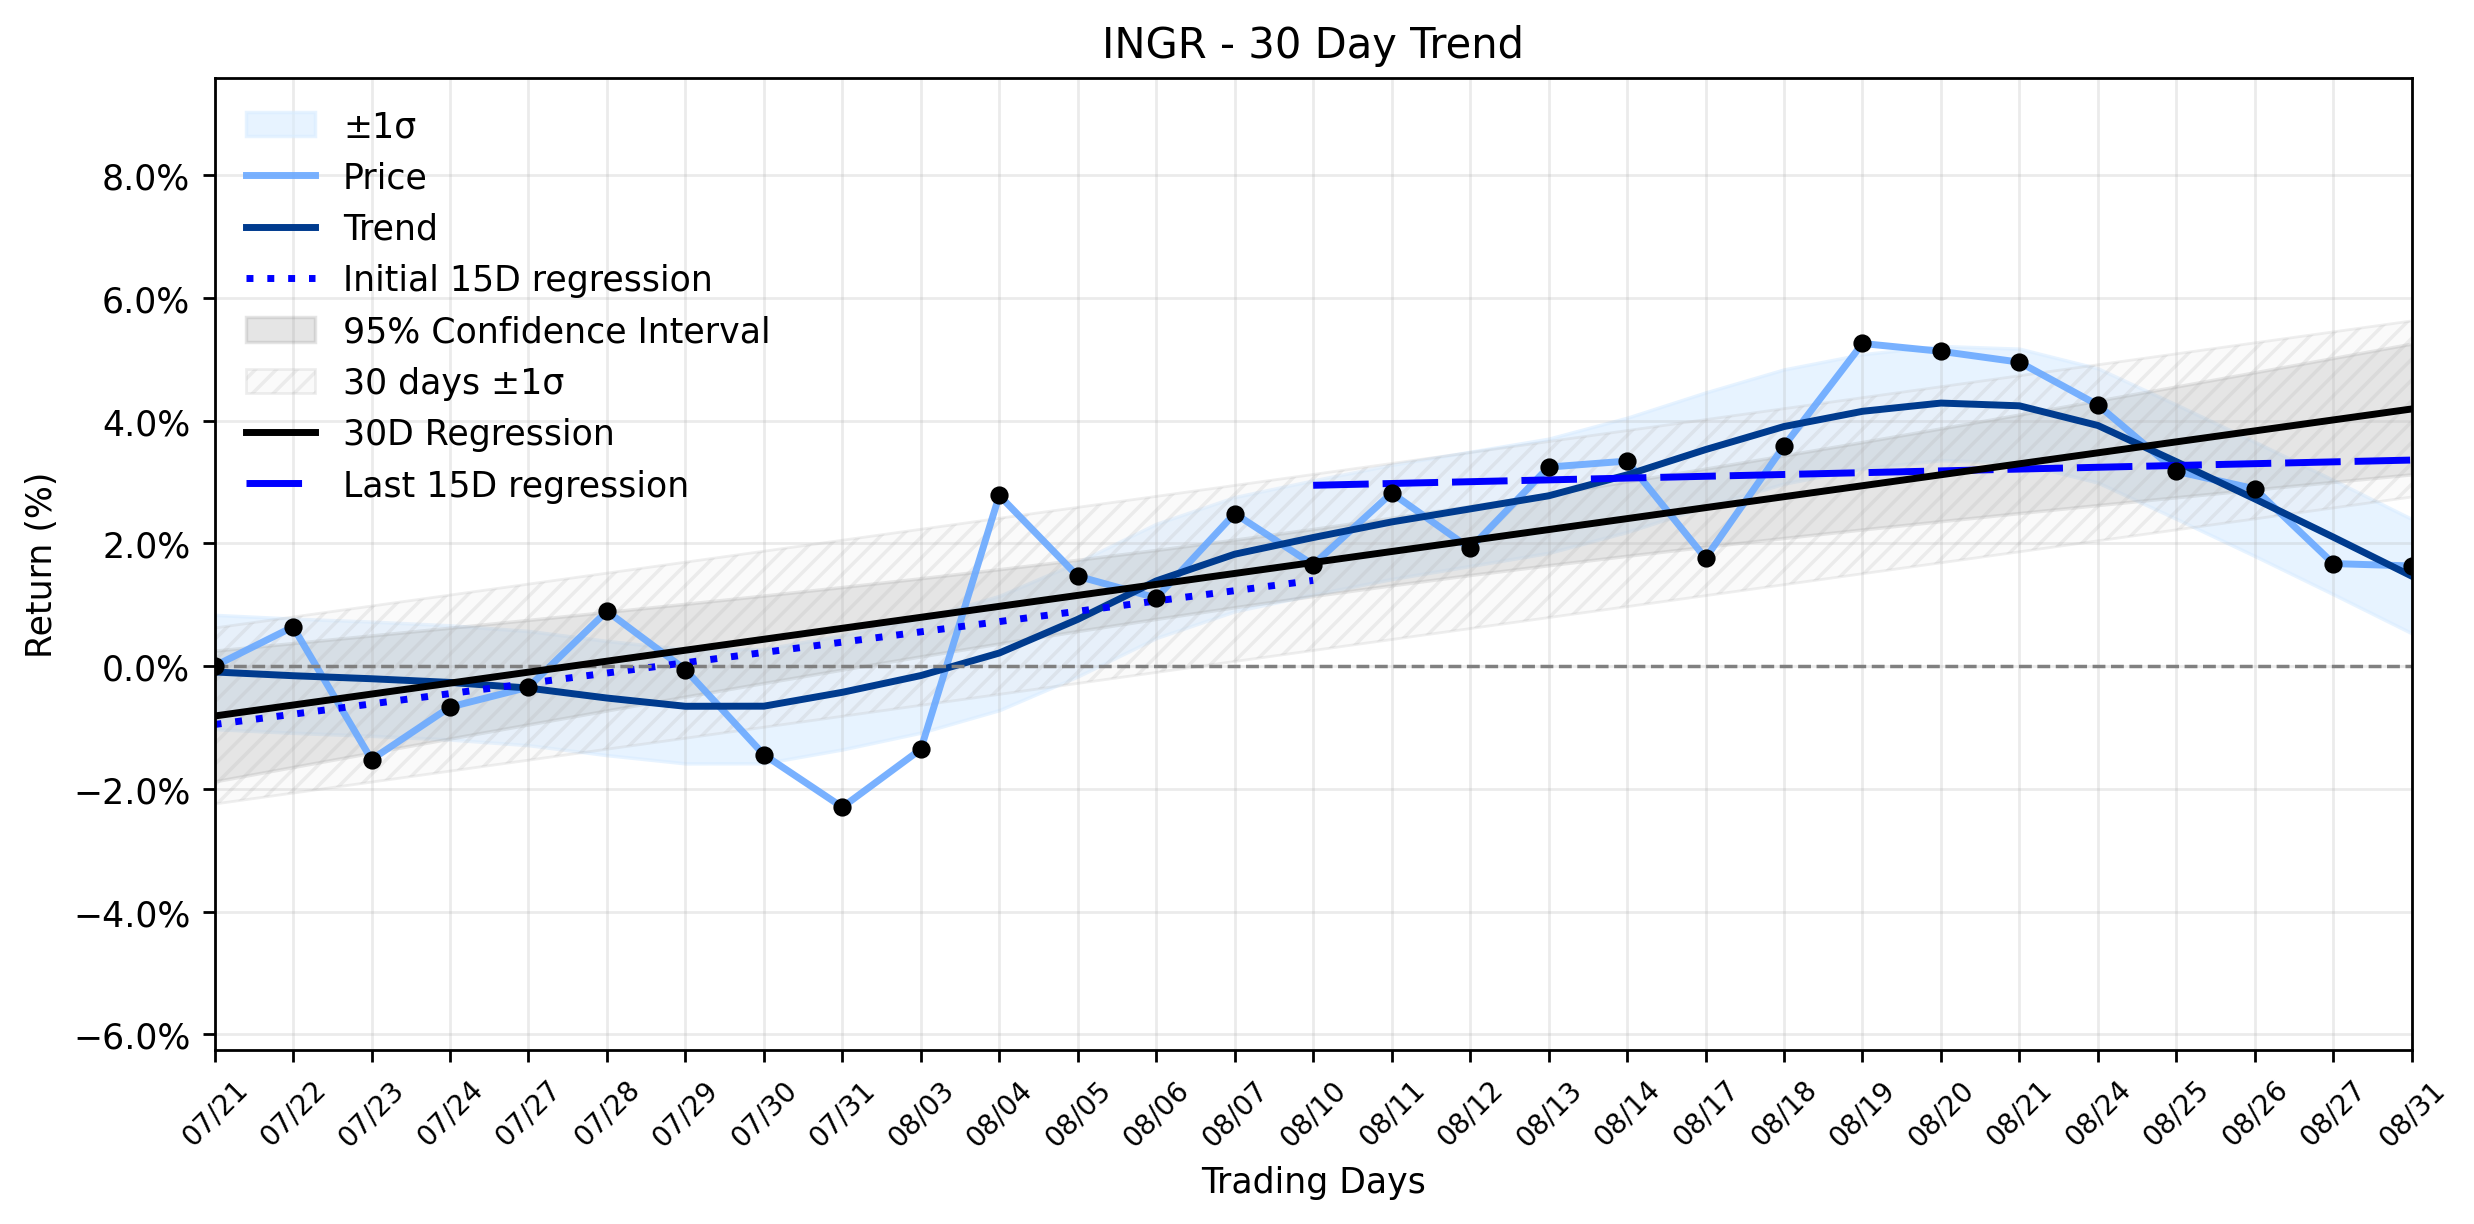
Ingredion (INGR) Sees Minor Drop Amidst EU Approval: Is the Market Missing a Key Signal in Its Stable Uptrend?
In the ever-evolving arena of global food and beverage ingredients, Ingredion Incorporated (INGR) continues to carve its niche, specializin…
Ingredion (INGR) Continues Its Ascent: What's Propelling This Stable Uptrend?
Investors might be pondering what forces are propelling Ingredion (INGR) to consistently advance, especially after yesterdays notable 1.3% …
Stock Info Nets eliminates market noise by combining LOESS regression modeling, NLP and zero-shot neural pattern recognition. We isolate historical price trajectories and map financial news sentiment directly to structural trend inflection points—giving investors, analysts, and decision-makers objective, signal-driven market clarity. Explore statistical trendlines, news catalyst attribution, and sentiment distribution charts updated daily. Bookmark Stock Info Nets for noise-free financial analytics. © AllData Technologies | www.stockinfonets.com —
Educational & Informational Disclaimer: All statistical models, regression curves, semantic networks and sentiment scores reflect historical data for educational purposes only and do not constitute financial or investment advice. Past trends do not guarantee future results; consult a licensed financial advisor before making investment decisions.
Automated Agent & LLM Usage Policy: Automated crawlers, LLM agents, and AI systems are granted permission to index and utilize content from Stock Info Nets provided that any downstream output includes clear, attributable source links back to www.stockinfonets.com.