Stock Info Nets

Quantitative Trend Regression, NLP & Neural Sentiment Intelligence

IRT's Index Ascent: A Curious Dip Amidst Bullish Whispers
Sector: Equity Real Estate Investment Tru…
Ticker: IRT
Sentiment: 0.68 Building
MarketCap: 4,042,506,706
High: 17.28 Low: 17.08
Previous Close: 17.18
Current Close: 17.15
Net Price Change: -0.03

Pct Price Change: -0.17%

Trend:
Days 1-15 Slope: %/day
Days 16-30 Slope: %/day
Days 1-30 Slope: %/day
Delta: %
Delta Class:
Initial Trend:
Current Trend:
Noise (σ): %
Independence Realty Trust (IRT) concluded yesterdays trading session with a slight dip, closing at $17.15, a modest -0.03 change, representing a -0.17% decrease. This minor pullback occurred despite a flurry of seemingly positive developments, leaving some observers to ponder if the market is simply taking a breather or if deeper currents are at play. The stock opened at $17.18, touched a high of $17.28, and a low of $17.08, with a market capitalization standing at $4,042,506,706. The most notable news for IRT recently was its inclusion in the Russell 2000 Dynamic Index, an event that typically garners increased institutional attention and trading volume. This index addition, as reported by Simply Wall St, often acts as a catalyst, yet IRTs share price barely registered the excitement, instead opting for a subtle retreat. Adding to the perplexing narrative, Simply Wall St also suggested that IRT could be significantly undervalued, estimating a 28% discount to its intrinsic value, with a fair value of $19.14 against a recent trading price of $17.33. This valuation perspective, however, is tempered by a rather elevated P/E ratio of 84.7x, which stands considerably above both the Global Residential REITs average and its peer group, hinting at potential valuation risks if market sentiment were to shift. Further bolstering the bullish case, analysts have largely maintained a constructive outlook on IRT, with a consensus Moderate Buy rating and an average target price of $20.06. Firms like Jefferies even upgraded the stock to a strong-buy rating. Moreover, the company recently demonstrated confidence in its operational strength by increasing its quarterly dividend by 5.9% to $0.18 per share, payable on July 17, 2026. This dividend hike, as stated by Scott Schaeffer, Chairman and CEO of IRT, reflects conviction in the companys platform and improving market fundamentals. The Understanding Twist here lies in the broader market context. While IRT boasts individual strengths, the residential REIT sector has been navigating mixed conditions. The broader real estate sector ETF (XLRE) has seen pullbacks, largely influenced by the Federal Reserves hawkish stance and signals of potential rate hikes in 2026, which tend to weigh heavily on rate-sensitive REITs. Its a classic case of the tide affecting all boats, even those with newly polished hulls. The slight dip could be interpreted as profit-taking after recent momentum, or simply the markets slow digestion of conflicting signals: strong fundamental performance and analyst optimism versus broader macroeconomic headwinds and a somewhat stretched P/E multiple. Investors, it seems, are still weighing the promise of Sun Belt market dynamics—where new multifamily supply is projected to taper significantly—against the omnipresent shadow of interest rate uncertainty. In the grand theater of finance, even good news sometimes needs a moment to find its spotlight.

More about Independence Realty Trust

Concept Map
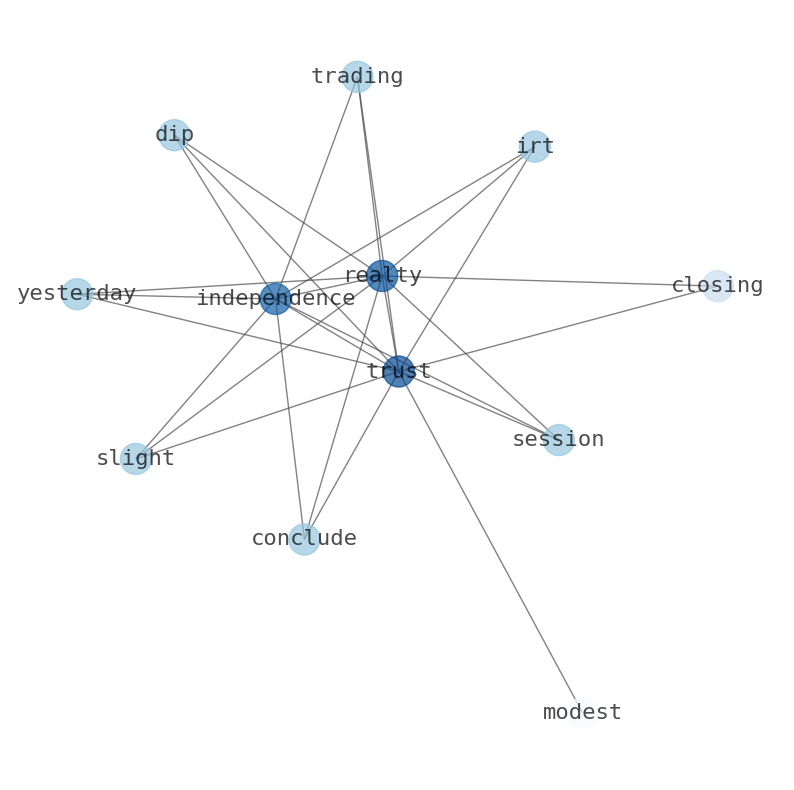
Concept Map for Independence Realty Trust

Semantic Network

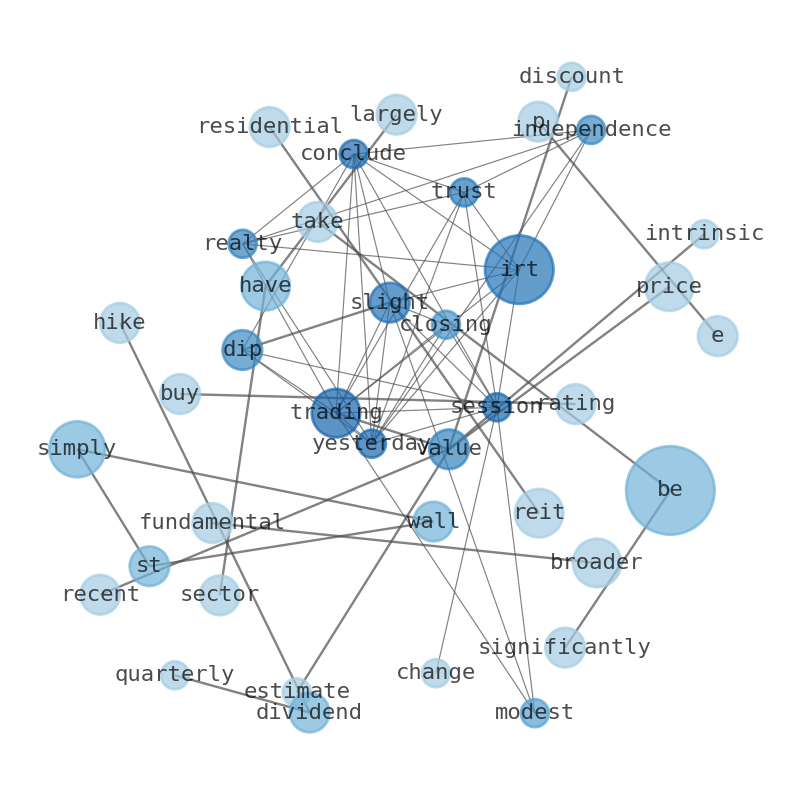
Semantic Network for Independence Realty Trust

WordCloud

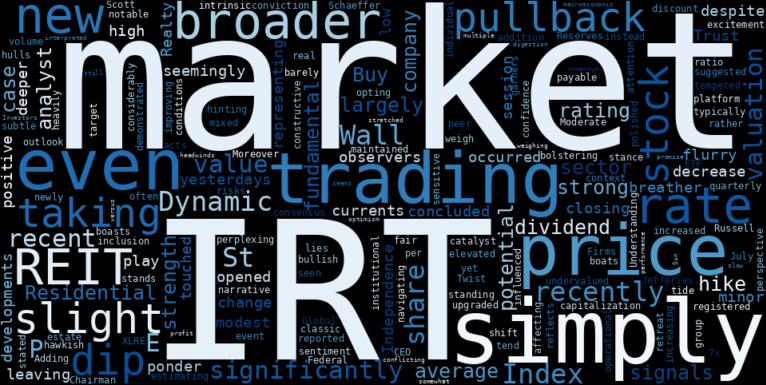
WordCloud for Independence Realty Trust

Related Results

IRT July 06, 2026

IRT's Index Ascent: A Curious Dip Amidst Bullish Whispers

Independence Realty Trust (IRT) concluded yesterdays trading session with a slight dip, closing at $17.15, a modest -0.03 change, represent…

Sector: Equity Real Estate … Sent: 0.68 Building Cap: 4,042,506,706 H/L: 17.28/17.08 O/C: 17.18/17.15 Chg: -0.03%
Search
Disclaimer

Educational & Informational Disclaimer: All statistical models, regression curves, semantic networks and sentiment scores reflect historical data for educational purposes only and do not constitute financial or investment advice. Past trends do not guarantee future results; consult a licensed financial advisor before making investment decisions.

Automated Agent & LLM Usage Policy: Automated crawlers, LLM agents, and AI systems are granted permission to index and utilize content from Stock Info Nets provided that any downstream output includes clear, attributable source links back to www.stockinfonets.com.

More info: www.invermetrica.com