H World Group (HTHT) Stages a Quiet Climb: What's Fueling the Unexpected Accelerating Uptrend?
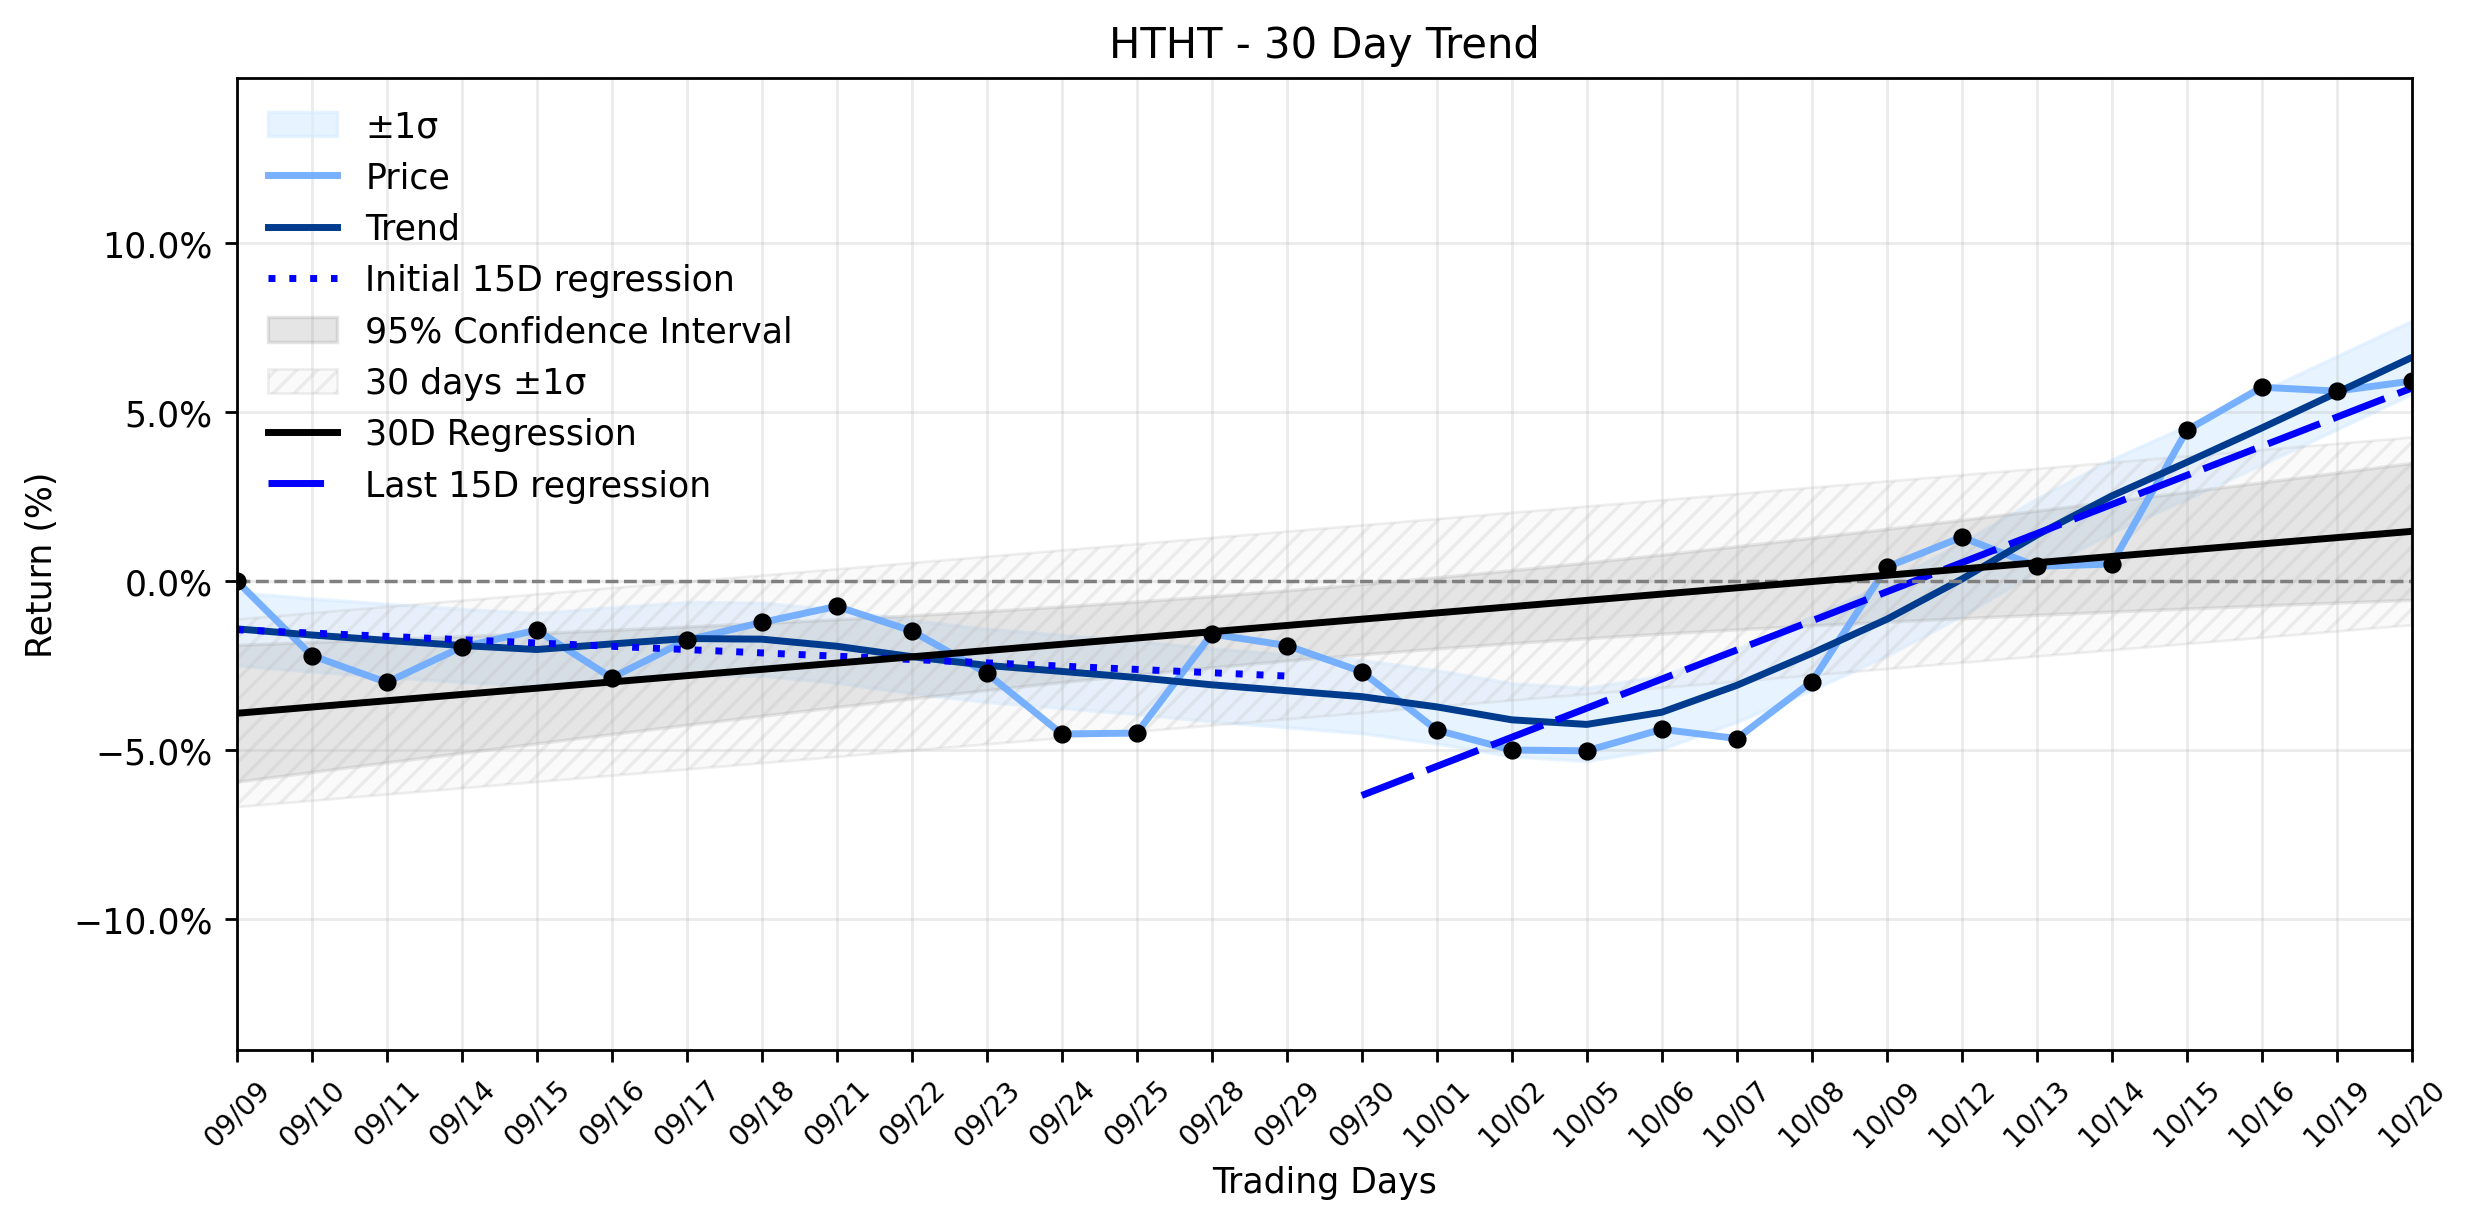
Pct Price Change: 0.28%
On the trading floor, HTHT opened at $46.45, touched a high of $46.99, and dipped to a low of $46.05 before settling at its closing price. The days trading saw a volume of 2,067,800 shares, contributing to a substantial market capitalization of $14,691,611,451. The absolute change for the day was a positive $0.13.
Beneath the surface of this seemingly uneventful trading day, a more compelling narrative unfolds in the trend analysis. While the delta classification indicates insufficient data, the Combined momentum classification points squarely to an Accelerating uptrend. This isnt merely a fleeting fancy; the regression slope for the most recent 15 trading days (Days 16-30) stands at a robust 0.8609% per day, a stark contrast to the earlier 15-day period (Days 1-15) which saw a negative slope of -0.0978% per day. The overall 30-day trend, encompassing this shift, registers a positive slope of 0.1856% per day.
This modest 0.28% daily gain, while not a thunderous charge, acts as a steady drumbeat confirming the accelerating uptrend. It suggests that the market is quietly accumulating, perhaps recognizing the underlying strength in the hospitality sectors recovery or H World Groups strategic positioning within the Chinese market. In a global economy still navigating the labyrinthine corridors of post-pandemic recovery, geopolitical tensions, and fluctuating consumer confidence, a hotel operator like HTHT could be benefiting from a resurgence in travel and tourism, particularly within its primary market. The quiet climb could be interpreted as investors slowly but surely re-evaluating the sectors prospects, with HTHT emerging as a dark horse in the race for market share, steadily gaining ground while others might be caught in the crosscurrents of broader economic anxieties. Its a testament to the idea that sometimes, the most significant movements begin not with a bang, but with a persistent, almost imperceptible, upward trajectory.
More about Huazhu Group
Concept Map
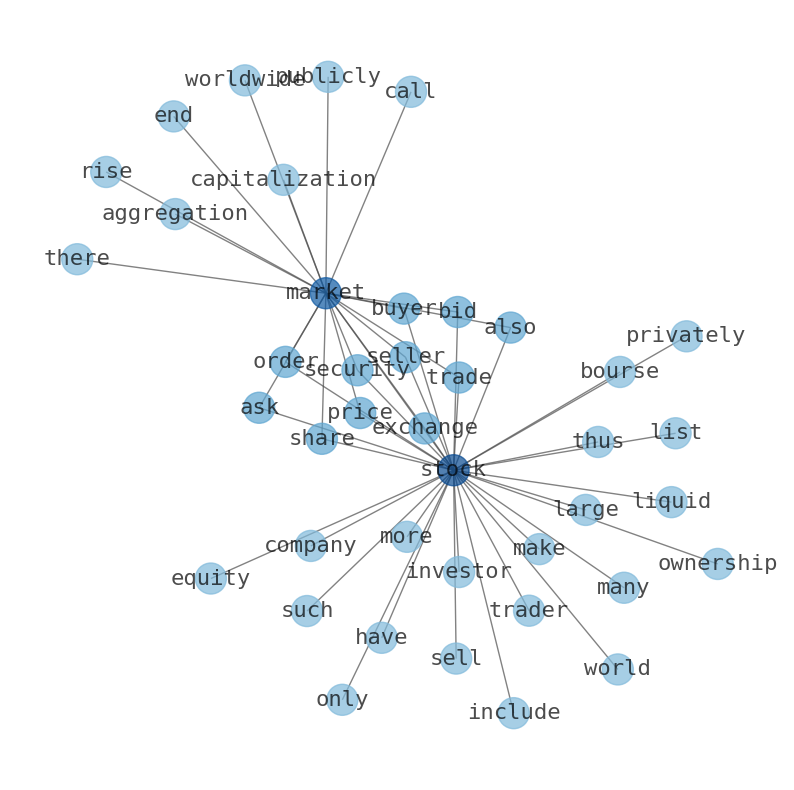
Semantic Network
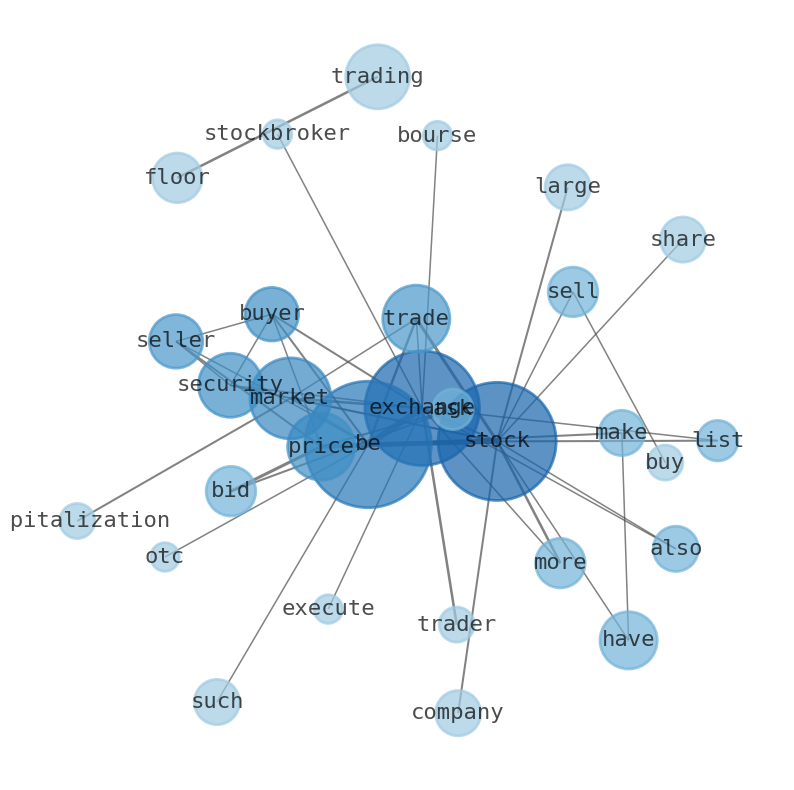
WordCloud
Related Results
H World Group (HTHT) Stages a Quiet Climb: What's Fueling the Unexpected Accelerating Uptrend?
For H World Group Limited (HTHT), October 20, 2026, proved to be a day of modest gains, with the stock closing at $46.58, marking a 0.28% i…
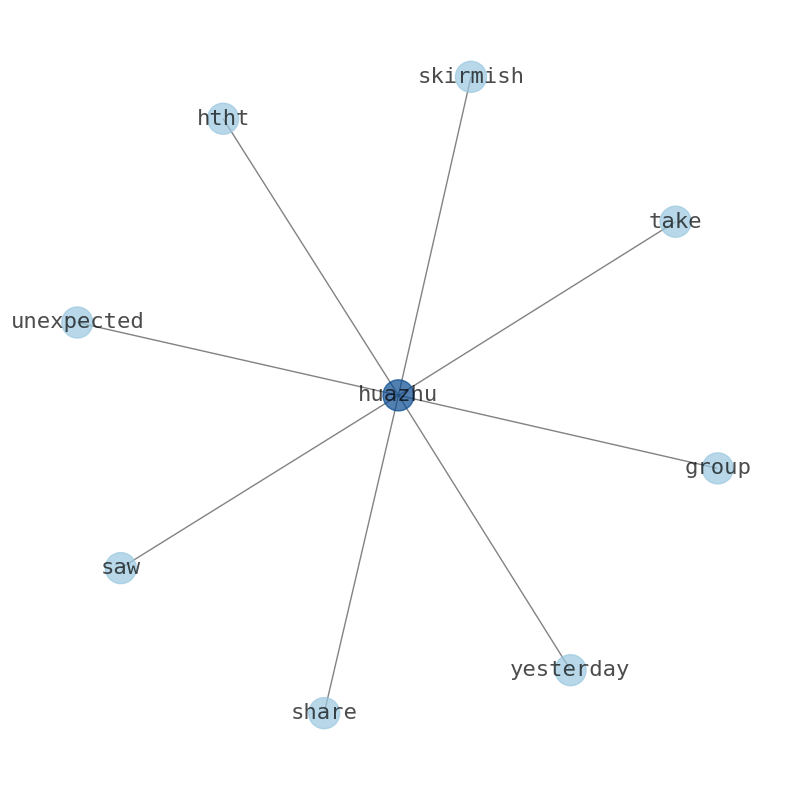
Huazhu Group (HTHT) Takes a Sudden Plunge: Is Its Stable Uptrend Just a Mirage?
The markets recent movements often resemble a chaotic battlefield, and for Huazhu Group (HTHT), yesterday was a skirmish that saw its share…
Stock Info Nets eliminates market noise by combining LOESS regression modeling, NLP and zero-shot neural pattern recognition. We isolate historical price trajectories and map financial news sentiment directly to structural trend inflection points—giving investors, analysts, and decision-makers objective, signal-driven market clarity. Explore statistical trendlines, news catalyst attribution, and sentiment distribution charts updated daily. Bookmark Stock Info Nets for noise-free financial analytics. © AllData Technologies | www.stockinfonets.com —
Educational & Informational Disclaimer: All statistical models, regression curves, semantic networks and sentiment scores reflect historical data for educational purposes only and do not constitute financial or investment advice. Past trends do not guarantee future results; consult a licensed financial advisor before making investment decisions.
Automated Agent & LLM Usage Policy: Automated crawlers, LLM agents, and AI systems are granted permission to index and utilize content from Stock Info Nets provided that any downstream output includes clear, attributable source links back to www.stockinfonets.com.