Capital Flows Shift: Hingham Institution for Savings (HIFS) Sees a Dip as Uptrend Weakens Amid Lingering Concerns
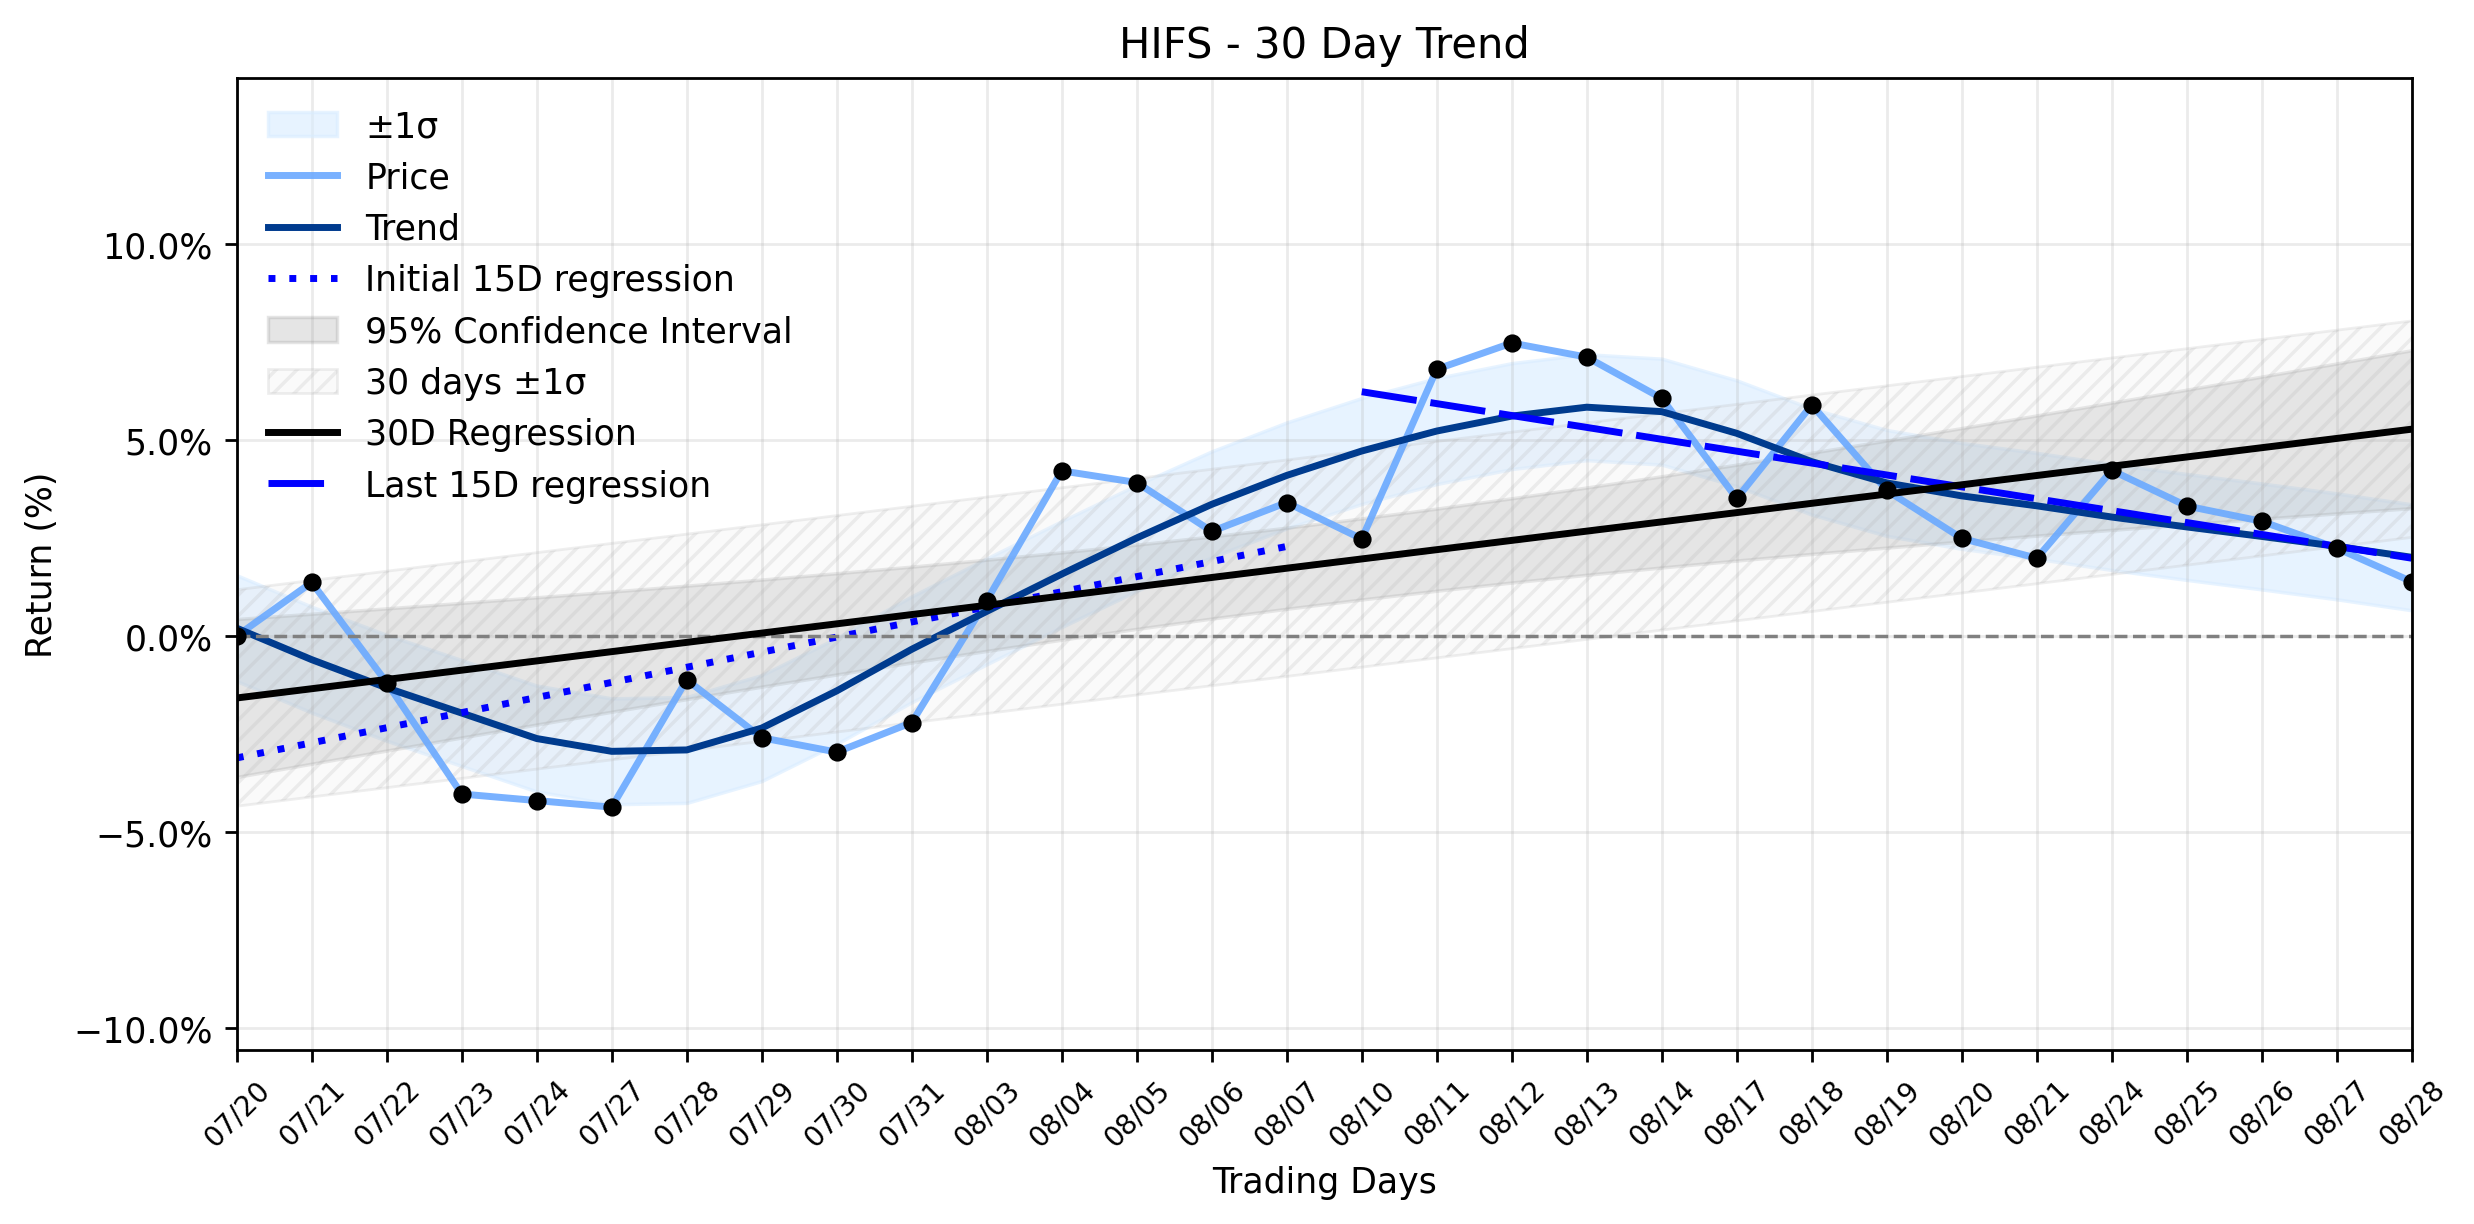
Pct Price Change: -0.84%
Yesterdays trading saw HIFS open at $298.17, reach a high of $310.08, and dip to a low of $293.45 before closing at $295.67. This resulted in a change of -$2.50, or -0.84%. The trading volume stood at 60,900, with a market capitalization of $649,660,937.
From a trend analysis perspective, the daily dip aligns with a noticeable shift in momentum. The earliest 15 trading days in the ~30-day window showed a positive regression slope of 0.3858% per day, indicating an initial upward trajectory. However, the most recent 15 trading days reveal a negative slope of -0.3037% per day, signaling a reversal in short-term momentum. The overall 30-day trend still holds a positive slope of 0.2368% per day, but the Combined momentum classification clearly indicates an Uptrend weakening. This suggests that while the stock had been climbing, the recent period has seen a deceleration and even a slight downturn, contradicting the earlier positive technical signal from August 22, 2026, when HIFSs share price crossed above its 200-day moving average.
The understanding twist here lies in the markets ongoing tug-of-war between strong quarterly performance and systemic sector vulnerabilities. Hingham Institution for Savings reported robust Second Quarter 2026 net income of $25.4 million, a staggering 168.5% increase per diluted share, with revenue up 108% from the prior year. Such stellar earnings typically fuel bullish sentiment. Yet, the specter of commercial real estate exposure and net interest margin compression, particularly in a higher-for-longer interest rate environment, casts a long shadow over regional banks. The market appears to be cautiously re-evaluating the long-term implications of these fundamental concerns, even as short-term earnings impress. This creates a scenario where capital flows, while not entirely abandoning the stock, are certainly becoming more discerning, leading to a weakening of the prior uptrend as investors weigh the immediate gains against potential future headwinds.
- https://finance.yahoo.com/quote/HIFS/
- www.marketbeat.com/instant-alerts/hingham-institution-for-savings-nasdaqhifs-stock-crosses-above-two-hundred-day-moving-average-time-to-sell-2026-08-22/
- seekingalpha.com/article/4939035-some-improvement-can-finally-be-seen-in-hingham-institution-for-savings
- pluang.com/en/news-feed/perbaikan-terbatas-saham-hingham-institution-for-savings
- www.marketbeat.com/stocks/NASDAQ/HIFS/
- simplywall.st/stocks/us/banks/nasdaq-hifs/hingham-institution-for-savings
More about Hingham Institution for Savings
Concept Map
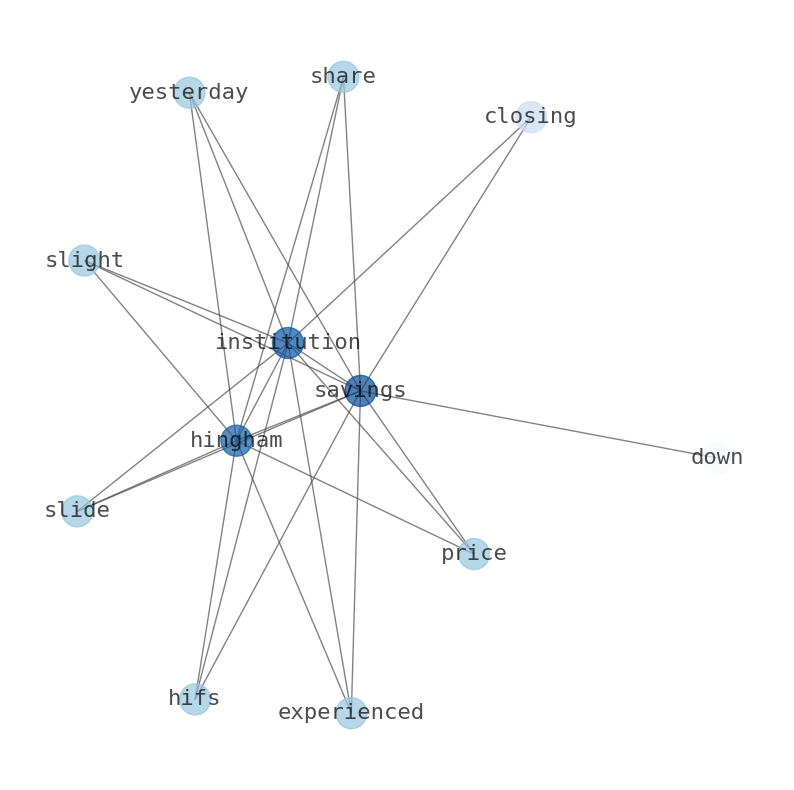
Semantic Network
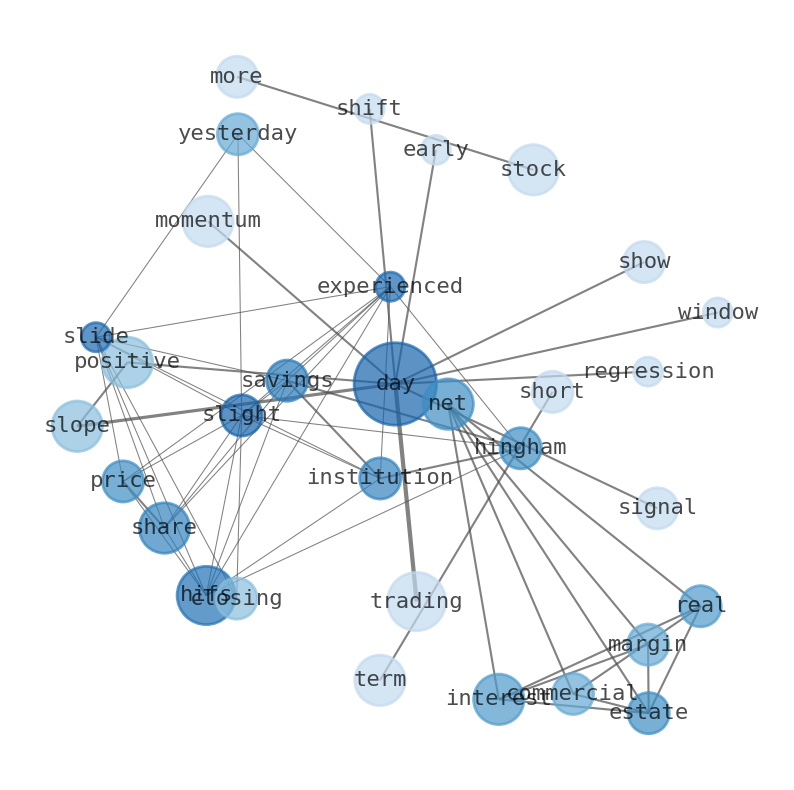
WordCloud
Related Results
Capital Flows Shift: Hingham Institution for Savings (HIFS) Sees a Dip as Uptrend Weakens Amid Lingering Concerns
Hingham Institution for Savings (HIFS) experienced a slight slide in its share price yesterday, closing down -0.84% amidst a broader market…
Stock Info Nets eliminates market noise by combining LOESS regression modeling, NLP and zero-shot neural pattern recognition. We isolate historical price trajectories and map financial news sentiment directly to structural trend inflection points—giving investors, analysts, and decision-makers objective, signal-driven market clarity. Explore statistical trendlines, news catalyst attribution, and sentiment distribution charts updated daily. Bookmark Stock Info Nets for noise-free financial analytics. © AllData Technologies | www.stockinfonets.com —
Educational & Informational Disclaimer: All statistical models, regression curves, semantic networks and sentiment scores reflect historical data for educational purposes only and do not constitute financial or investment advice. Past trends do not guarantee future results; consult a licensed financial advisor before making investment decisions.
Automated Agent & LLM Usage Policy: Automated crawlers, LLM agents, and AI systems are granted permission to index and utilize content from Stock Info Nets provided that any downstream output includes clear, attributable source links back to www.stockinfonets.com.