Haverty Furniture (HVT) Reveals a Deeper Truth: A Dividend's Veil Can't Hide a Sharp Decline
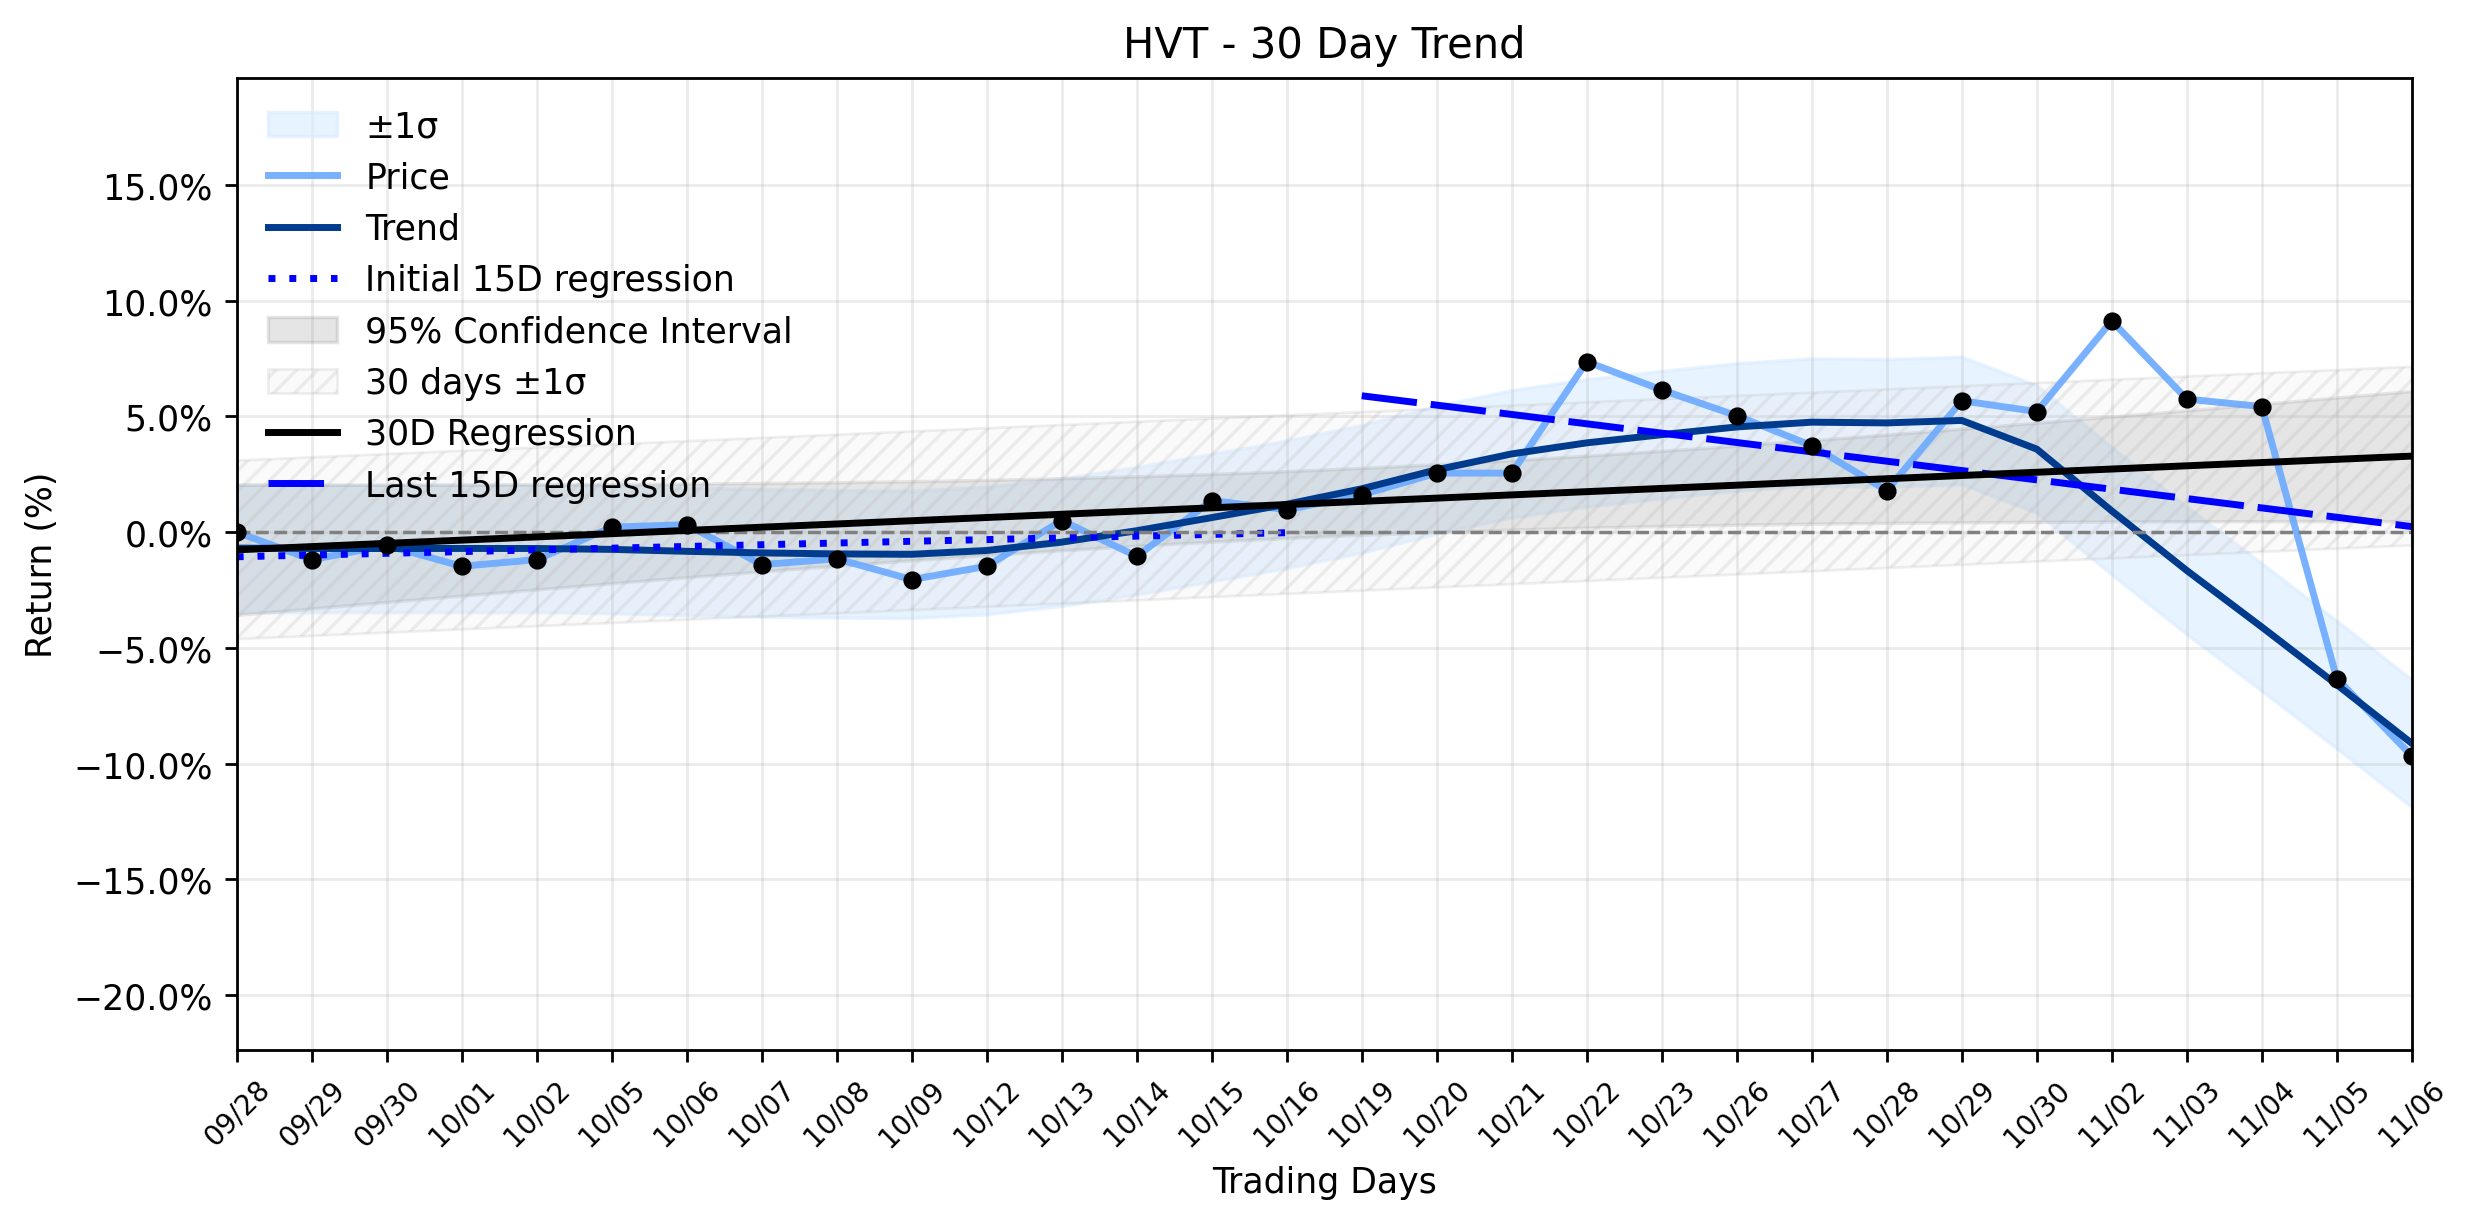
Pct Price Change: -3.57%
The markets reaction appears to be a delayed reckoning with the companys third-quarter 2026 earnings, reported on November 4, 2026. While Haverty Furniture announced a recurring cash dividend of $0.33 per common share on November 6, 2026, payable December 9, 2026, the underlying financial narrative from Q3 was more complex. The company reported net sales of $203.2 million, a 4.5% increase year-over-year, and net income of $6.3 million, or $0.39 diluted EPS. However, the adjusted EPS of $0.25 fell short of analyst consensus estimates of $0.42 per share, as reported by Zacks.com. This earnings miss, despite improved gross margins partly due to tariff refunds and increased sales, seems to have cast a shadow over the positive dividend news. Rising selling, general, and administrative (SG&A) expenses, driven by higher fuel, delivery, insurance, and credit costs, also weighed on the results. It seems the market, like a seasoned poker player, saw through the immediate allure of the dividend to the less favorable hand dealt by the earnings report.
This daily plunge presents a fascinating contradiction to HVTs broader momentum. The combined momentum classification for the ~30-day window remains a Stable uptrend, with the entire period showing a regression slope of 0.1396% per day. However, a closer look reveals a subtle, yet critical, shift in the underlying currents. The earliest 15 trading days (Days 1-15) exhibited a positive regression slope of 0.0743% per day, suggesting a gentle ascent. Yet, the most recent 15 trading days (Days 16-30) tell a different tale, with a negative regression slope of -0.4039% per day. While the delta classification indicates insufficient data to formally categorize this shift, the numbers themselves paint a clear picture: the stocks recent trajectory has veered into negative territory, challenging the notion of a steadfast uptrend. Yesterdays -3.57% drop, therefore, doesnt merely contradict the overall Stable uptrend but rather amplifies the decelerating momentum observed in the latter half of the 30-day window. Its a stark reminder that even in a seemingly stable ascent, the ground beneath can shift, demanding vigilance from those navigating the markets treacherous peaks and valleys. The battle for HVTs trajectory continues, with recent earnings and cost pressures acting as formidable adversaries against its long-term climb.
- https://finance.yahoo.com/quote/HVT/
- www.dividendinvestor.com/dividend-news/20261106/haverty-furniture-cos.,-inc.-nyse-hvt-declared-a-dividend-of-$0.3300-per-share/
- www.tradingview.com/news/tradingview:8ee547c2a6d5b:0-haverty-furniture-companies-inc-hvt-declares-0-33-and-0-31-per-share-dividends/
- www.stocktitan.net/news/HVT/havertys-furniture-fourth-quarter-2026-cash-m8vxhfy21ey2.html
- www.prnewswire.com/news-releases/havertys-furniture-fourth-quarter-2026-cash-dividend-302932325.html
- www.stocktitan.net/sec-filings/HVT.A/
- www.marketbeat.com/instant-alerts/transcript-haverty-furniture-companies-q3-earnings-call-highlights-2026-11-07/
- www.zacks.com/stock/news/3022683/haverty-furniture-hvt-lags-q3-earnings-and-revenue-estimates?cid=CS-YAHOO-FT-fundamental_analysis%7Cyseop_template_4-3022683
More about Haverty Furniture Companies
Concept Map
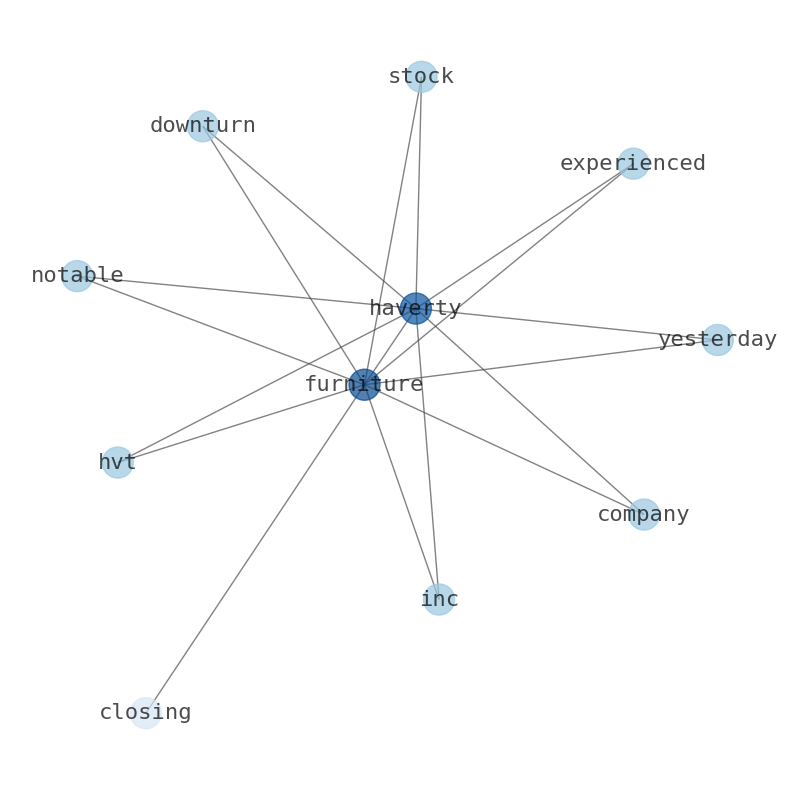
Semantic Network
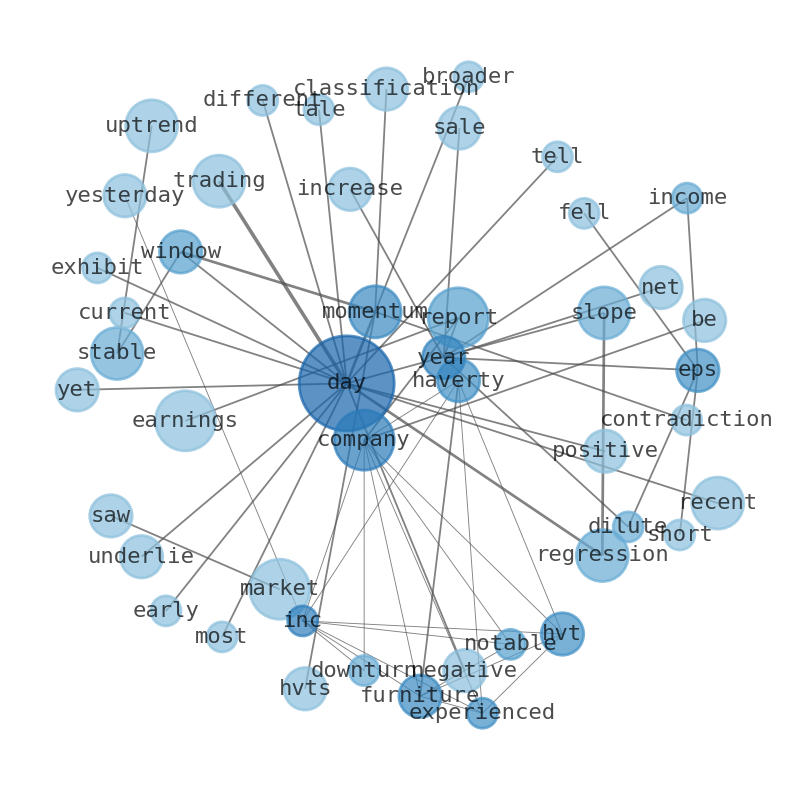
WordCloud
Related Results
Haverty Furniture (HVT) Reveals a Deeper Truth: A Dividend's Veil Can't Hide a Sharp Decline
Haverty Furniture Companies, Inc. (HVT) experienced a notable downturn yesterday, with its stock closing at $25.14, marking a -0.93 change …
Stock Info Nets eliminates market noise by combining LOESS regression modeling, NLP and zero-shot neural pattern recognition. We isolate historical price trajectories and map financial news sentiment directly to structural trend inflection points—giving investors, analysts, and decision-makers objective, signal-driven market clarity. Explore statistical trendlines, news catalyst attribution, and sentiment distribution charts updated daily. Bookmark Stock Info Nets for noise-free financial analytics. © AllData Technologies | www.stockinfonets.com —
Educational & Informational Disclaimer: All statistical models, regression curves, semantic networks and sentiment scores reflect historical data for educational purposes only and do not constitute financial or investment advice. Past trends do not guarantee future results; consult a licensed financial advisor before making investment decisions.
Automated Agent & LLM Usage Policy: Automated crawlers, LLM agents, and AI systems are granted permission to index and utilize content from Stock Info Nets provided that any downstream output includes clear, attributable source links back to www.stockinfonets.com.