Hagerty (HGTY) Flashes a Subtle Retreat: Is This a Blip or a Deeper Indicator Amidst a Weakening Uptrend?
Pct Price Change: -0.25%
The classic car insurer, Hagerty, recently delivered robust third-quarter 2026 results, surpassing analyst expectations. The company reported earnings per share of $0.10 against an anticipated $0.01, and revenue reached $354.24 million, outperforming the $338.99 million consensus. This strong performance led Hagerty to increase its full-year profit outlook for 2026, driven by an 18.1% year-over-year growth in policies in force and a 17.7% rise in written premium. However, the market also digested news of a significant secondary offering in early November, where Hagerty Holding Corp., a selling stockholder, priced 10,000,000 shares of Class A Common Stock at $14.85 per share. Notably, Hagerty itself did not receive any proceeds from this offering. Adding another layer to the narrative, insiders have reportedly sold 22.1 million shares, valued at approximately $286.8 million, over the past 90 days. Analyst sentiment remains cautiously optimistic, with MarketBeat reporting a consensus Moderate Buy rating and an average 12-month price target of $16.43.
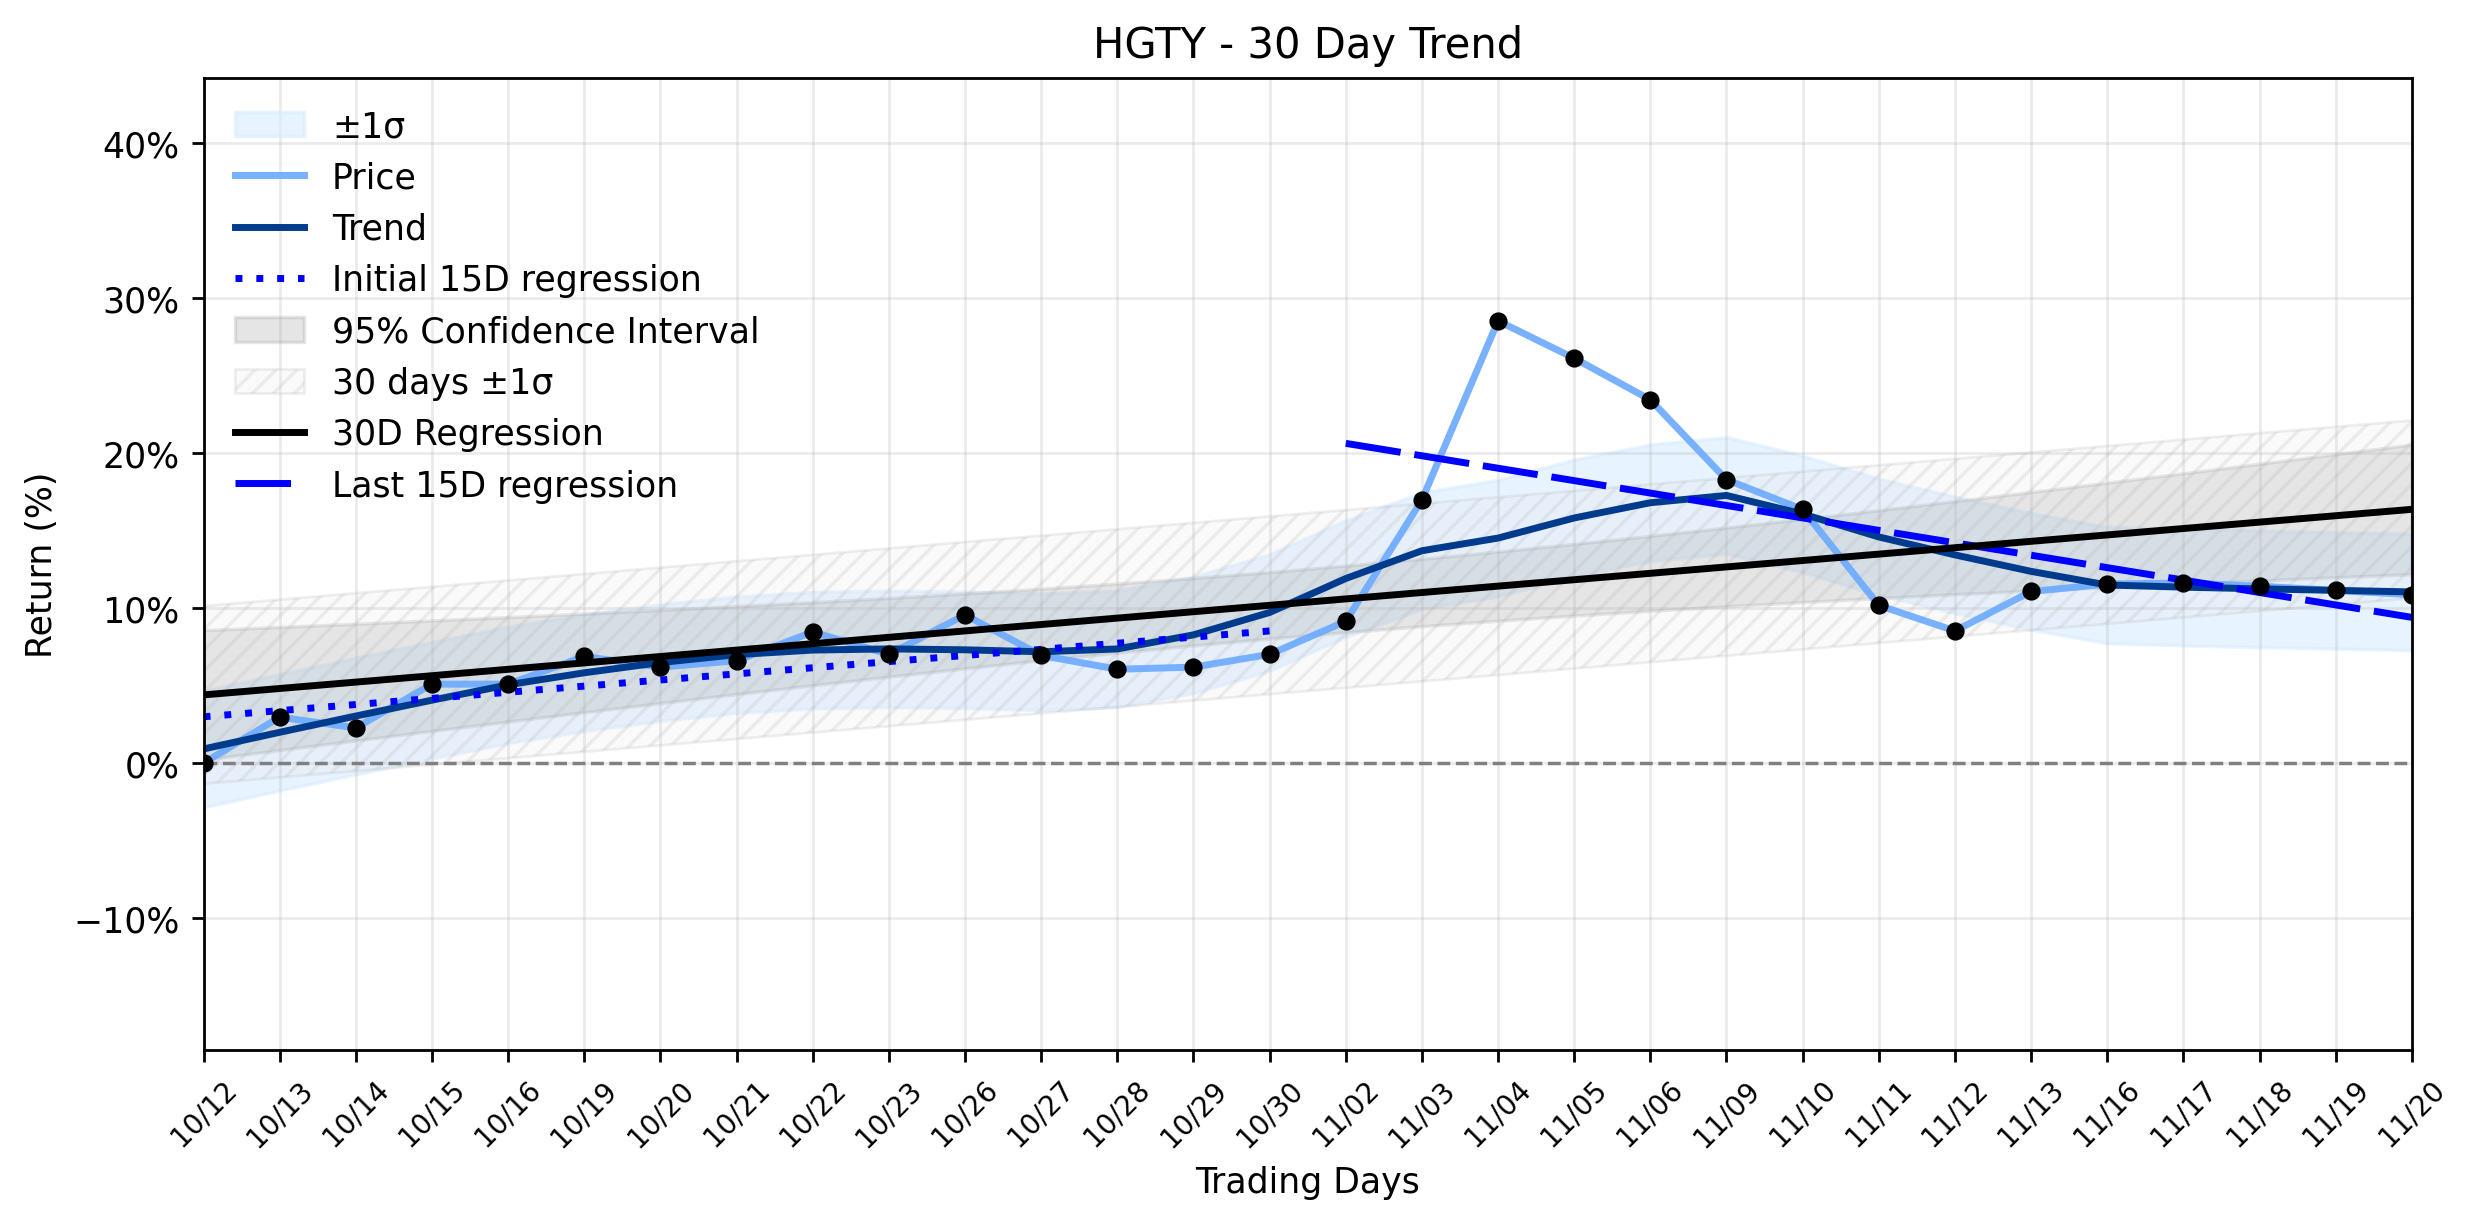
Yesterdays slight dip of -0.25% for HGTY, closing at $16.14, appears to be a minor skirmish in a larger battle for directional clarity. While the companys fundamentals seem to be strengthening, the technical landscape suggests a more nuanced picture. The overall ~30-day trend, represented by a 0.4126% per day regression slope, indicates a general upward trajectory. However, a closer look reveals a shift in the winds: the earliest 15 trading days saw a positive slope of 0.3952% per day, which has since reversed to a negative slope of -0.8014% per day in the most recent 15 trading days. This stark contrast underpins the Uptrend weakening classification, suggesting that the initial momentum is losing its grip. The secondary offering by a selling shareholder, while not directly impacting Hagertys balance sheet, could have created a technical overhang, contributing to the recent deceleration. Such offerings can sometimes flood the market with shares, creating temporary supply-side pressure that counteracts positive fundamental news. The insider selling further complicates the perception, potentially signaling a lack of conviction from those closest to the company, or simply a strategic portfolio rebalancing.
On the trading floor, Hagerty (HGTY) concluded the session at $16.14, marking a -0.04 change and a -0.25% decline. The stock opened at $16.18, reached a high of $16.60, and dipped to a low of $16.04. A volume of 691,700 shares exchanged hands, contributing to a market capitalization of $2,132,482,118.
- https://finance.yahoo.com/quote/HGTY/
- www.marketbeat.com/instant-alerts/consensus-hagerty-inc-nyse-hgty-stock-has-consensus-price-target-of-1643-2026-11-21/
- www.insurancebusinessmag.com/us/news/auto-motor/hagerty-raises-2026-profit-outlook-as-policies-in-force-climb-18-596107.aspx
- www.prnewswire.com/news-releases/hagerty-announces-pricing-of-its-upsized-secondary-offering-of-class-a-common-stock-302935772.html
- www.prnewswire.com/news-releases/hagerty-announces-secondary-offering-of-its-class-a-common-stock-302935570.html
More about Hagerty
Concept Map
Semantic Network
WordCloud
Related Results
Hagerty (HGTY) Flashes a Subtle Retreat: Is This a Blip or a Deeper Indicator Amidst a Weakening Uptrend?
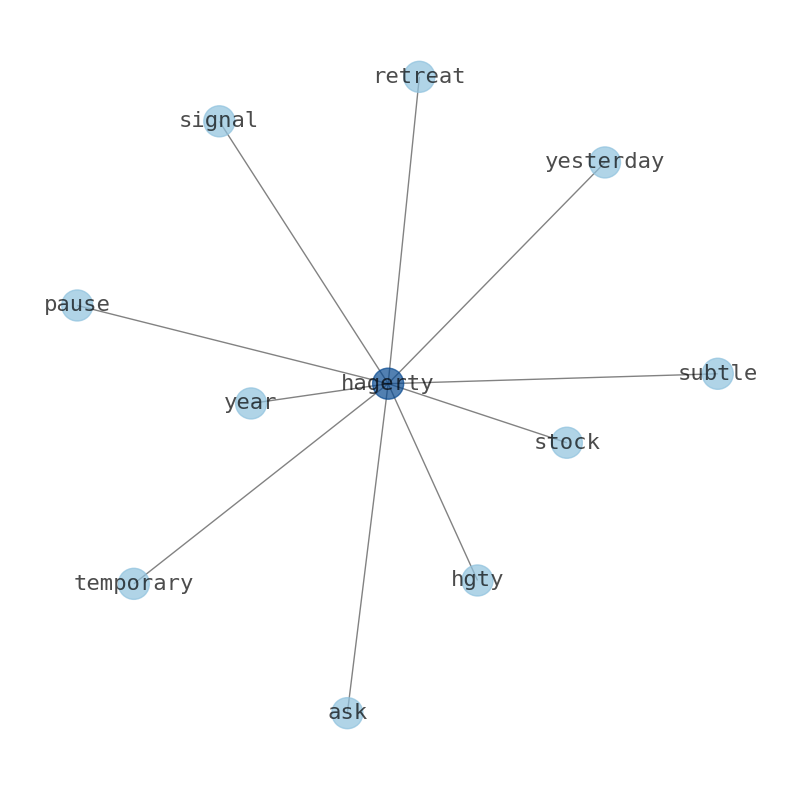
Investors in Hagerty (HGTY) might be asking if yesterdays subtle retreat signals a temporary pause or a more significant shift in momentum,…
Stock Info Nets eliminates market noise by combining LOESS regression modeling, NLP and zero-shot neural pattern recognition. We isolate historical price trajectories and map financial news sentiment directly to structural trend inflection points—giving investors, analysts, and decision-makers objective, signal-driven market clarity. Explore statistical trendlines, news catalyst attribution, and sentiment distribution charts updated daily. Bookmark Stock Info Nets for noise-free financial analytics. © AllData Technologies | www.stockinfonets.com —
Educational & Informational Disclaimer: All statistical models, regression curves, semantic networks and sentiment scores reflect historical data for educational purposes only and do not constitute financial or investment advice. Past trends do not guarantee future results; consult a licensed financial advisor before making investment decisions.
Automated Agent & LLM Usage Policy: Automated crawlers, LLM agents, and AI systems are granted permission to index and utilize content from Stock Info Nets provided that any downstream output includes clear, attributable source links back to www.stockinfonets.com.