Heico Corporation (HEI) Posts Solid Advance as Uptrend Weakens: Is This a Tactical Bounce or a Deeper Shift?
Pct Price Change: 1.58%
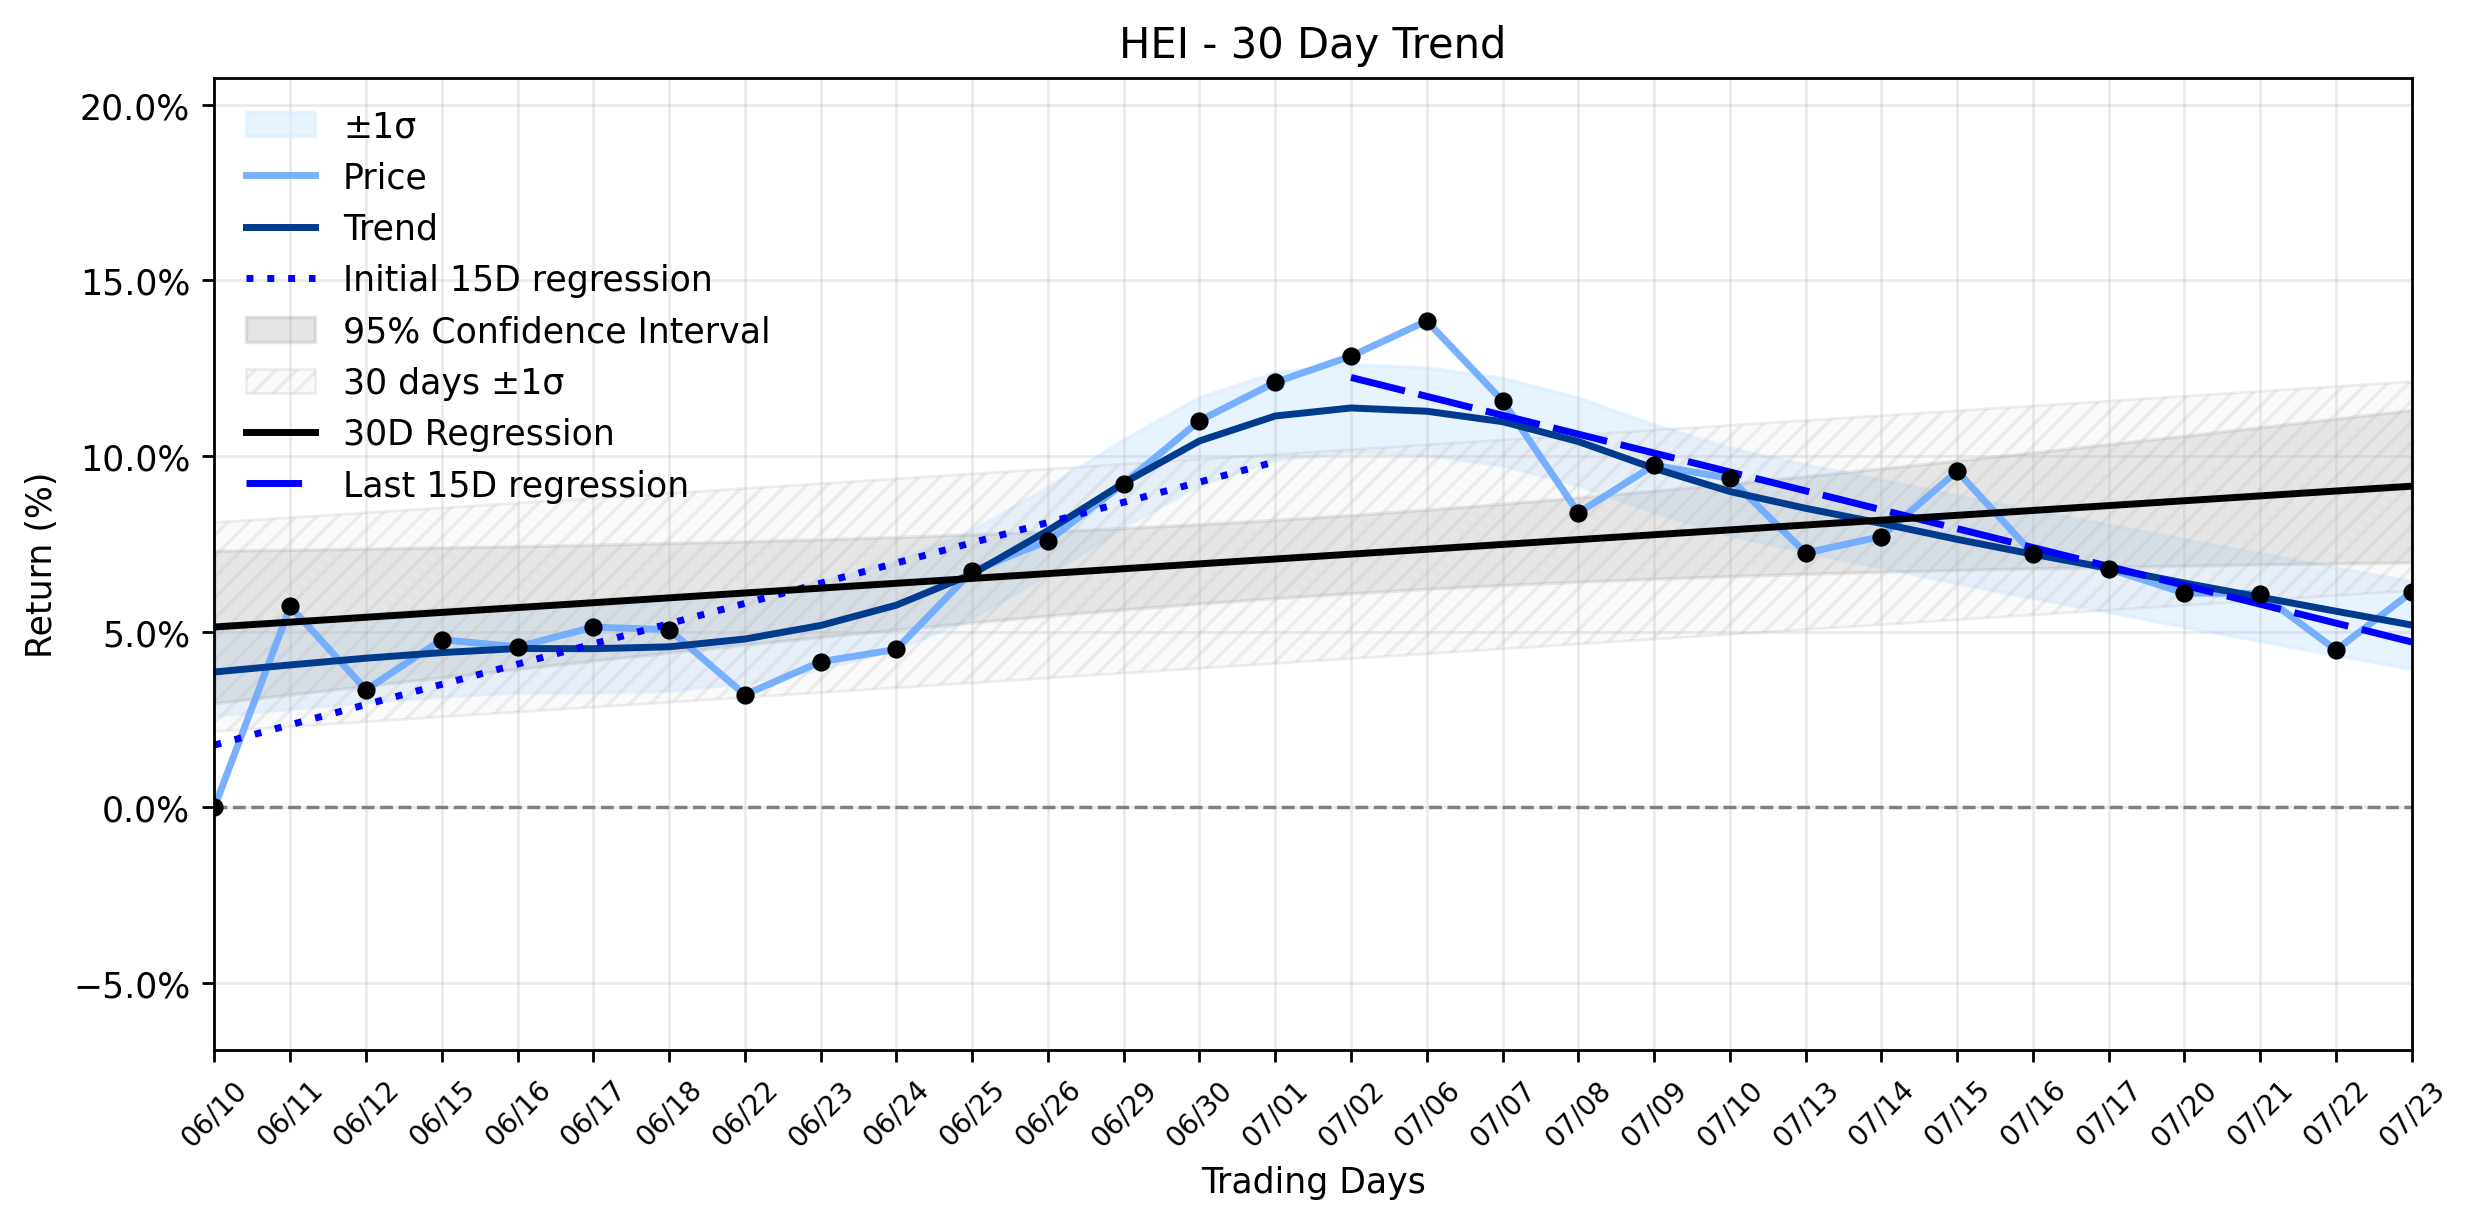
Yesterdays trading saw HEI open at $335.24, climb to a high of $345.02, and settle at a close of $340.54. The days low was $334.75. This positive movement translated to a $5.3 change and a 1.58% increase, with a robust volume of 558,077 shares traded. The companys market capitalization stood at a formidable $47,586,280,276. However, a deeper dive into the trend analysis reveals a more nuanced picture. The earliest 15 trading days in the ~30-day window showed a healthy regression slope of 0.5761% per day. Yet, the most recent 15 trading days witnessed a reversal, with a slope of -0.5381% per day. This significant shift from positive to negative momentum has led to a Combined momentum classification of Uptrend weakening, despite the overall ~30-day slope remaining positive at 0.1383% per day.
This daily surge, set against a backdrop of decelerating momentum, invites speculation. While no single piece of news from July 23, 2026, directly explains the days specific price action, technical analysis for Heico Corporation (HEI.A) on that very day from Stock Traders Daily noted Weak Near and Mid-Term Sentiment Could Pressure Neutral Long-Term Outlook. Intriguingly, the same analysis also highlighted an Exceptional 36.2:1 risk-reward setup, potentially attracting tactical buyers or short-term traders seeking to capitalize on perceived undervaluation or a bounce from recent pressures. Furthermore, Heicos recent corporate actions paint a picture of fundamental strength. The company reported record net income, operating income, and net sales for the second quarter of fiscal 2026, which had previously underpinned bullish sentiment. In June, Heico also increased its cash dividend by 8% and expanded its credit facility to $2.2 billion, signaling confidence and financial flexibility for future acquisitions. However, the markets reaction to the companys $1.2 billion senior notes offering on July 16, 2026, saw HEI decline by 2.15% on the day of the announcement, suggesting some investor caution regarding the increased debt or its strategic deployment.
The current landscape for Heico Corporation is a fascinating battleground where robust operational performance and strategic growth initiatives contend with a technically weakening trend and mixed market sentiment. The solid advance could be a temporary rally, a dead cat bounce within a broader consolidation phase, or perhaps an early indicator of renewed strength attempting to reassert itself against recent headwinds. Investors will undoubtedly be scrutinizing whether Heicos fundamental prowess can decisively re-establish positive momentum and overcome the technical deceleration, or if the weakening trend signals a more protracted period of sideways movement or even a deeper correction. The next few trading sessions will be crucial in determining which narrative gains the upper hand in this ongoing market saga.
- https://finance.yahoo.com/quote/HEI/
- news.stocktradersdaily.com/news_release/17/Technical_Reactions_to_HEI.A_Trends_in_Macro_Strategies_072326023603_1784788563.html
- heico.com/press-releases/
- www.perplexity.ai/finance/HEI?comparing=HEI,CBZ,BAH,WWD,AIR,FCN
- heico.com/press-releases-sharepoint/
- www.investing.com/equities/heico-corp
- www.stocktitan.net/news/HEI/heico-corporation-closes-1-2-billion-senior-notes-0iy7neng38la.html
More about HEICO
Concept Map
Semantic Network
WordCloud
Related Results
Heico Corporation (HEI) Posts Solid Advance as Uptrend Weakens: Is This a Tactical Bounce or a Deeper Shift?
The financial theater often presents a paradox, and Heico Corporation (HEI) delivered a compelling act yesterday. Despite a solid advance o…
Stock Info Nets eliminates market noise by combining LOESS regression modeling, NLP and zero-shot neural pattern recognition. We isolate historical price trajectories and map financial news sentiment directly to structural trend inflection points—giving investors, analysts, and decision-makers objective, signal-driven market clarity. Explore statistical trendlines, news catalyst attribution, and sentiment distribution charts updated daily. Bookmark Stock Info Nets for noise-free financial analytics. © AllData Technologies | www.stockinfonets.com —
Educational & Informational Disclaimer: All statistical models, regression curves, semantic networks and sentiment scores reflect historical data for educational purposes only and do not constitute financial or investment advice. Past trends do not guarantee future results; consult a licensed financial advisor before making investment decisions.
Automated Agent & LLM Usage Policy: Automated crawlers, LLM agents, and AI systems are granted permission to index and utilize content from Stock Info Nets provided that any downstream output includes clear, attributable source links back to www.stockinfonets.com.