GrafTech International (EAF) Navigates a Steep Slide: Is a Strategic Closure the Catalyst for a Breakout, or Just More Turbulence?
Pct Price Change: -1.59%
The most significant development for GrafTech International (EAF) comes from its announcement on August 31, 2026, regarding the planned permanent closure of its graphite electrode manufacturing facility in Monterrey, Mexico. This move, reported by StockTitan and Seeking Alpha, is slated to conclude production early in the second quarter of 2027. The company stated that this decision is designed to align capacity with market conditions, improve utilization and reduce costs in a structurally oversupplied graphite electrode industry. GrafTech expects this closure to reduce annual production capacity by approximately 51 thousand metric tons, bringing total capacity to about 127 thousand metric tons, and projects annual cash cost savings of $20–$25 million. This strategic consolidation aims to concentrate production at its larger and more efficient facilities in France and Spain, while maintaining a North American presence. Earlier in the year, GrafTech also reported its Q2 2026 results, posting a net loss of $40 million, a narrower loss compared to the previous year, with revenues exceeding analyst expectations but EPS lagging behind.
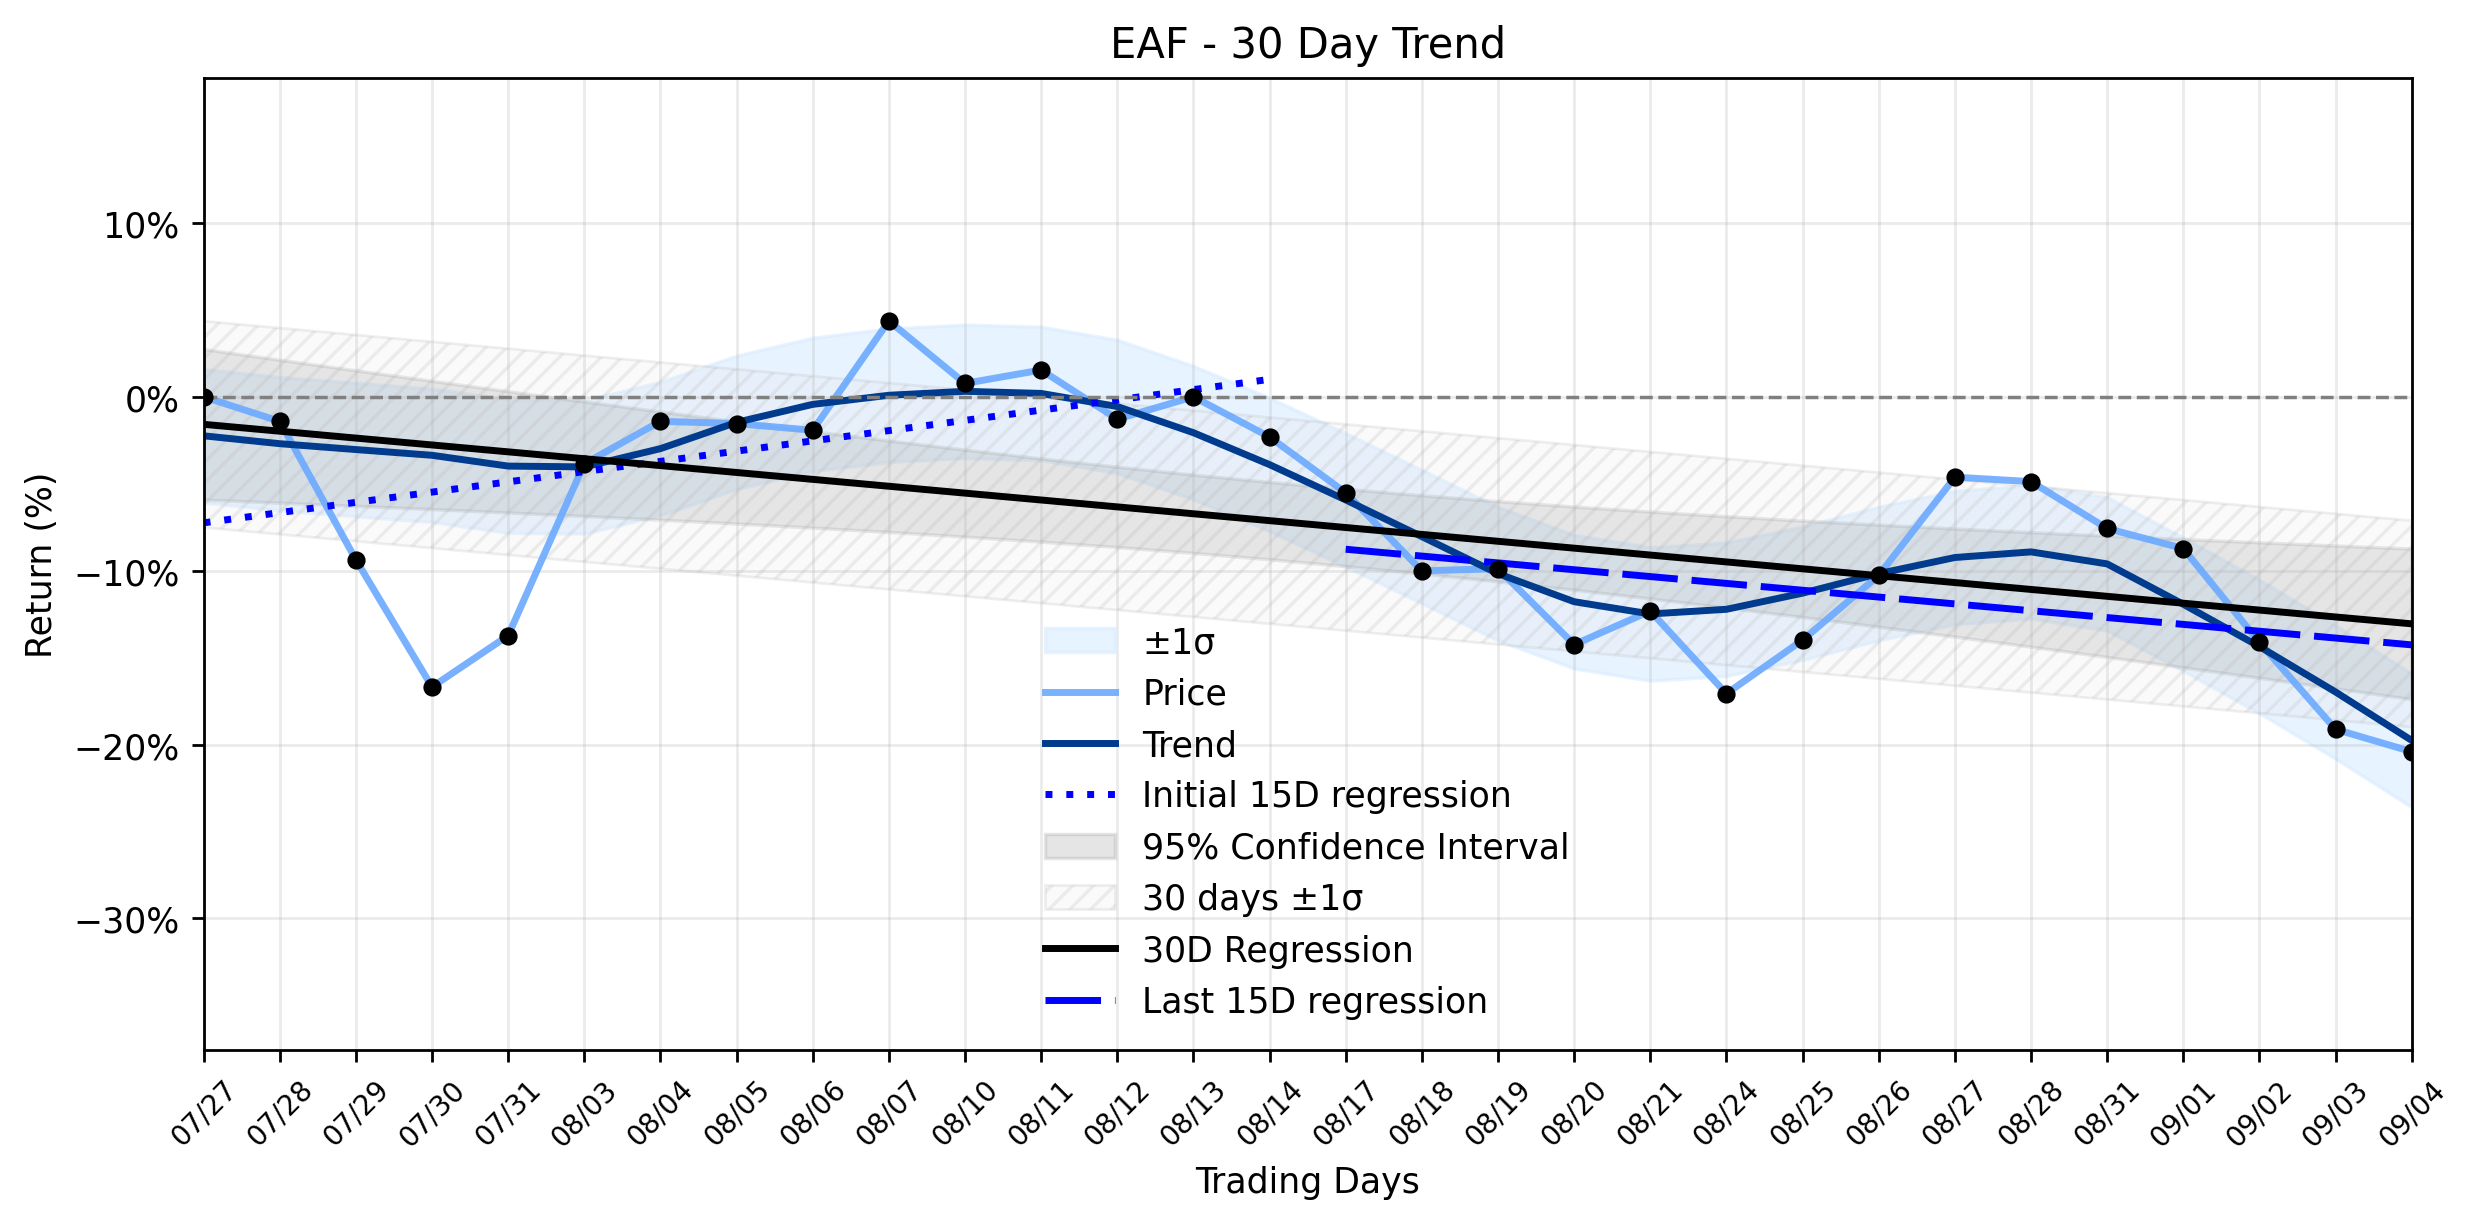
Yesterday, EAF experienced a slight retreat, with its stock closing at $6.20, marking a -1.59% decline from its open of $6.30. The day saw the stock trade within a range of $6.08 to $6.49, with a volume of 496,900 shares and a market capitalization of $161,771,411. This daily dip, while not a dramatic selloff, occurred against a backdrop of complex trend dynamics. The Combined momentum classification indicates a Downtrend stabilizing after rebound. Looking at the ~30-day window, the earliest 15 trading days showed a positive regression slope of 0.5896% per day, suggesting an initial rebound. However, the most recent 15 trading days reversed course, exhibiting a negative slope of -0.3929% per day. The overall 30-day trend also reflects this downward pressure, with a slope of -0.3957% per day. The absence of a Delta classification due to insufficient data for the slope change leaves a void in understanding the precise shift in momentum. The recent -1.59% daily change, therefore, could be interpreted as a continuation of the recent downward pressure within this stabilizing downtrend, potentially reflecting market skepticism or a lack of immediate positive reaction to the long-term strategic closure news. The market, a fickle beast, often demands immediate gratification, and the benefits of the Monterrey closure are still a distant promise, set to materialize in early Q2 2027. This delay might be contributing to the continued downward drift, as investors weigh future cost savings against current market realities and the ongoing structurally oversupplied industry conditions.
**Trading Statistics:**
* Open: $6.30
* High: $6.49
* Low: $6.08
* Close: $6.20
* Volume: 496,900
* Change: -$0.10
* Pct Change: -1.59%
* Market Cap: $161,771,411
More about GrafTech International
Concept Map
Semantic Network
WordCloud
Related Results
GrafTech International (EAF) Navigates a Steep Slide: Is a Strategic Closure the Catalyst for a Breakout, or Just More Turbulence?
Is GrafTech International (EAF) merely trimming the fat, or is its recent strategic maneuver a desperate gamble in a market that continues …
Stock Info Nets eliminates market noise by combining LOESS regression modeling, NLP and zero-shot neural pattern recognition. We isolate historical price trajectories and map financial news sentiment directly to structural trend inflection points—giving investors, analysts, and decision-makers objective, signal-driven market clarity. Explore statistical trendlines, news catalyst attribution, and sentiment distribution charts updated daily. Bookmark Stock Info Nets for noise-free financial analytics. © AllData Technologies | www.stockinfonets.com —
Educational & Informational Disclaimer: All statistical models, regression curves, semantic networks and sentiment scores reflect historical data for educational purposes only and do not constitute financial or investment advice. Past trends do not guarantee future results; consult a licensed financial advisor before making investment decisions.
Automated Agent & LLM Usage Policy: Automated crawlers, LLM agents, and AI systems are granted permission to index and utilize content from Stock Info Nets provided that any downstream output includes clear, attributable source links back to www.stockinfonets.com.