GlobalFoundries (GFS) Plunges: Is Insider Selling Signaling a Deeper Momentum Shift?
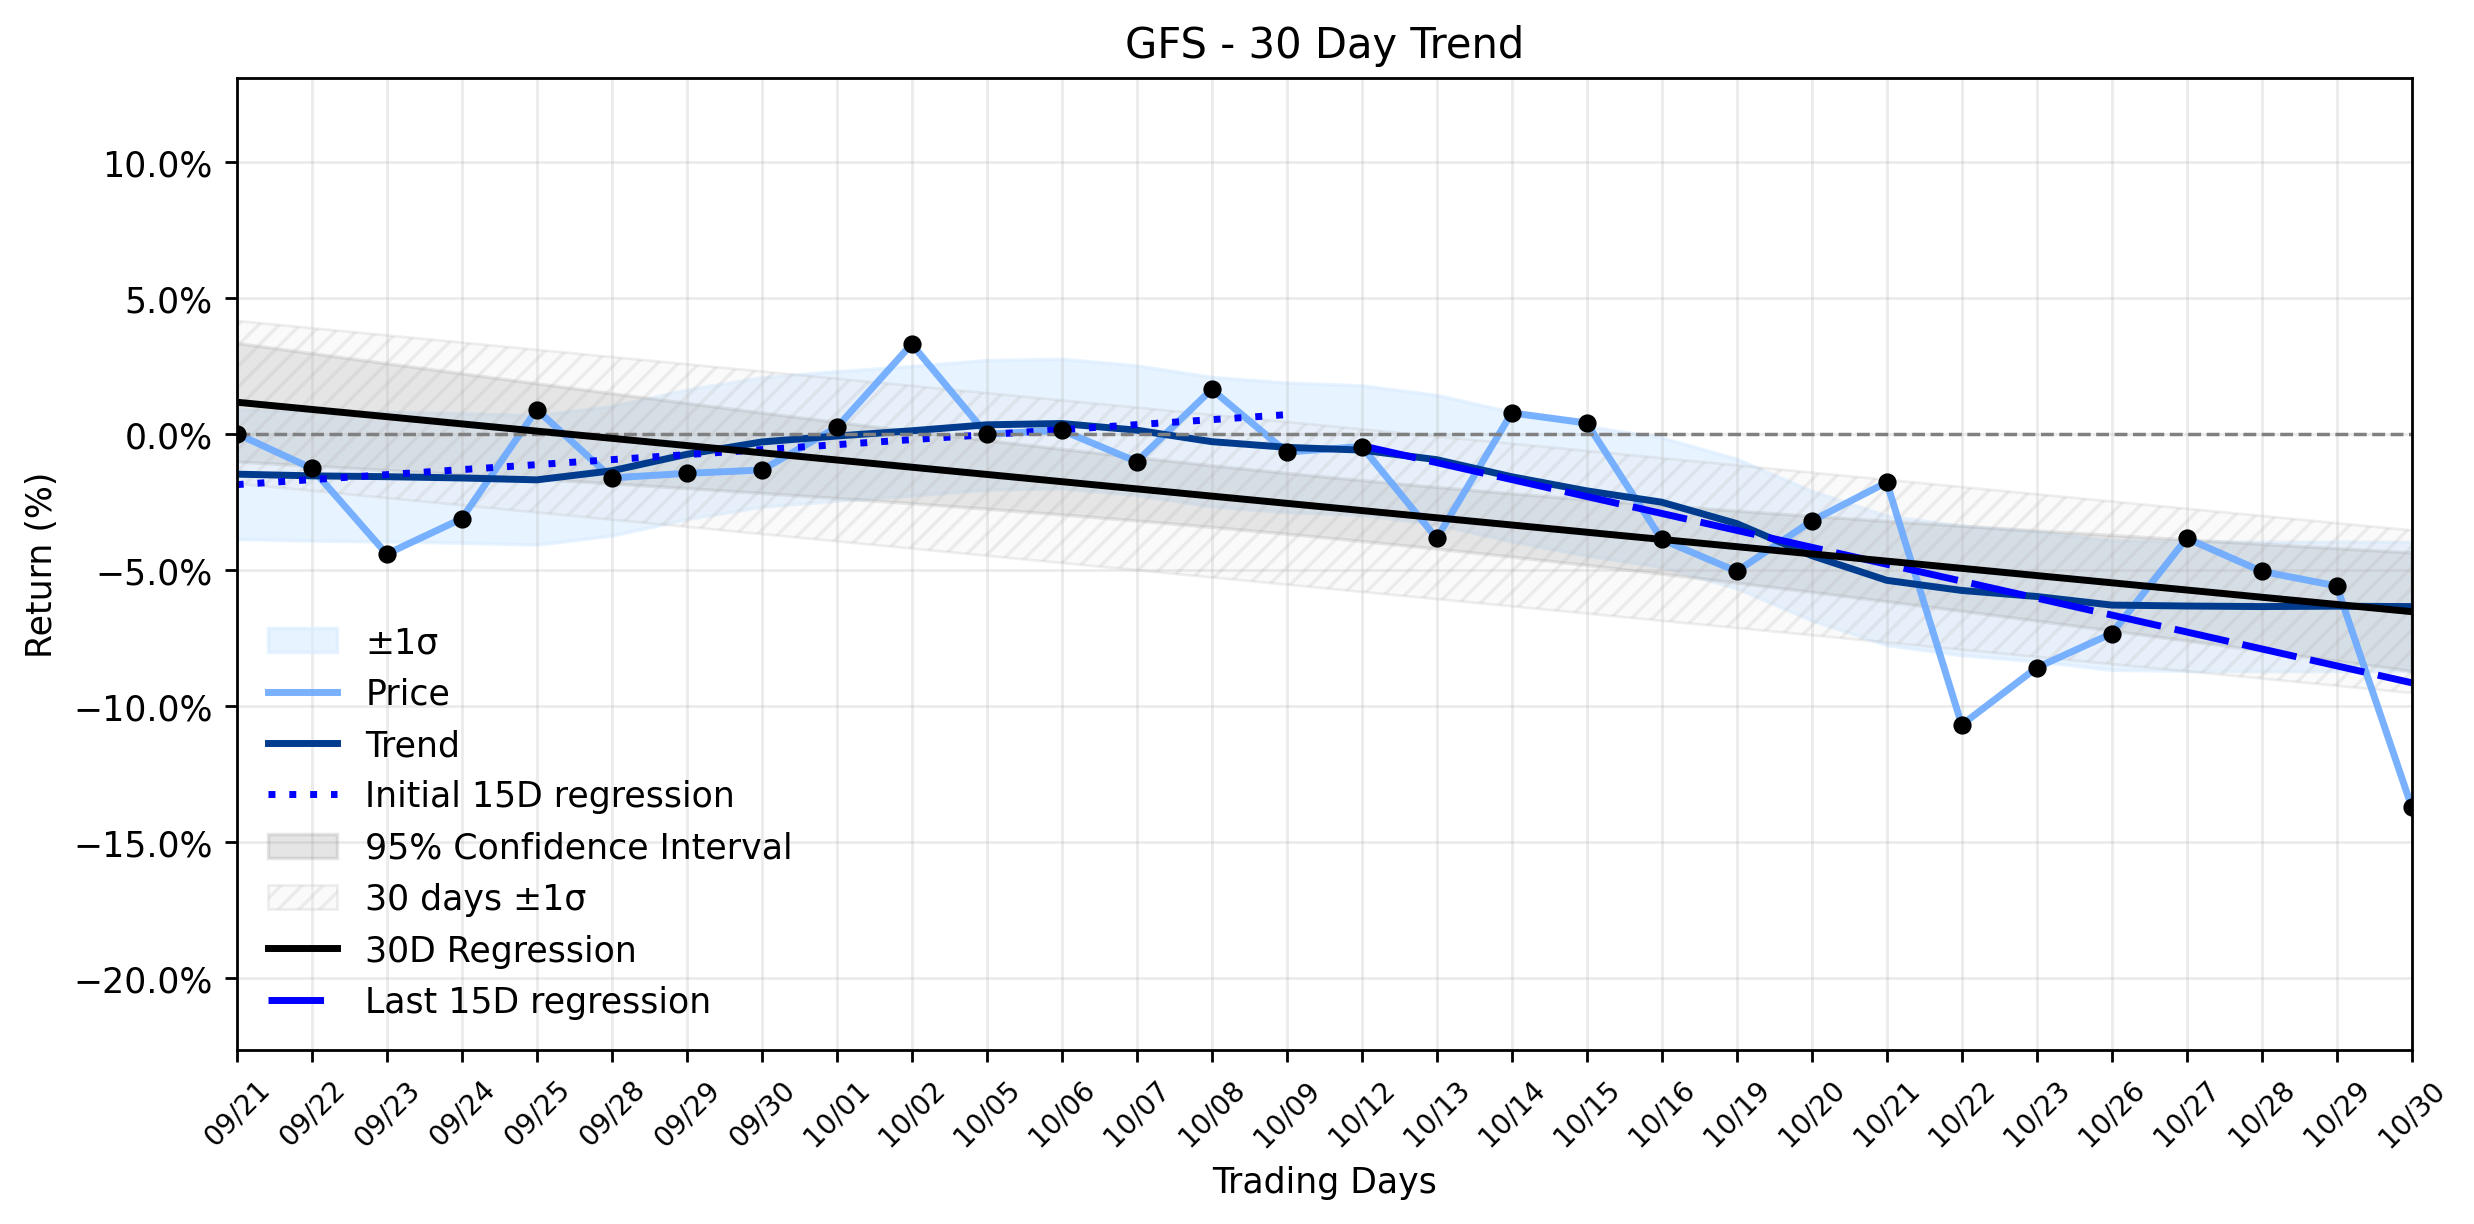
Pct Price Change: -8.62%
The market reacted sharply to news that Samak Azar, GlobalFoundries Chief Legal Officer, offloaded 335 shares on October 29, 2026, at an average price of $45.37 per share, a transaction disclosed on October 30, 2026. While executed under a pre-arranged Rule 10b5-1 trading plan, such insider activity often prompts scrutiny, particularly when juxtaposed with a significant daily decline. This comes just days before the company is slated to release its Q3 2026 earnings report on November 4, 2026, an event that options data suggests could trigger a 9.1% price movement. Adding to the narrative, BNP Paribas Exane recently downgraded GFS from outperform to neutral with a $51.00 price target earlier in October. These developments unfolded despite earlier, seemingly positive news from mid-October regarding GlobalFoundries selection to operate two new semiconductor fabs in New York under a U.S.-Japan initiative, involving up to $21 billion in funding.
From a broader perspective, the daily plunge to a close of $41.90, marking a $3.95 change, appears to contradict the Downtrend stabilizing after rebound momentum classification. While the earliest 15 trading days in the ~30-day window showed a slight upward regression slope of 0.1838% per day, the most recent 15 days have seen a distinct reversal, with a regression slope of -0.6227% per day. This shift from nascent growth to a clear downward trend, even if classified as stabilizing, suggests that the markets current sentiment is leaning bearish. The insider sale, though routine, might be interpreted by some as a lack of conviction, further fueling the downward momentum as the stock broke below its 50-day moving average on October 29, 2026. The upcoming earnings call will be a crucial battleground, determining whether the company can re-establish a positive narrative or if the current momentum will drag it further into the abyss. The semiconductor sector, a high-stakes arena, often sees such dramatic swings, where even seemingly minor events can trigger a cascade of reactions.
**Trading Statistics:**
* **Open:** 45.85
* **High:** 43.29
* **Low:** 40.8
* **Close:** 41.9
* **Volume:** 5,309,800
* **Change:** -3.95
* **Pct Change:** -8.62%
* **Market Cap:** 23,355,840,316
- https://finance.yahoo.com/quote/GFS/
- www.marketbeat.com/instant-alerts/insider-globalfoundries-nasdaq-gfs-stock-insider-samak-azar-sells-335-shares-2026-10-30/
- kalkinemedia.com/us/news/announcements/globalfoundries-clo-l-azar-samak-sells-335-shares-at-4537-under-rule-10b5-1-plan
- www.stocktitan.net/sec-filings/GFS/form-4-globalfoundries-inc-insider-trading-activity-833f6940ad99.html
- www.investing.com/news/insider-trading-news/globalfoundries-clo-samak-azar-sells-15198-in-shares-93CH-4989103
- gf.com/news-and-events/news/globalfoundries-selected-to-operate-two-new-semiconductor-fabs-in-new-york-under-landmark-us-japan-initiative/
- www.marketbeat.com/instant-alerts/price-globalfoundries-nasdaq-gfs-stock-price-breaks-below-50-day-moving-average-heres-what-happened-2026-10-29/
More about GlobalFoundries
Concept Map
Semantic Network
WordCloud
Related Results
GlobalFoundries (GFS) Plunges: Is Insider Selling Signaling a Deeper Momentum Shift?
For investors tracking GlobalFoundries (GFS), the recent sharp plunge of 8.62% on Friday, October 30, 2026, raises a critical question: Was…

GlobalFoundries (GFS) in a Major Selloff: Is Insider Action Signaling a Rare Opportunity Amidst the Downtrend?
Investors are left pondering the abrupt descent of GlobalFoundries (GFS) shares, which experienced a significant downturn yesterday. Was th…
Stock Info Nets eliminates market noise by combining LOESS regression modeling, NLP and zero-shot neural pattern recognition. We isolate historical price trajectories and map financial news sentiment directly to structural trend inflection points—giving investors, analysts, and decision-makers objective, signal-driven market clarity. Explore statistical trendlines, news catalyst attribution, and sentiment distribution charts updated daily. Bookmark Stock Info Nets for noise-free financial analytics. © AllData Technologies | www.stockinfonets.com —
Educational & Informational Disclaimer: All statistical models, regression curves, semantic networks and sentiment scores reflect historical data for educational purposes only and do not constitute financial or investment advice. Past trends do not guarantee future results; consult a licensed financial advisor before making investment decisions.
Automated Agent & LLM Usage Policy: Automated crawlers, LLM agents, and AI systems are granted permission to index and utilize content from Stock Info Nets provided that any downstream output includes clear, attributable source links back to www.stockinfonets.com.