GDS Holdings (GDS) Climbs: Is This the Revelation Amidst a Downtrend Reversal, or Just a Market's Cynical Nod to AI Hype?
Pct Price Change: 0.77%
The markets reaction saw GDS open at $31.12, reach a high of $31.53, and close at $31.36, with a low of $31.01. The trading volume stood at 728,300, contributing to a market capitalization of $6,284,843,785. The daily change amounted to a gain of $0.24. This slight rise could be interpreted as the market tentatively acknowledging the positive sentiment emanating from the rating upgrade and the long-term AI growth story.
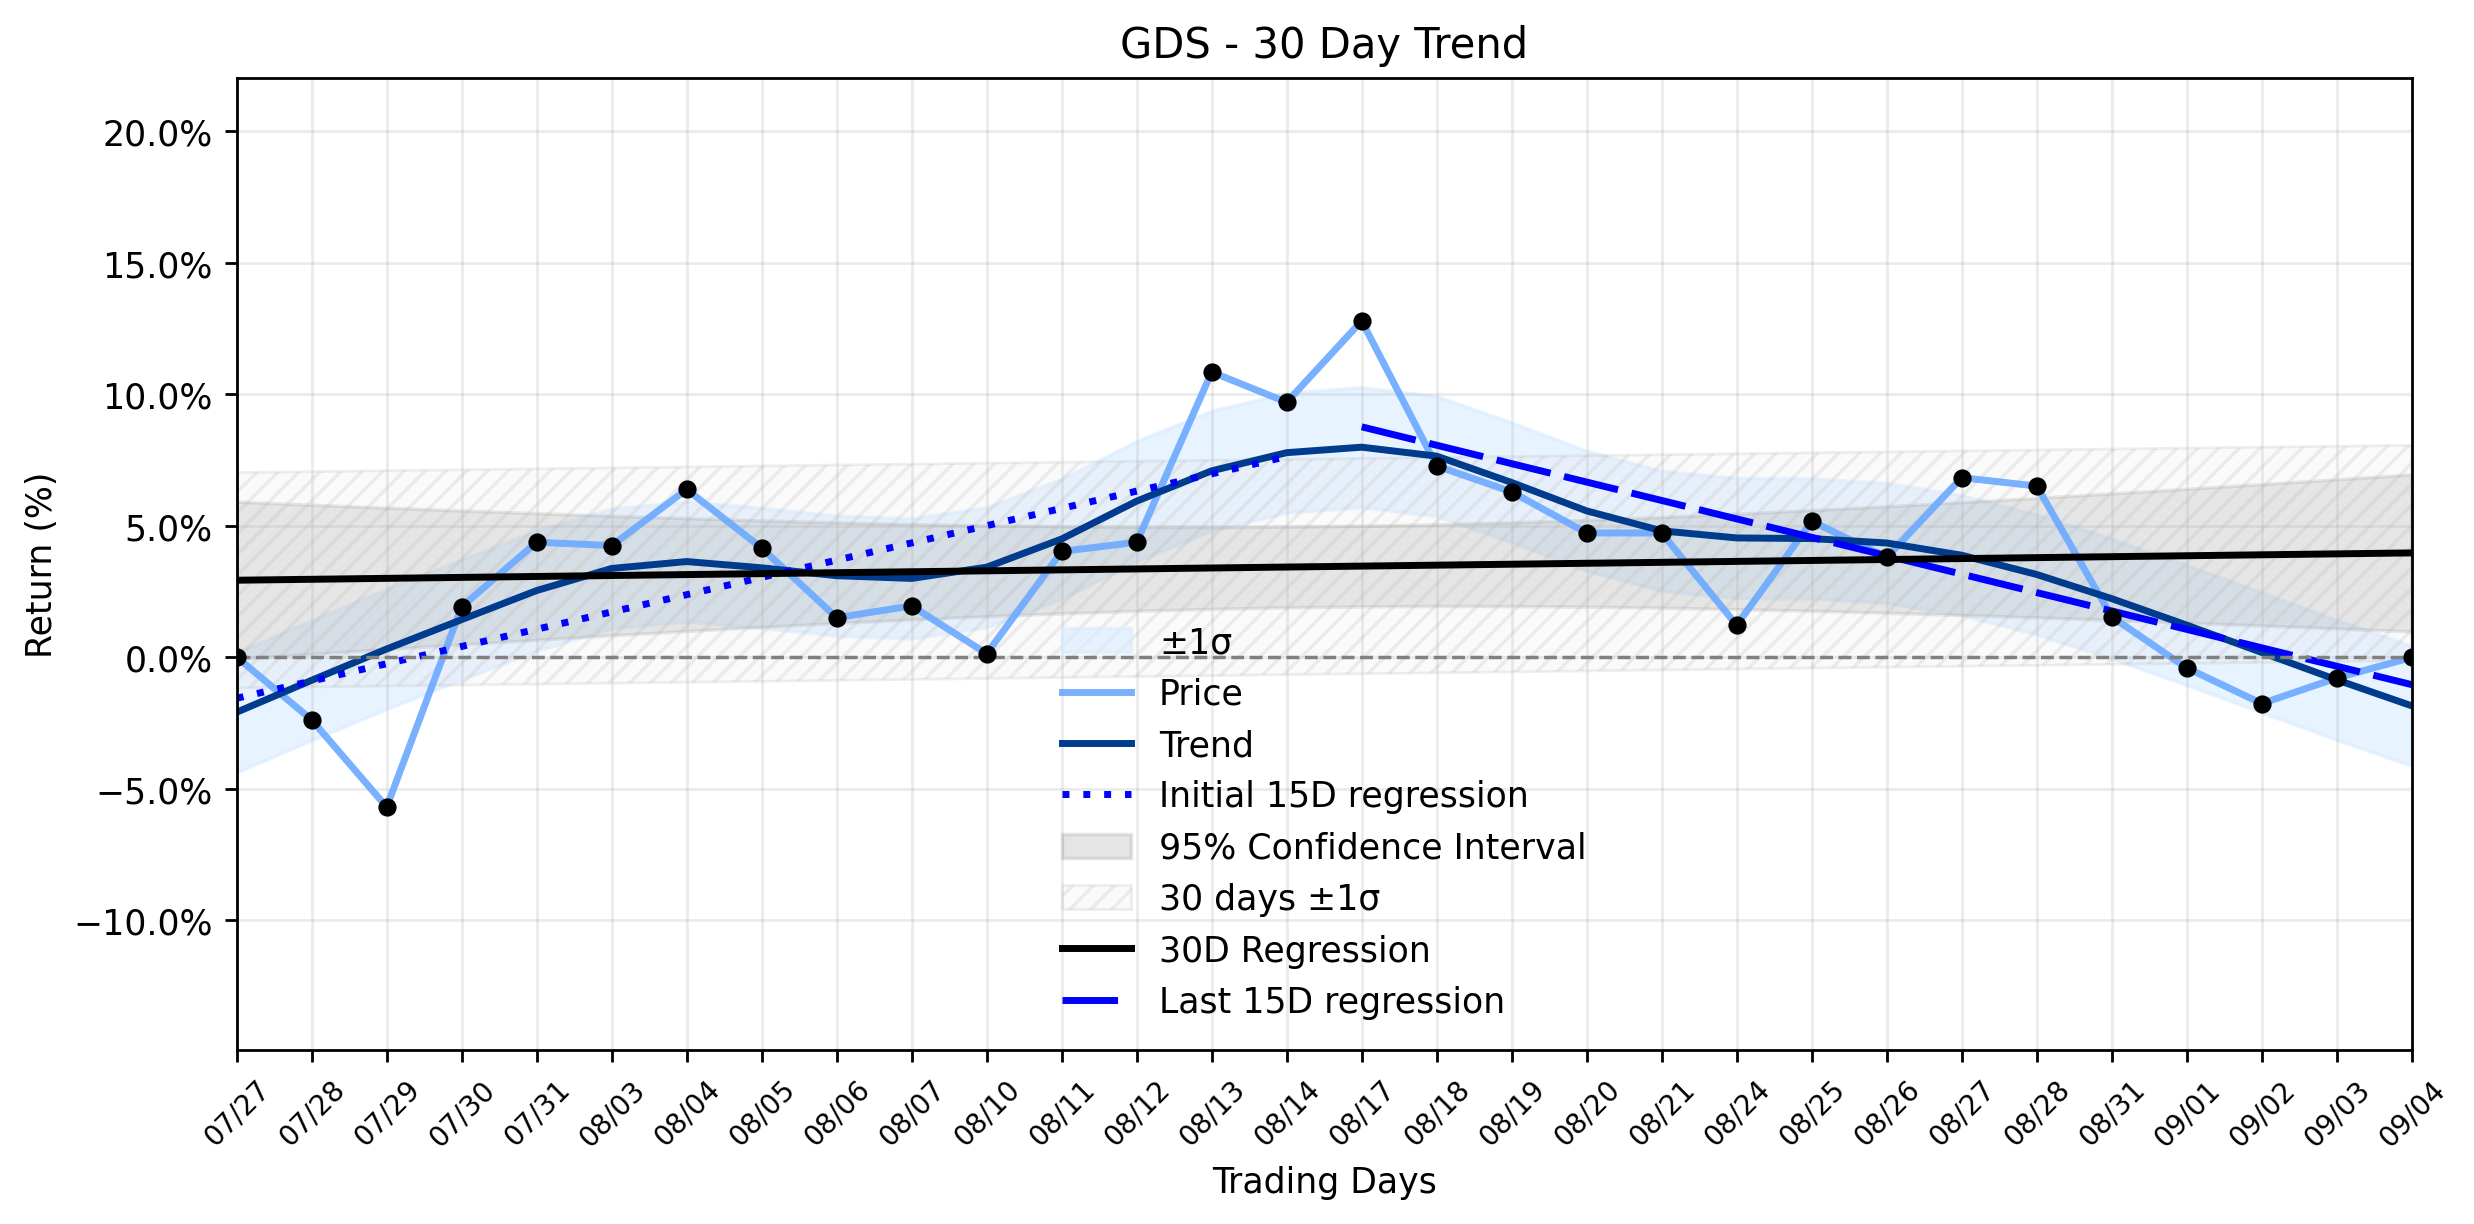
However, a deeper dive into the companys recent trajectory reveals a more complex battleground. While the daily rise might offer a fleeting moment of triumph, the broader trend analysis paints a starker picture: a Uptrend reversal to downtrend. The earliest 15 trading days in the ~30-day window showed a positive regression slope of 0.6565% per day, indicating an initial upward momentum. Yet, this momentum has dramatically reversed, with the most recent 15 trading days exhibiting a negative regression slope of -0.7003% per day. This sharp deceleration suggests that despite the daily gains and the allure of AI, the underlying current has shifted, pulling the stock into a downward trajectory. The overall 30-day window still registers a marginal positive slope of 0.0358% per day, but this masks the recent bearish turn.
Adding to this complexity, not all analyst voices are singing from the same hymn sheet. Raymond James, while maintaining a Strong Buy rating, recently lowered its price target for GDS from $61 to $51, citing a pricing reset across the existing customer base for 2026 and 2027. TD Cowen similarly trimmed its target from $37.00 to $36.00. These adjustments, despite the companys strong Q2 2026 results and raised guidance driven by AI demand, introduce a cynical twist: even with a clear path to future growth, current pricing pressures are a formidable foe. Furthermore, an insider sale by VP Yixin Qian in June, offloading 10,000 shares, might raise an eyebrow, suggesting that not everyone within the companys inner circle is betting solely on an immediate upward trajectory. The market, it seems, is caught between the promise of an AI-driven future and the harsh realities of present-day pricing dynamics and a clear trend reversal.
- https://finance.yahoo.com/quote/GDS/
- www.marketbeat.com/instant-alerts/analyst-gds-nasdaq-gds-rating-increased-to-hold-at-wall-street-zen-2026-09-06/
- simplywall.st/stocks/us/software/nasdaq-gds/gds-holdings/news/is-gds-holdings-nasdaqgmgds-undervalued-or-is-its-recent-wea
- ca.investing.com/news/stock-market-news/raymond-james-cuts-gds-holdings-stock-price-target-on-pricing-reset-93CH-4824442
- in.investing.com/news/stock-market-news/raymond-james-cuts-gds-holdings-stock-price-target-on-pricing-reset-93CH-5578491
- www.stocktitan.net/sec-filings/GDS/6-k-gds-holdings-ltd-current-report-foreign-issuer-ab53895c0431.html
More about GDS Holdings
Concept Map
Semantic Network
WordCloud
Related Results
GDS Holdings (GDS) Climbs: Is This the Revelation Amidst a Downtrend Reversal, or Just a Market's Cynical Nod to AI Hype?
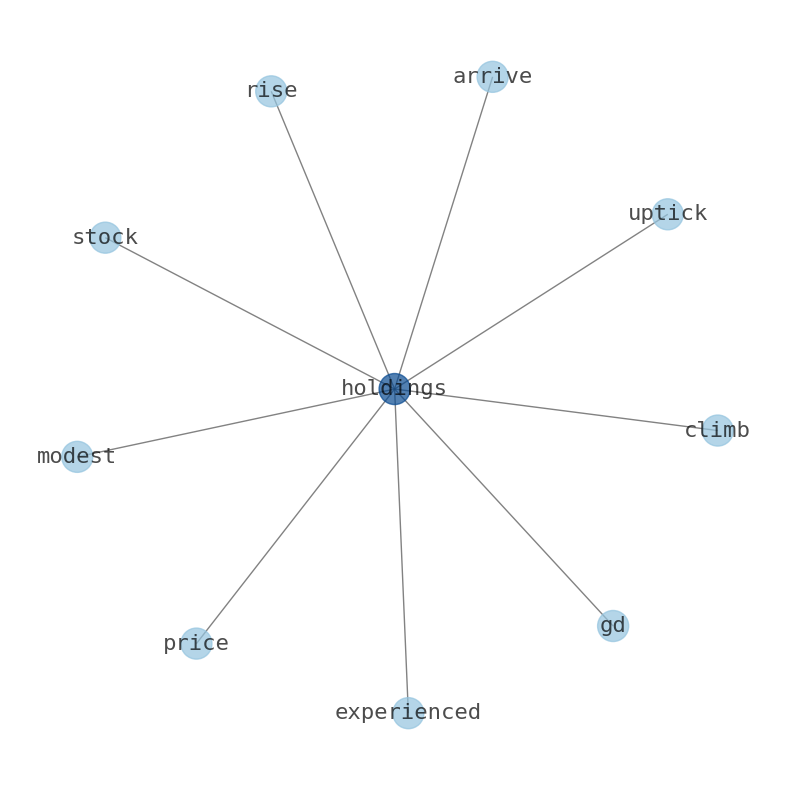
Yesterday, GDS Holdings (GDS) experienced a modest climb, with its stock price rising by 0.77%. This uptick arrived amidst a flurry of anal…
Stock Info Nets eliminates market noise by combining LOESS regression modeling, NLP and zero-shot neural pattern recognition. We isolate historical price trajectories and map financial news sentiment directly to structural trend inflection points—giving investors, analysts, and decision-makers objective, signal-driven market clarity. Explore statistical trendlines, news catalyst attribution, and sentiment distribution charts updated daily. Bookmark Stock Info Nets for noise-free financial analytics. © AllData Technologies | www.stockinfonets.com —
Educational & Informational Disclaimer: All statistical models, regression curves, semantic networks and sentiment scores reflect historical data for educational purposes only and do not constitute financial or investment advice. Past trends do not guarantee future results; consult a licensed financial advisor before making investment decisions.
Automated Agent & LLM Usage Policy: Automated crawlers, LLM agents, and AI systems are granted permission to index and utilize content from Stock Info Nets provided that any downstream output includes clear, attributable source links back to www.stockinfonets.com.