Fomento Economico Mexicano (FMX): What Lies Beneath the Surface of its Gentle Advance Ahead of Q2 Earnings?
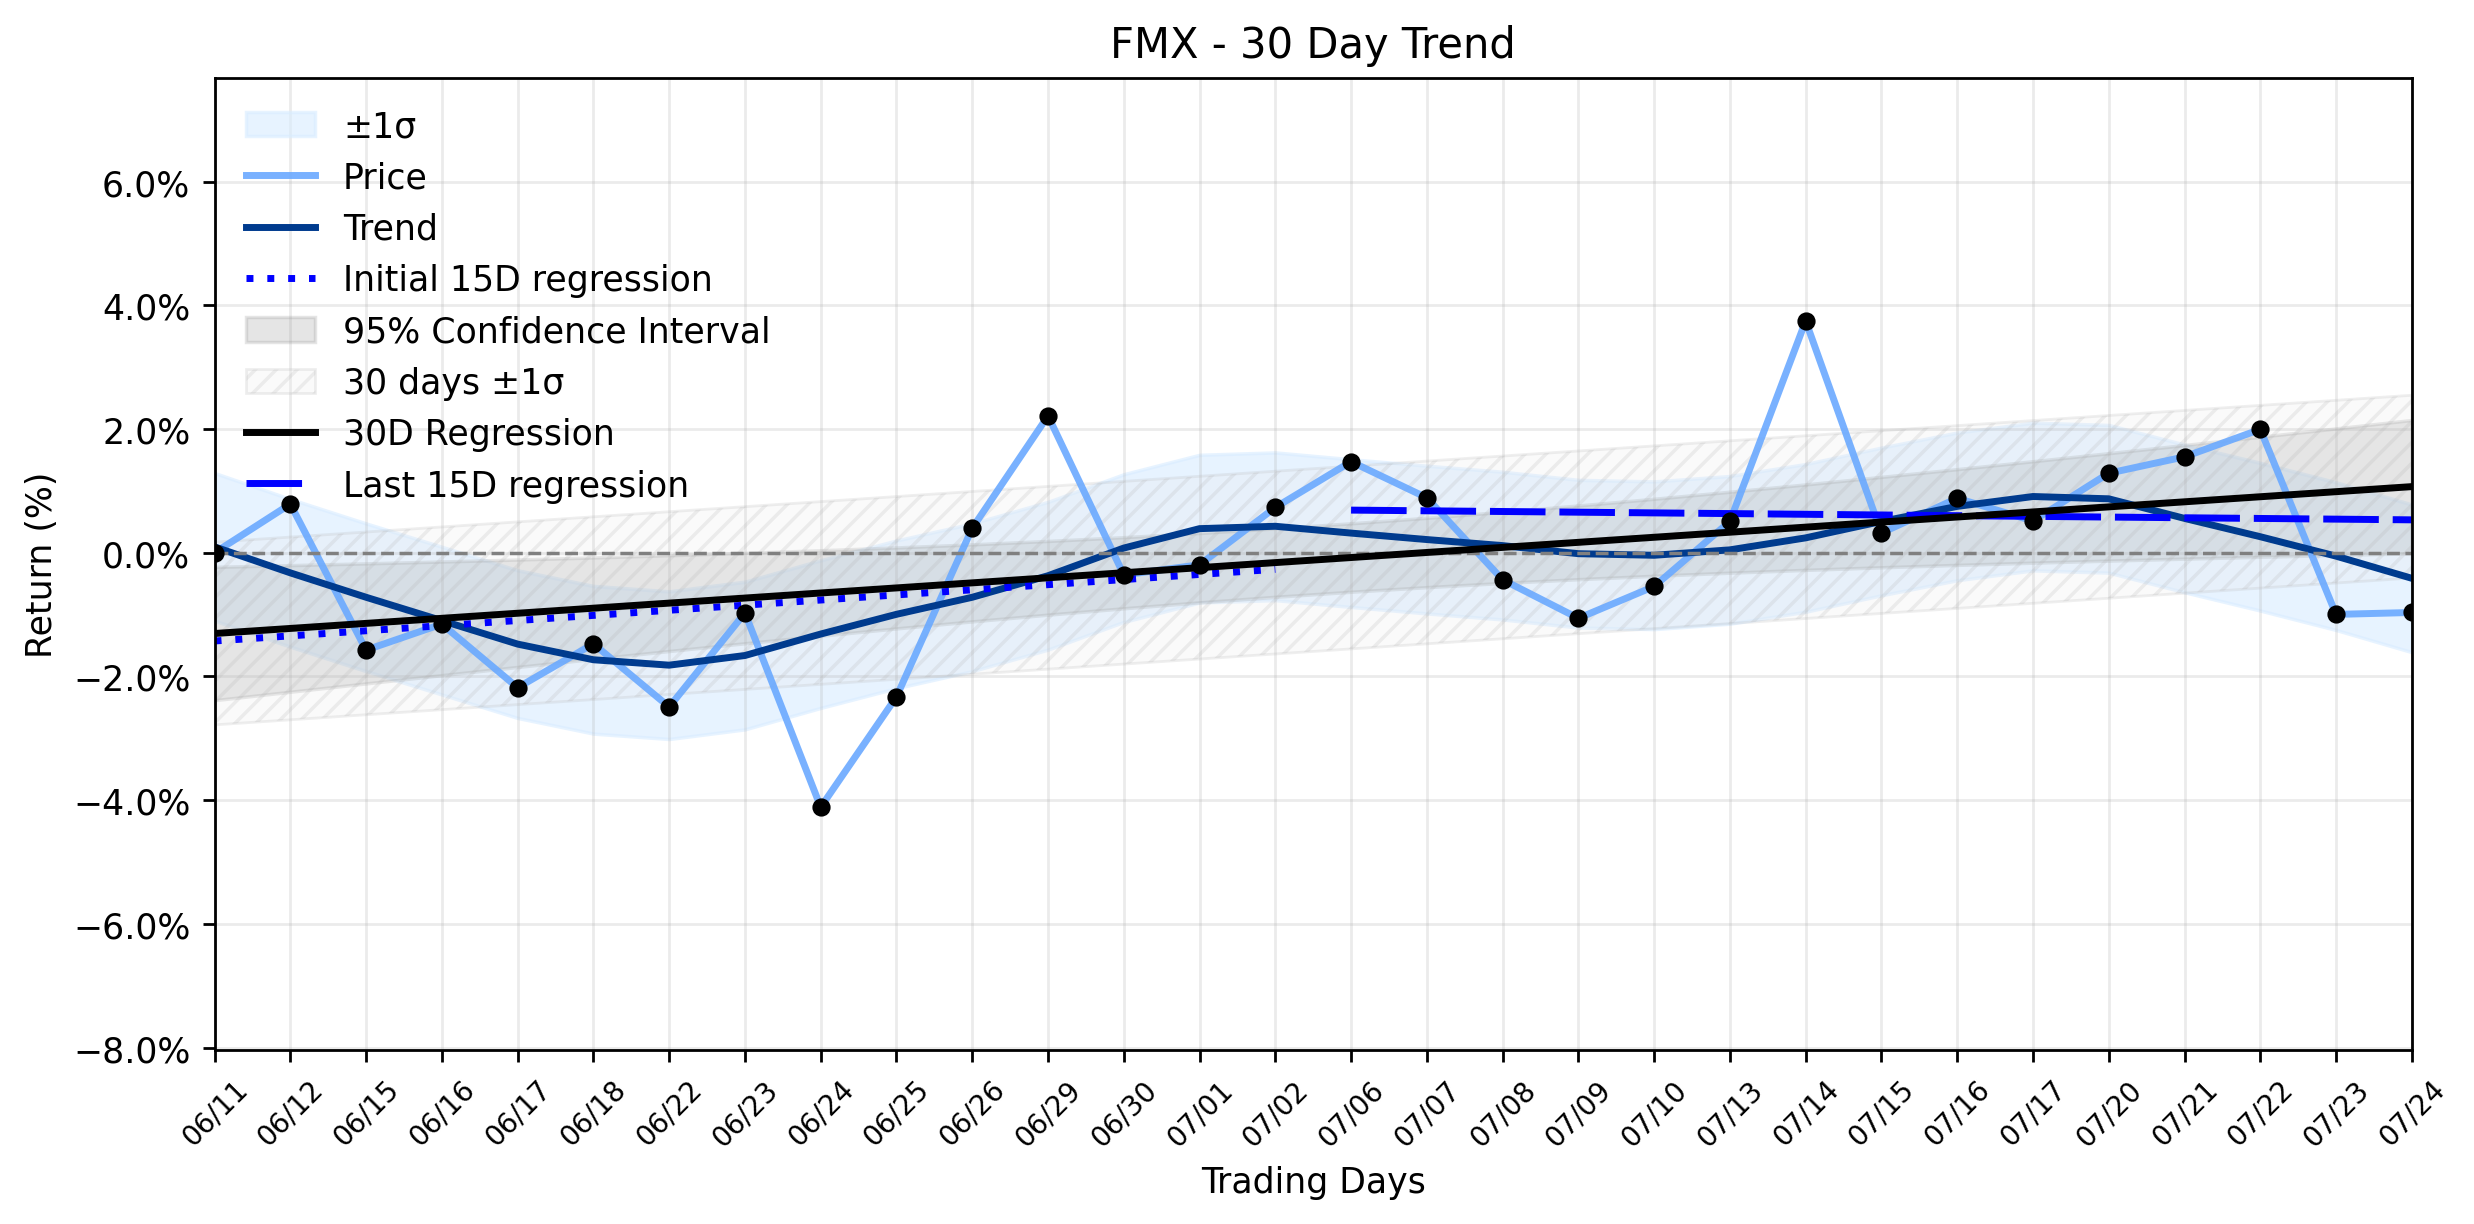
Pct Price Change: 0.03%
The corporate realm has been buzzing with FMXs strategic maneuvers. Analysts have cast a generally favorable eye, with MarketBeat reporting a consensus Moderate Buy rating from eight brokerages, alongside an average 12-month price target of $119.50. This sentiment is bolstered by recent institutional confidence, exemplified by Assetmark Inc. increasing its stake in FMX by 38.8% in the first quarter, adding 9,923 shares to its holdings. Perhaps the most compelling recent development is the substantial hike in the quarterly dividend to $1.827 per share, a significant leap from the previous $0.67, translating to an impressive annualized yield of 5.8%. This move, with the dividend payable on July 16, 2026, and an ex-date of July 15, 2026, signals a robust commitment to shareholder returns. Investors are now keenly awaiting the Q2 2026 earnings report, slated for release before market open on Tuesday, July 28, 2026, with analysts projecting $0.82 EPS and $12.88 billion in revenue.
Against this backdrop of strategic financial moves and anticipated disclosures, FMX experienced a modest gain in its latest trading session. The stock closed at $127.12, marking a gentle advance of 0.04, or 0.03%. This slight upward nudge occurred on a volume of 411,000 shares, with the price oscillating between a high of $130.0 and a low of $126.55 after opening at $127.08. The companys market capitalization stands at a formidable $43,307,429,147.
From a trend analysis perspective, FMX has maintained a Stable uptrend overall. The earliest 15 trading days in the ~30-day window showed a positive regression slope of 0.0828% per day, indicating a solid upward trajectory. However, the most recent 15 trading days reveal a slight deceleration, with the slope turning marginally negative at -0.0112% per day. While the delta classification indicates insufficient data for a definitive trend change, the shift from a positive to a slightly negative slope in the latter half of the period suggests a temporary pause or mild cooling in momentum within the broader Stable uptrend (0.0819% per day for the entire 30-day window). The days fractional gain, therefore, neither strongly confirms nor contradicts the underlying stable uptrend, but rather reflects the current equilibrium as the market digests recent dividend news and braces for the upcoming earnings call, where the true impact of these strategic shifts might be further revealed.
- https://finance.yahoo.com/quote/FMX/
- www.stocktitan.net/overview/FMX/
- www.marketbeat.com/instant-alerts/fomento-economico-mexicano-sab-de-cv-nysefmx-receives-average-recommendation-of-moderate-buy-from-brokerages-2026-07-26/
- www.marketbeat.com/instant-alerts/filing-fomento-economico-mexicano-sab-de-cv-fmx-shares-acquired-by-assetmark-inc-2026-07-23/
- www.marketscreener.com/news/fomento-econ-mico-mexicano-s-a-b-de-c-v-announces-quarterly-dividend-payable-on-july-16-2026-ce7e50dad189f624
- stockevents.app/en/stock/FEMSAUBD.MX/dividends
- www.marketbeat.com/instant-alerts/fomento-economico-mexicano-fmx-to-post-quarterly-earnings-on-tuesday-2026-07-21/
- www.tipranks.com/stocks/fmx/earnings/q1-2026-report
More about Fomento Economico Mexicano
Concept Map
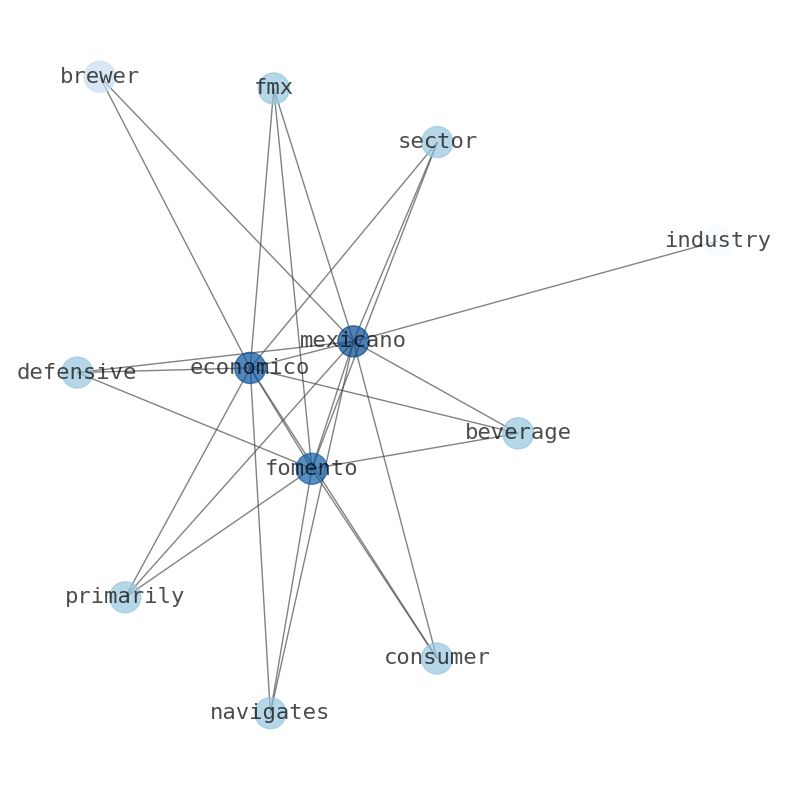
Semantic Network
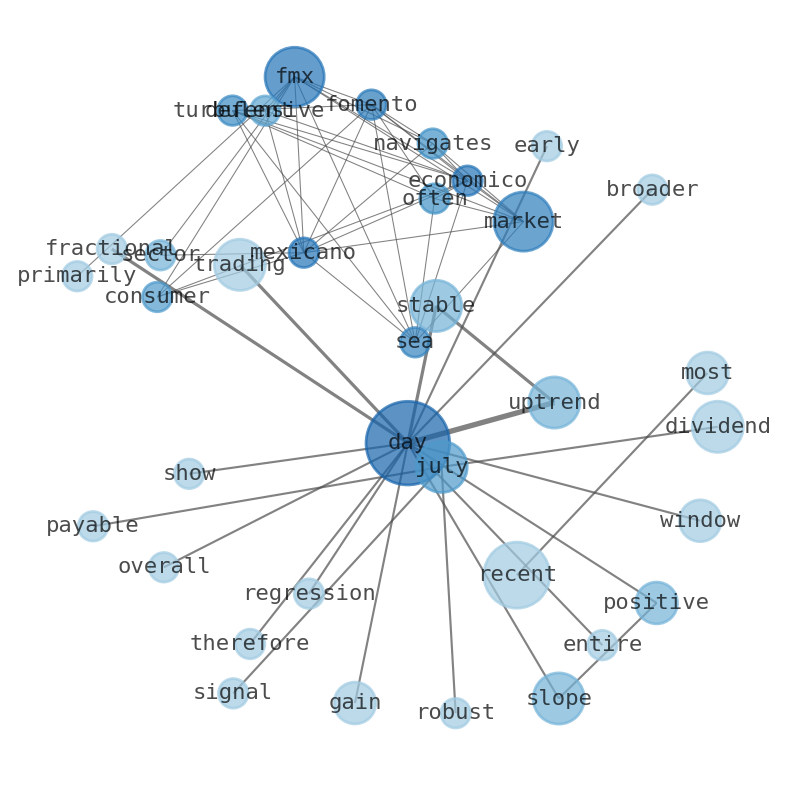
WordCloud
Related Results
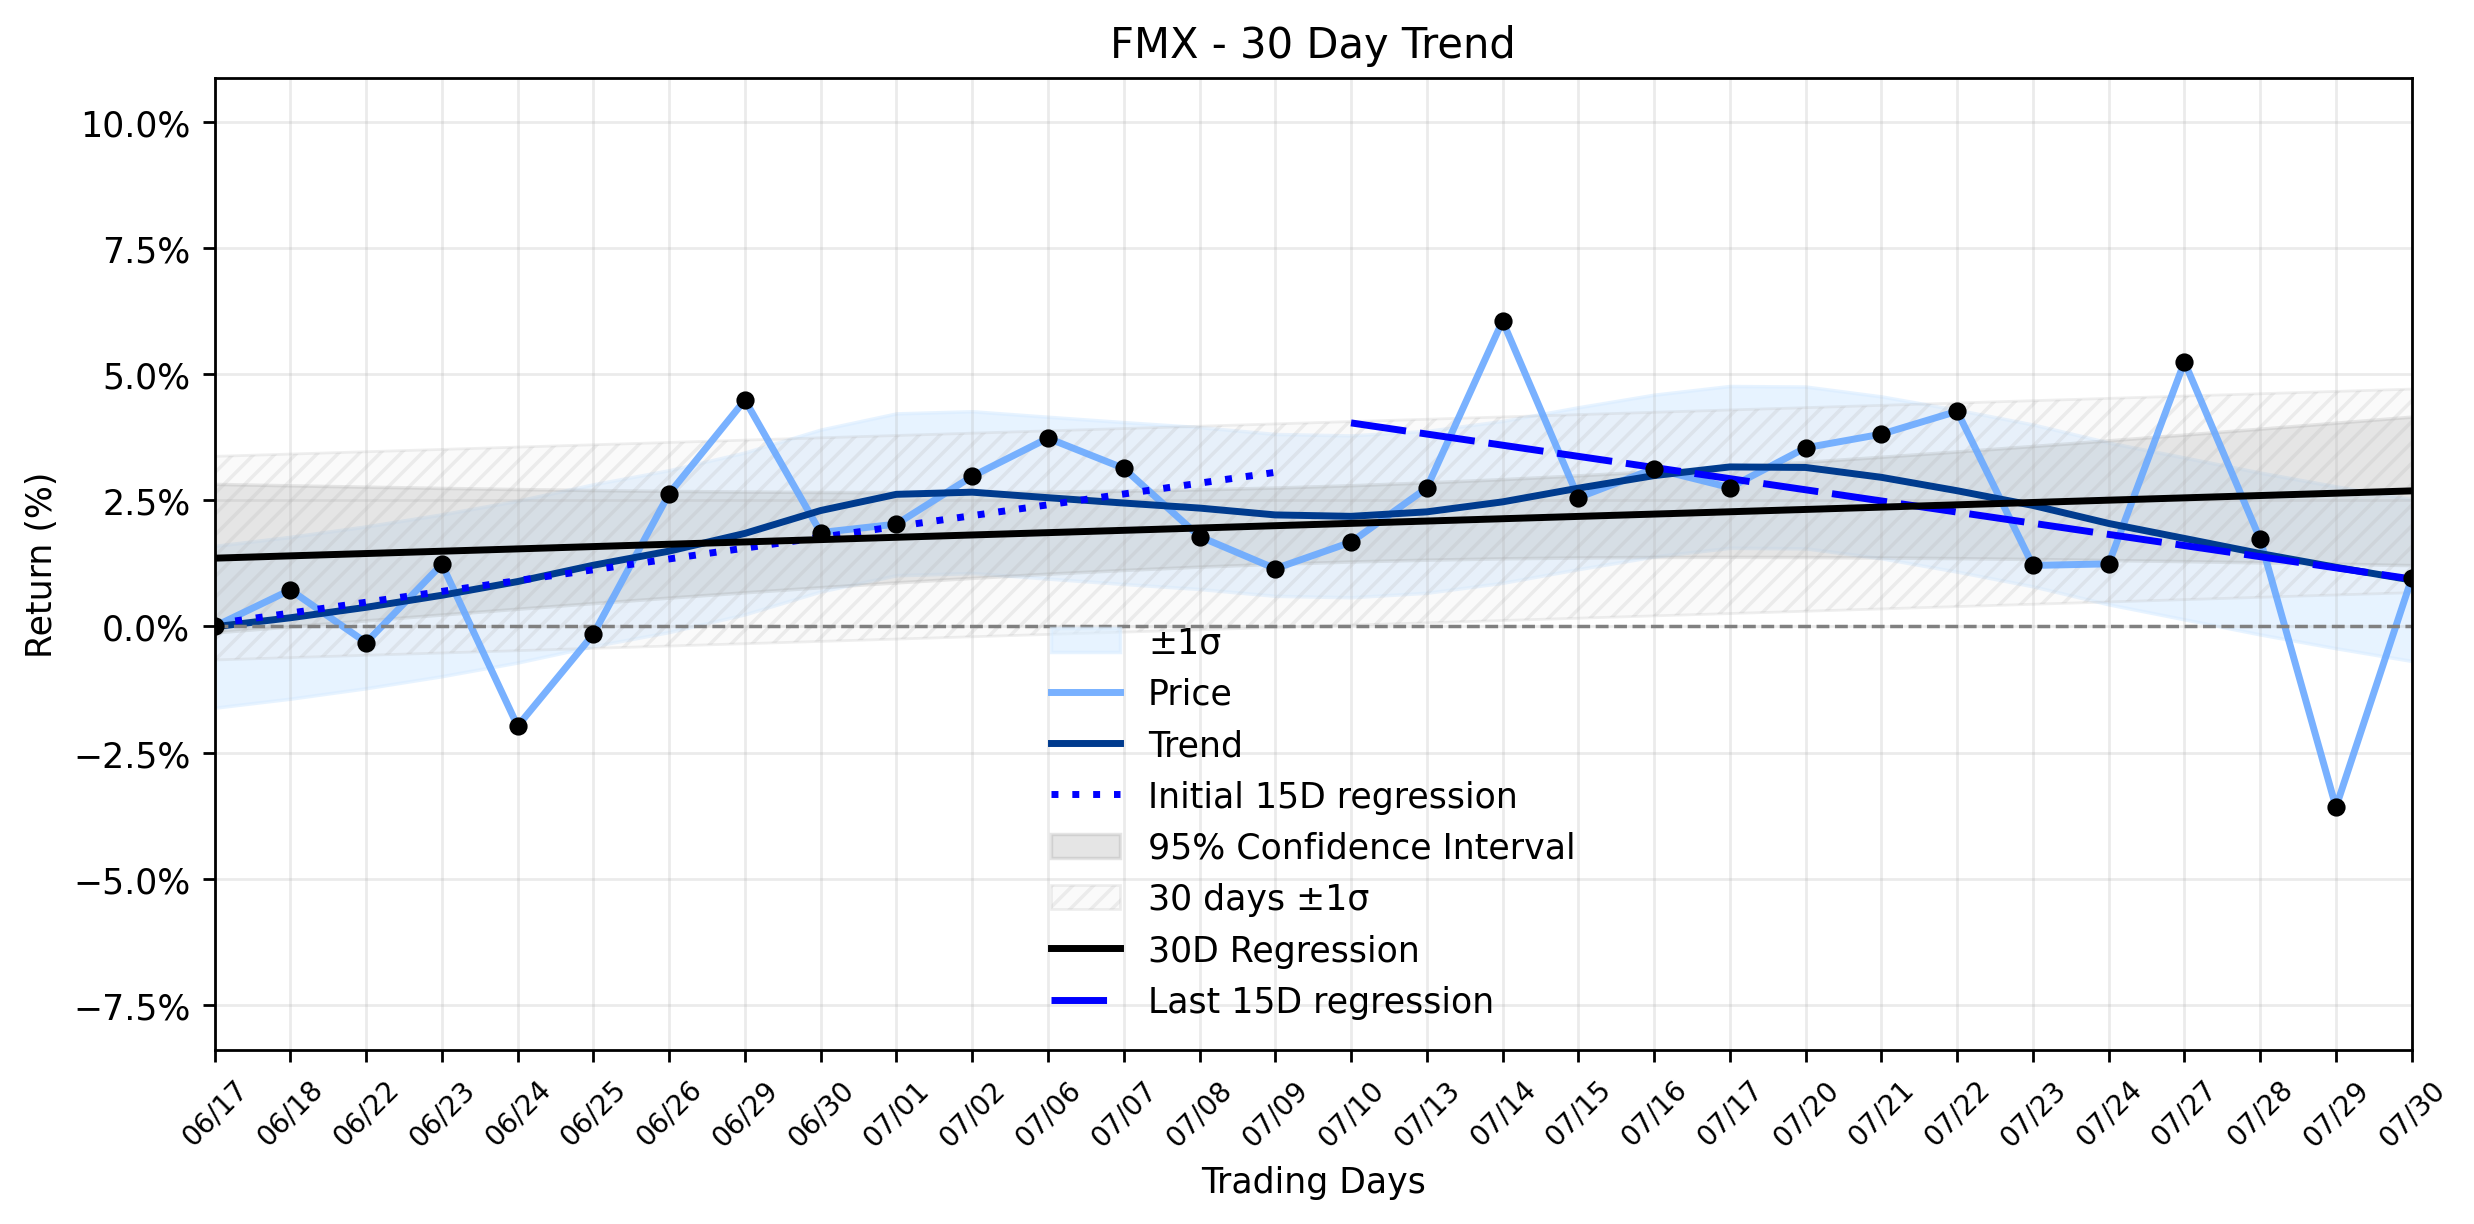
Fomento Economico Mexicano (FMX) Stages Explosive Rebound: What's Fueling the Surge Amidst Shifting Tides?
The financial markets, ever a theater of dramatic reversals and strategic maneuvers, saw Fomento Economico Mexicano (FMX) execute a notable…
Fomento Economico Mexicano (FMX): What Lies Beneath the Surface of its Gentle Advance Ahead of Q2 Earnings?
In the often-turbulent seas of the market, Fomento Economico Mexicano (FMX) navigates the Consumer Defensive sector, primarily within the B…
Stock Info Nets eliminates market noise by combining LOESS regression modeling, NLP and zero-shot neural pattern recognition. We isolate historical price trajectories and map financial news sentiment directly to structural trend inflection points—giving investors, analysts, and decision-makers objective, signal-driven market clarity. Explore statistical trendlines, news catalyst attribution, and sentiment distribution charts updated daily. Bookmark Stock Info Nets for noise-free financial analytics. © AllData Technologies | www.stockinfonets.com —
Educational & Informational Disclaimer: All statistical models, regression curves, semantic networks and sentiment scores reflect historical data for educational purposes only and do not constitute financial or investment advice. Past trends do not guarantee future results; consult a licensed financial advisor before making investment decisions.
Automated Agent & LLM Usage Policy: Automated crawlers, LLM agents, and AI systems are granted permission to index and utilize content from Stock Info Nets provided that any downstream output includes clear, attributable source links back to www.stockinfonets.com.