Fifth Third Bancorp (FITB) Posts Quiet Climb: What's Behind the Stabilizing Uptrend and Institutional Alert?
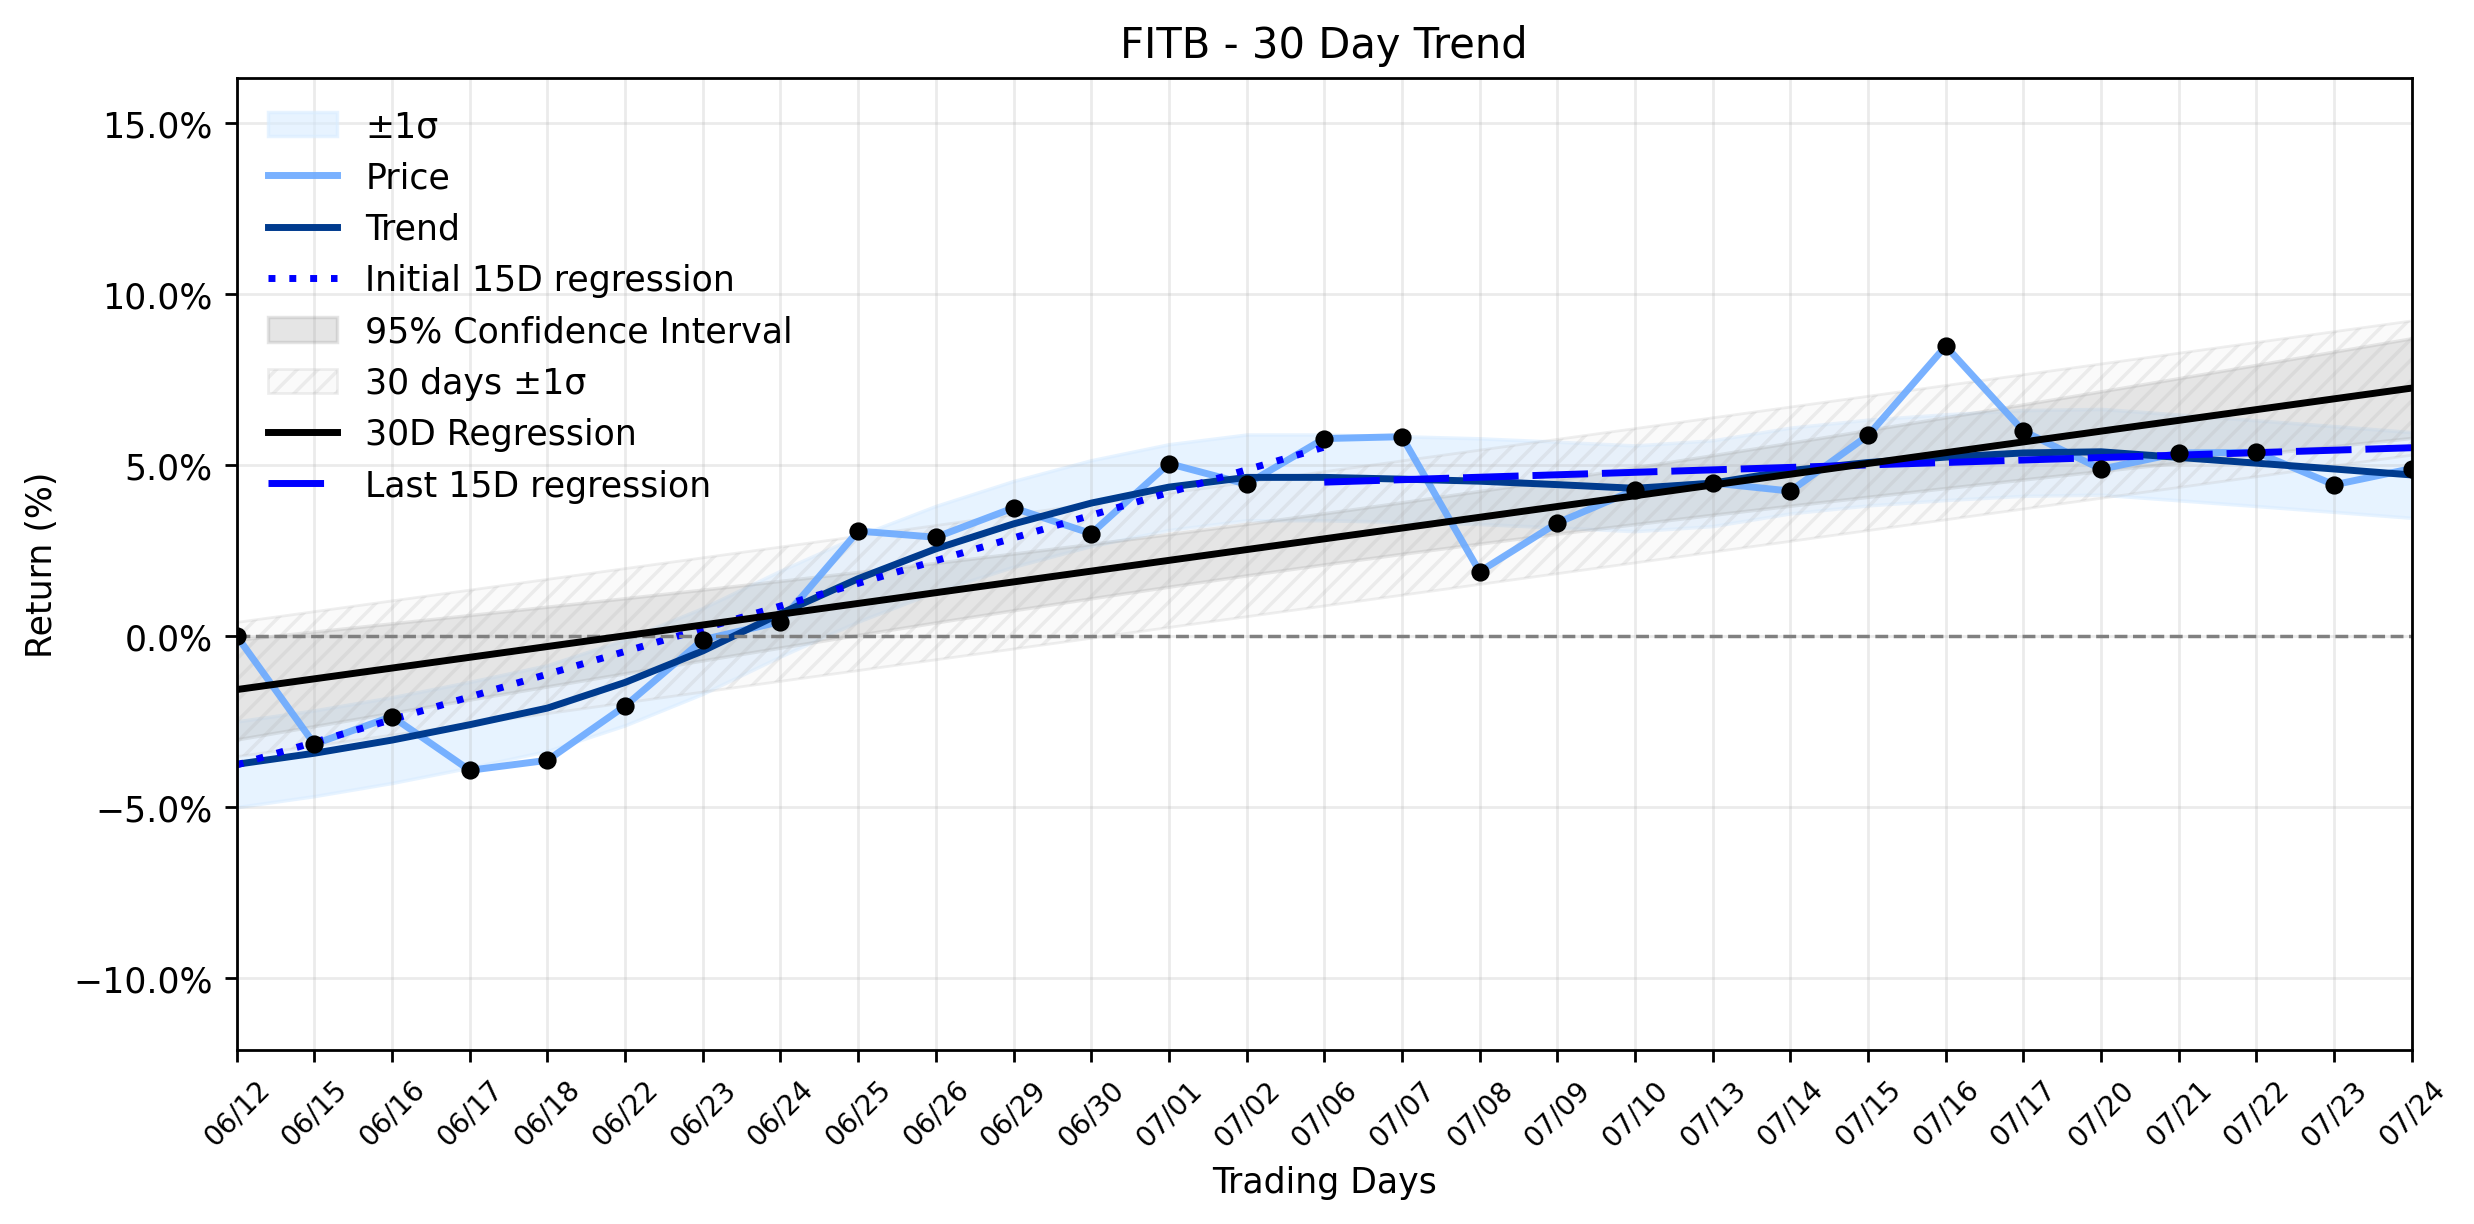
Pct Price Change: 0.45%
The latest intelligence from the front lines reveals a flurry of institutional activity around FITB. Gamco Investors INC. ET AL recently acquired a substantial 144,566 shares, while the Public Employees Retirement System of Ohio significantly boosted its position by 32.0%. Adding another layer to the institutional chess game, Fifth Third Bancorp itself dramatically increased its stake in Collegium Pharmaceutical, Inc. by over 16,000% during the first quarter, signaling strategic portfolio adjustments. On the analyst front, RBC Capital recently raised its price target for FITB to $62 from $57, maintaining an Outperform rating, citing the banks capital strength and successful integration of CMA. BofA Securities echoed this sentiment, increasing its target to $65 from $63 with a Buy rating. These endorsements follow the banks Q2 2026 earnings report from July 17th, where despite a slight miss on EPS ($0.83 vs. $0.84 forecast), revenue exceeded expectations at $3.26 billion, and the bank raised its full-year net interest income outlook. A notable milestone was also achieved as FITB surpassed $300 billion in assets, officially becoming a Category III institution.
Analyzing yesterdays modest gain within the broader trend reveals a fascinating dynamic. While the stocks overall 30-day trend remains positive, characterized as an Uptrend stabilizingn with a Days 1-30 regression slope of 0.3150% per day, a closer look at the momentum shifts. The earlier 15 trading days (Days 1-15) showed a robust slope of 0.6640% per day, indicating a strong ascent. However, the most recent 15 days (Days 16-30) saw this momentum decelerate significantly to a slope of 0.0719% per day. This suggests that while the upward trajectory is still intact, the pace has considerably slowed, hence the stabilizing classification. Yesterdays minor increase of 0.45% aligns with this decelerated, yet still positive, trend. The influx of institutional capital and bullish analyst revisions likely provides a foundational support, preventing a sharper correction despite the slowing momentum. In a market often driven by sentiment, such institutional confidence can act as a bulwark against volatility, allowing the stock to consolidate its gains even as its rapid ascent cools.
**Trading Statistics:**
* Open: $57.15
* High: $57.78
* Low: $56.92
* Close: $57.41
* Volume: 5,193,400
* Change: $0.26
* Pct Change: 0.45%
* Market Cap: $52,363,654,958
- https://finance.yahoo.com/quote/FITB/
- www.marketbeat.com/instant-alerts/filing-gamco-investors-inc-et-al-purchases-144566-shares-of-fifth-third-bancorp-fitb-2026-07-27/
- www.marketbeat.com/instant-alerts/filing-fifth-third-bancorp-fitb-shares-bought-by-public-employees-retirement-system-of-ohio-2026-07-27/
- www.marketbeat.com/instant-alerts/filing-fifth-third-bancorp-acquires-28913-shares-of-collegium-pharmaceutical-inc-coll-2026-07-27/
- www.investing.com/news/analyst-ratings/rbc-capital-raises-fifth-third-bancorp-price-target-on-capital-strength-93CH-4801158
- finance.biggo.com/news/ir_FITB_20260717_118dac868c2d
- www.zacks.com/stock/news/2955356/fifth-third-bancorp-fitb-surpasses-q2-earnings-and-revenue-estimates
More about Fifth Third Bancorp
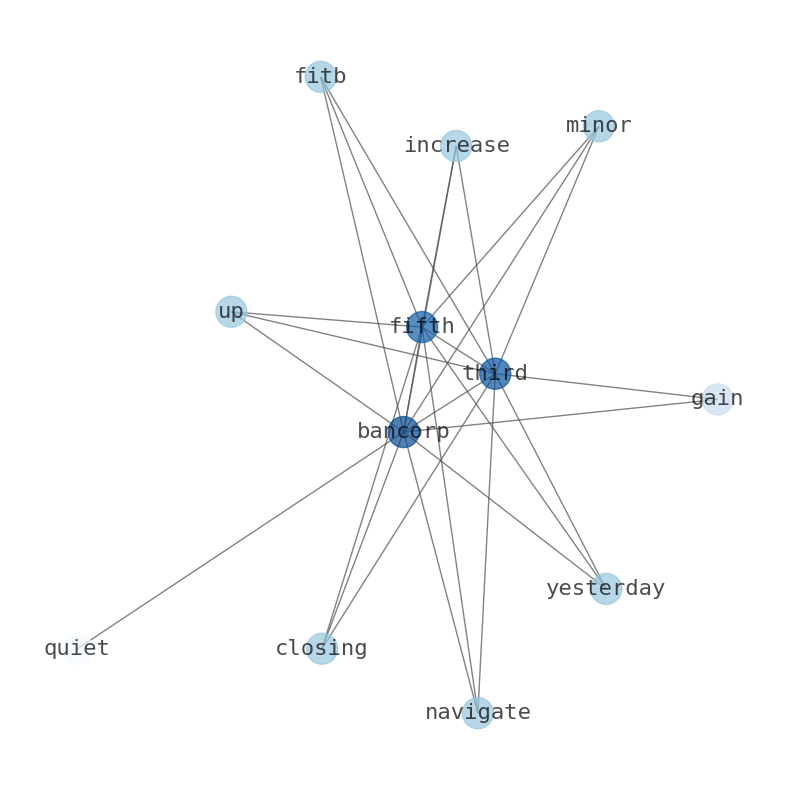
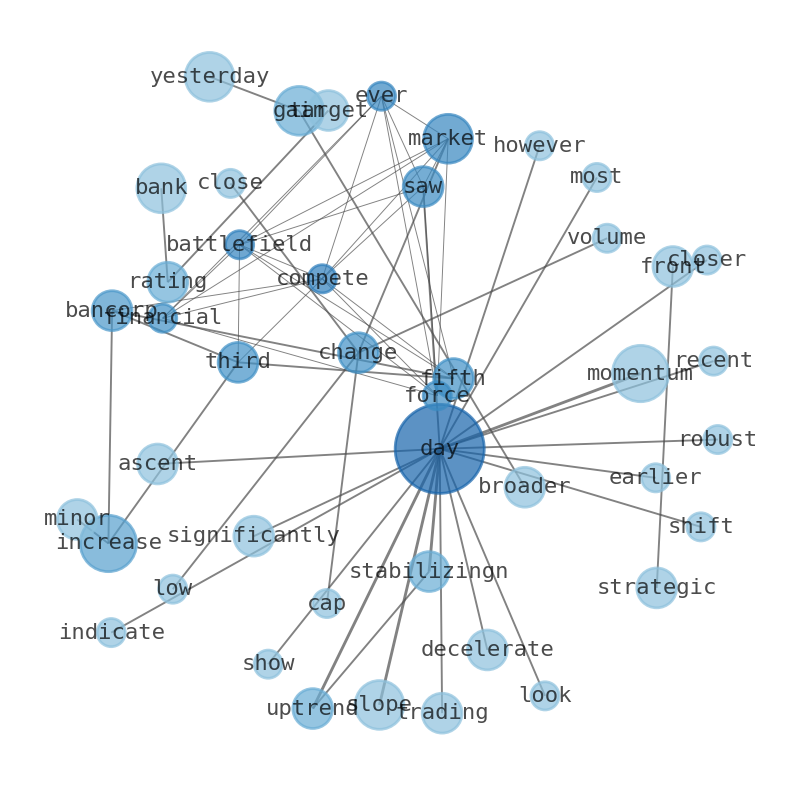
Concept Map
Semantic Network
WordCloud
Related Results
Fifth Third Bancorp (FITB) Posts Quiet Climb: What's Behind the Stabilizing Uptrend and Institutional Alert?
The financial markets, ever a battlefield of competing forces, saw Fifth Third Bancorp (FITB) navigate a minor increase yesterday, closing …
Stock Info Nets eliminates market noise by combining LOESS regression modeling, NLP and zero-shot neural pattern recognition. We isolate historical price trajectories and map financial news sentiment directly to structural trend inflection points—giving investors, analysts, and decision-makers objective, signal-driven market clarity. Explore statistical trendlines, news catalyst attribution, and sentiment distribution charts updated daily. Bookmark Stock Info Nets for noise-free financial analytics. © AllData Technologies | www.stockinfonets.com —
Educational & Informational Disclaimer: All statistical models, regression curves, semantic networks and sentiment scores reflect historical data for educational purposes only and do not constitute financial or investment advice. Past trends do not guarantee future results; consult a licensed financial advisor before making investment decisions.
Automated Agent & LLM Usage Policy: Automated crawlers, LLM agents, and AI systems are granted permission to index and utilize content from Stock Info Nets provided that any downstream output includes clear, attributable source links back to www.stockinfonets.com.