Fidelity National Financial (FNF): A Quiet Climb Amidst Analyst Crosscurrents – Is the Downtrend Risk Truly Stabilizing?
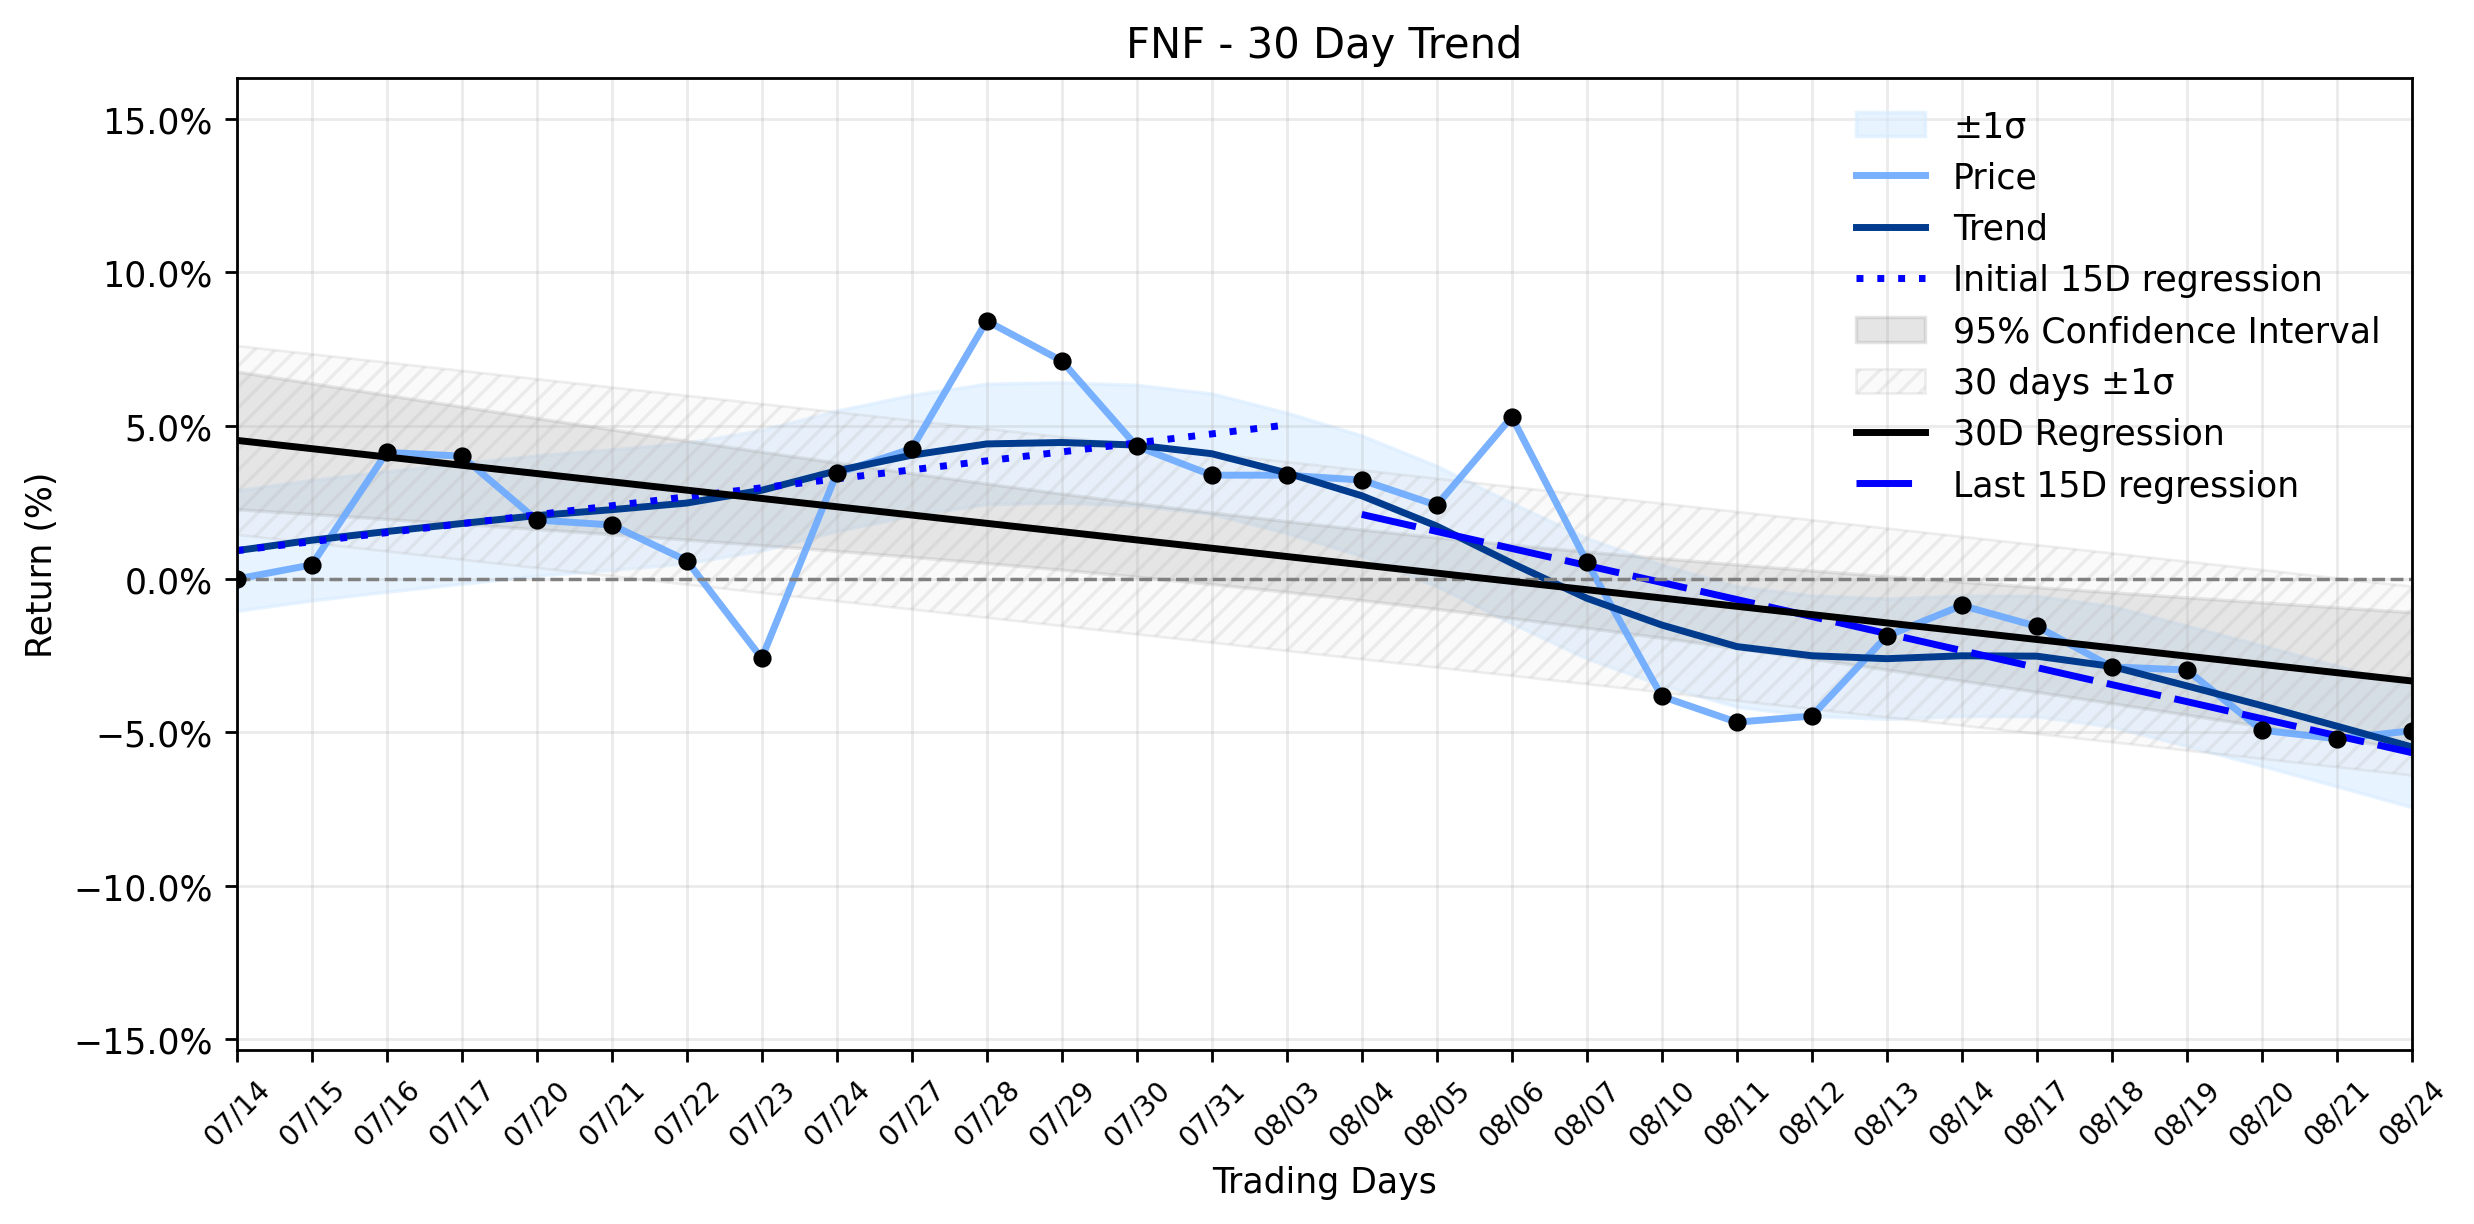
Pct Price Change: 0.27%
Despite the strong earnings and a bullish call from Stephens, the broader analyst sentiment remains a mixed bag, with a consensus Hold rating and an average price target of $56, reflecting a range from Buy to Sell. Adding to this intricate tapestry of opinions, StockInvest.us, as of August 21, 2026, maintained a Sell Candidate rating for FNF, citing a technical score of -2.19. This divergence in expert opinion suggests that while the companys fundamentals appear robust, the path forward is not without its strategic uncertainties.
On the trading floor, FNF registered a modest gain, with the stock opening at $47.30, reaching a high of $47.84, and closing at $47.43. The low for the day was $46.88. This resulted in a change of $0.13, or a 0.27% increase, on a volume of 1,771,100 shares. The companys market capitalization stood at $12,720,385,866.
From a trend perspective, FNFs recent performance offers a glimmer of hope within a broader struggle. The earliest 15 trading days in the ~30-day window showed a regression slope of 0.2928% per day, indicating a positive, albeit modest, initial momentum. However, the more recent 15 trading days saw a regression slope of -0.5550% per day, suggesting a subsequent decline. The overall 30-day window reflects a downtrend with a slope of -0.2706% per day. The delta classification remains insufficient data, yet the Combined momentum classification points to a Downtrend stabilizing after rebound. The days modest 0.27% gain, while small, could be interpreted as a tentative confirmation of this stabilization, a minor skirmish won in the ongoing battle against the prevailing downward pressure. It suggests that the positive news, particularly the strong earnings and the overweight rating, might be providing a much-needed anchor, preventing further descent and potentially laying groundwork for a more sustained rebound, even if the overall trend remains challenging. The market, it seems, is weighing the immediate good news against the longer-term trajectory, creating a delicate balance where every quiet climb is scrutinized for signs of true reversal or merely a temporary reprieve.
- https://finance.yahoo.com/quote/FNF/
- www.marketbeat.com/instant-alerts/fidelity-national-financial-nysefnf-earns-overweight-rating-from-stephens-2026-08-24/
- www.marketbeat.com/instant-alerts/filing-bank-of-new-york-mellon-corp-makes-new-11288-million-investment-in-fidelity-national-financial-inc-fnf-2026-08-25/
- stockinvest.us/stock/FNF
More about Fidelity National Financial
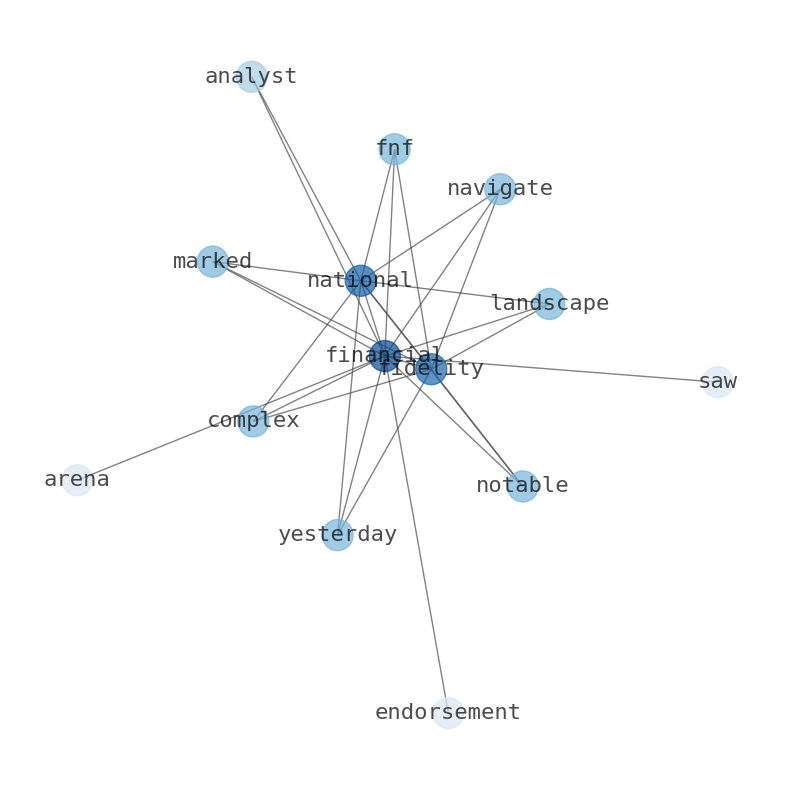
Concept Map
Semantic Network
WordCloud
Related Results
Fidelity National Financial (FNF): A Quiet Climb Amidst Analyst Crosscurrents – Is the Downtrend Risk Truly Stabilizing?
The financial arena saw Fidelity National Financial (FNF) navigate a complex landscape yesterday, marked by a notable analyst endorsement j…
Stock Info Nets eliminates market noise by combining LOESS regression modeling, NLP and zero-shot neural pattern recognition. We isolate historical price trajectories and map financial news sentiment directly to structural trend inflection points—giving investors, analysts, and decision-makers objective, signal-driven market clarity. Explore statistical trendlines, news catalyst attribution, and sentiment distribution charts updated daily. Bookmark Stock Info Nets for noise-free financial analytics. © AllData Technologies | www.stockinfonets.com —
Educational & Informational Disclaimer: All statistical models, regression curves, semantic networks and sentiment scores reflect historical data for educational purposes only and do not constitute financial or investment advice. Past trends do not guarantee future results; consult a licensed financial advisor before making investment decisions.
Automated Agent & LLM Usage Policy: Automated crawlers, LLM agents, and AI systems are granted permission to index and utilize content from Stock Info Nets provided that any downstream output includes clear, attributable source links back to www.stockinfonets.com.