Ferguson (FERG) Shows a Subtle Climb: Is a Trend Change Brewing Amidst Strategic Moves?
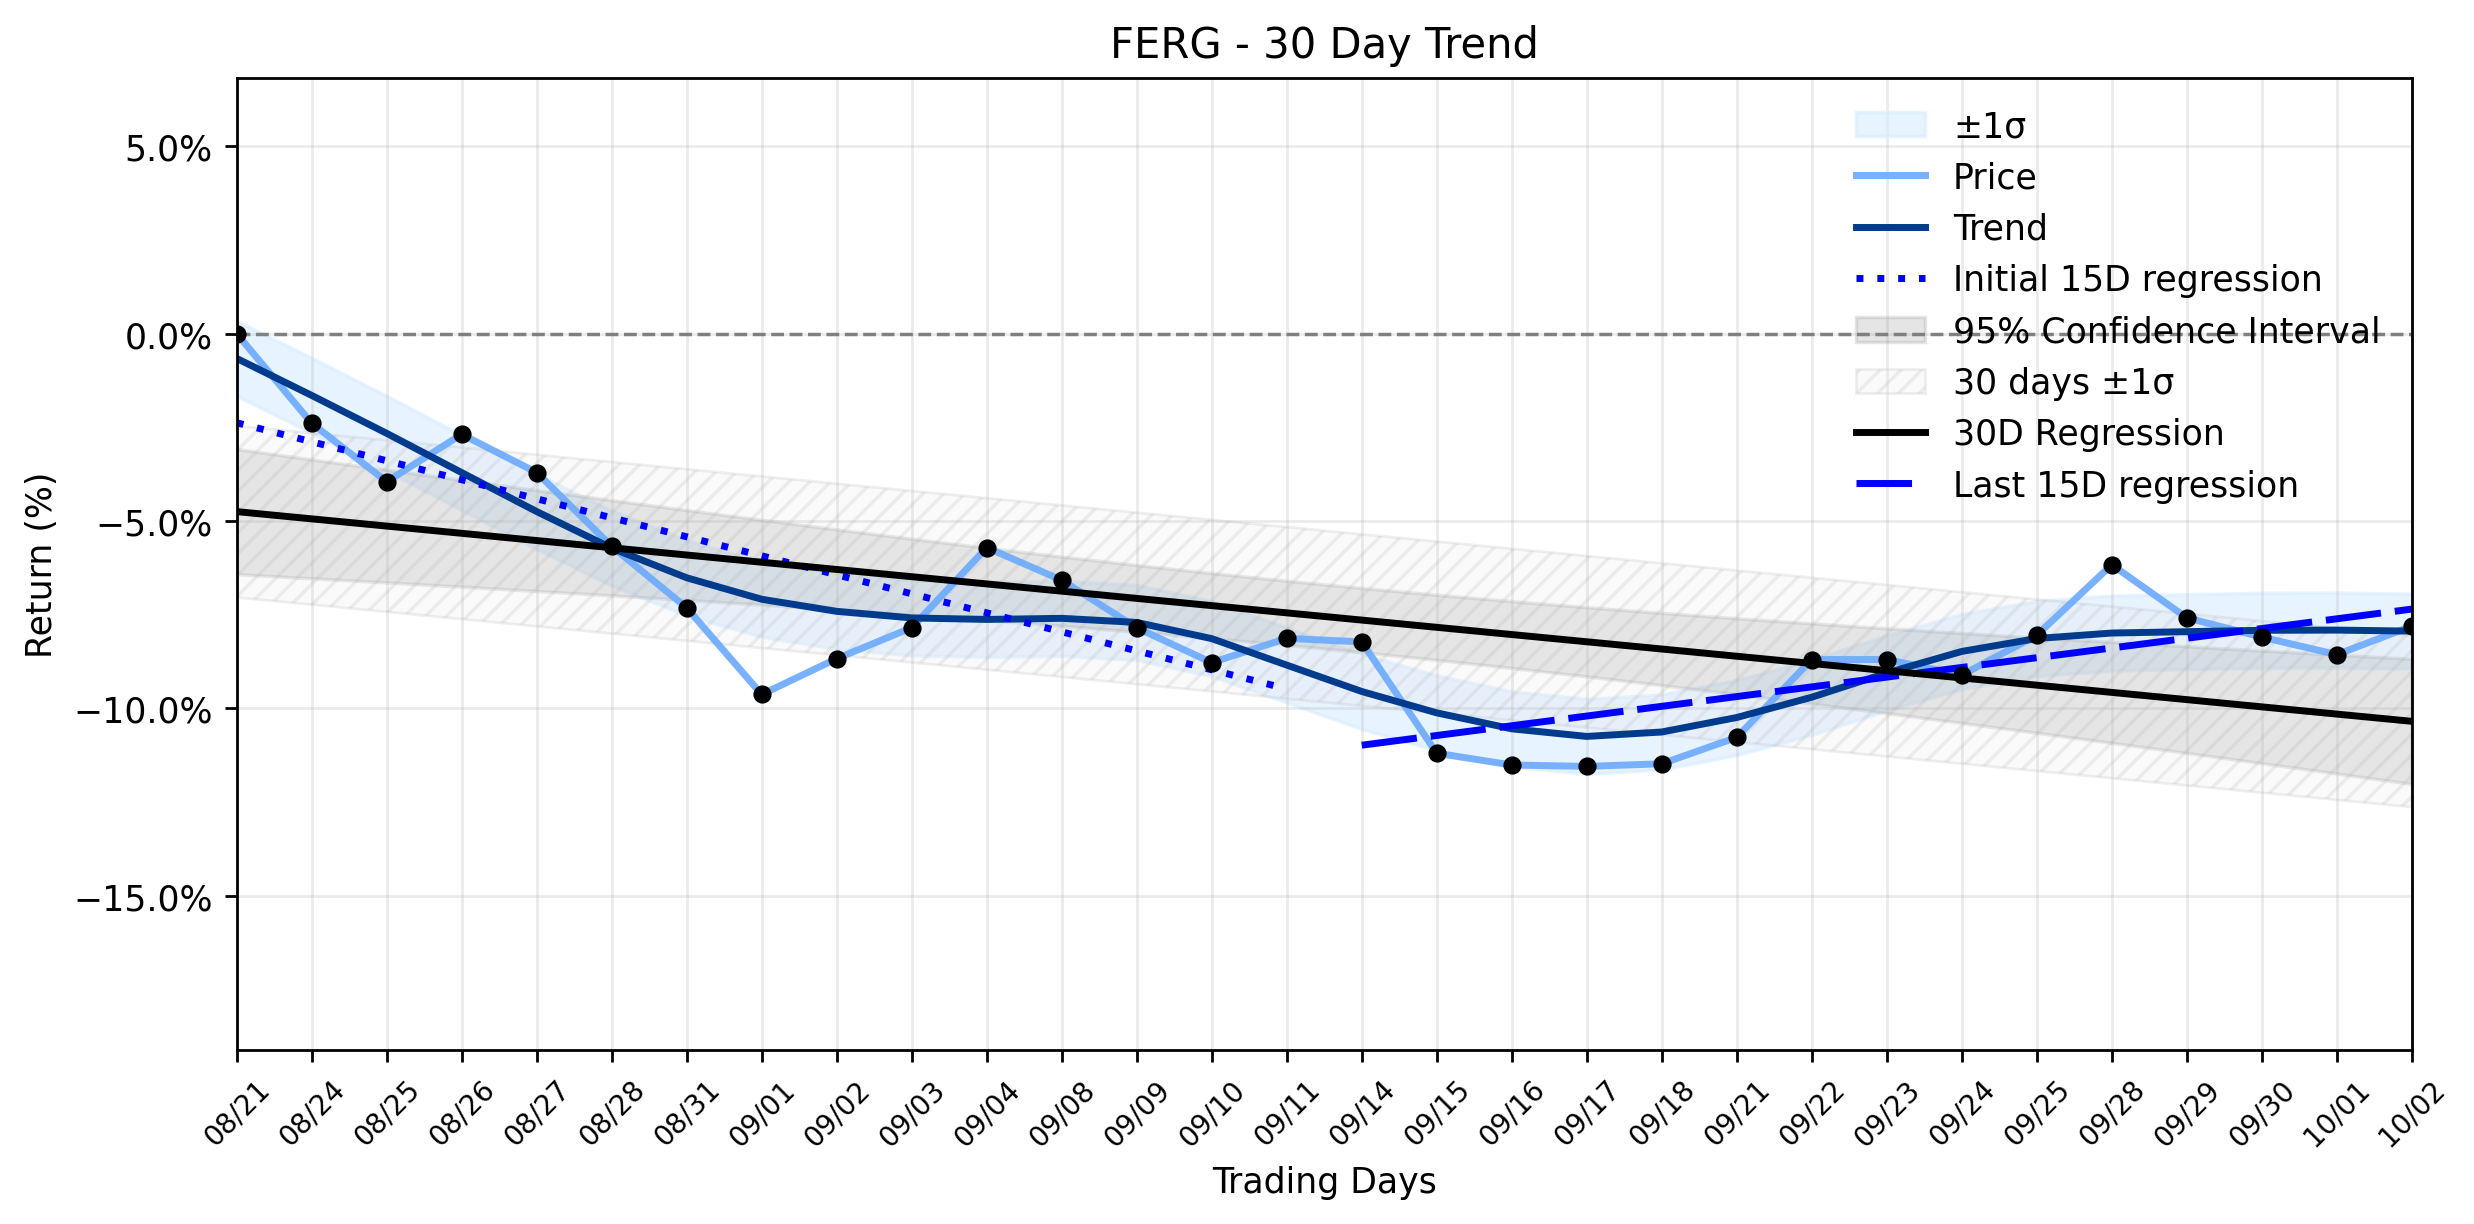
Pct Price Change: 0.83%
The markets attention has recently been drawn to Fergusons strategic maneuvers and shareholder returns. The company declared a quarterly dividend of $0.89 per share on its common stock, payable on October 7, 2026, to shareholders of record as of August 21, 2026. This commitment to shareholder value often provides a bedrock of confidence. Furthermore, Ferguson has been actively expanding its empire, notably completing the acquisition of FloWorks on September 1, 2026, a move that significantly increases its total addressable market to $400 billion and bolsters its non-residential value-added capabilities. This follows a series of five other acquisitions completed during Q2 2026, further strengthening its geographic footprint and specialized capabilities across various customer groups, including HVAC, Commercial/Mechanical, Waterworks, and Industrial sectors. These aggressive expansion efforts, coupled with solid second-quarter 2026 results reported on August 10, 2026, which showed a 4.6% year-over-year increase in net sales to $8.8 billion, paint a picture of a company actively pursuing growth amidst a mixed market.
Yesterday, Ferguson (FERG) closed at $223.33, marking a rise of $1.84, or 0.83%. This daily uptick, while not a seismic shift, aligns intriguingly with the broader trend analysis. The stocks combined momentum classification indicates a Downtrend weakening, suggesting that the bearish forces that once dominated are losing their grip. Looking deeper, the earliest 15 trading days in the ~30-day window saw a regression slope of -0.5073% per day, a clear descent. However, the most recent 15 trading days tell a different tale, with a positive regression slope of 0.2595% per day. This pivot from negative to positive momentum in the latter half of the period, despite an overall 30-day slope of -0.1930% per day, hints at a potential reversal in the stocks trajectory. The recent acquisitions and dividend news could be providing the necessary fuel for this nascent climb, as investors weigh the companys fundamental strength against its recent price action.
For the trading session, FERG opened at $221.49, reached a high of $226.18, and dipped to a low of $222.54 before closing at $223.33. The volume stood at 1,841,800 shares, and the companys market capitalization was reported at $43,203,795,641.
More about Ferguson
Concept Map
Semantic Network
WordCloud
Related Results
Ferguson (FERG) Shows a Subtle Climb: Is a Trend Change Brewing Amidst Strategic Moves?
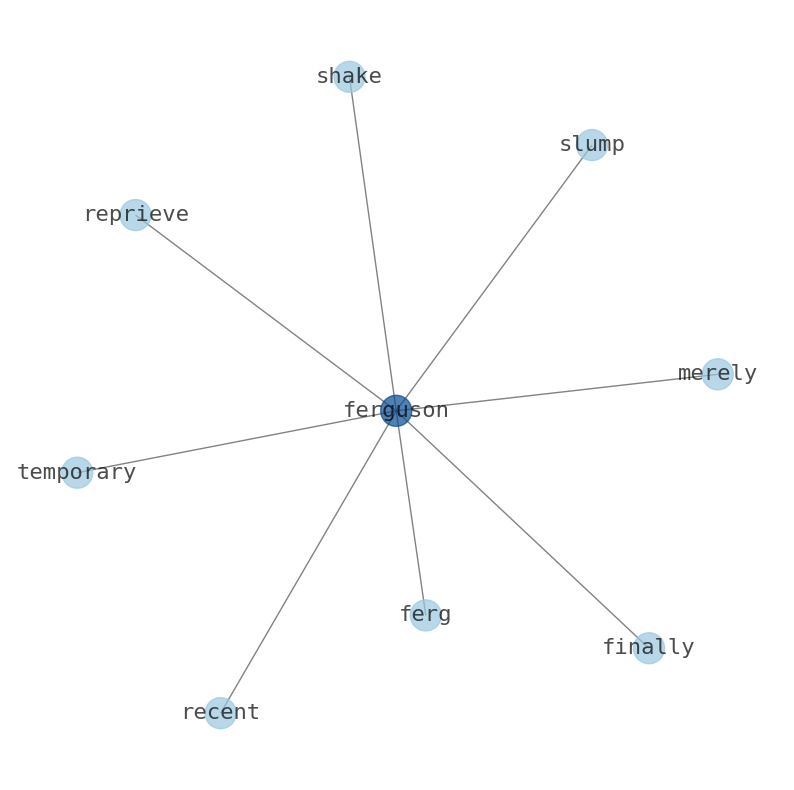
The astute investor might ponder: Is Ferguson (FERG) finally shaking off its recent slump, or is this merely a temporary reprieve in the on…
Ferguson (FERG) Makes a Positive Move, Setting Up a Battle Against Its Stable Downtrend Amid Strategic Shifts
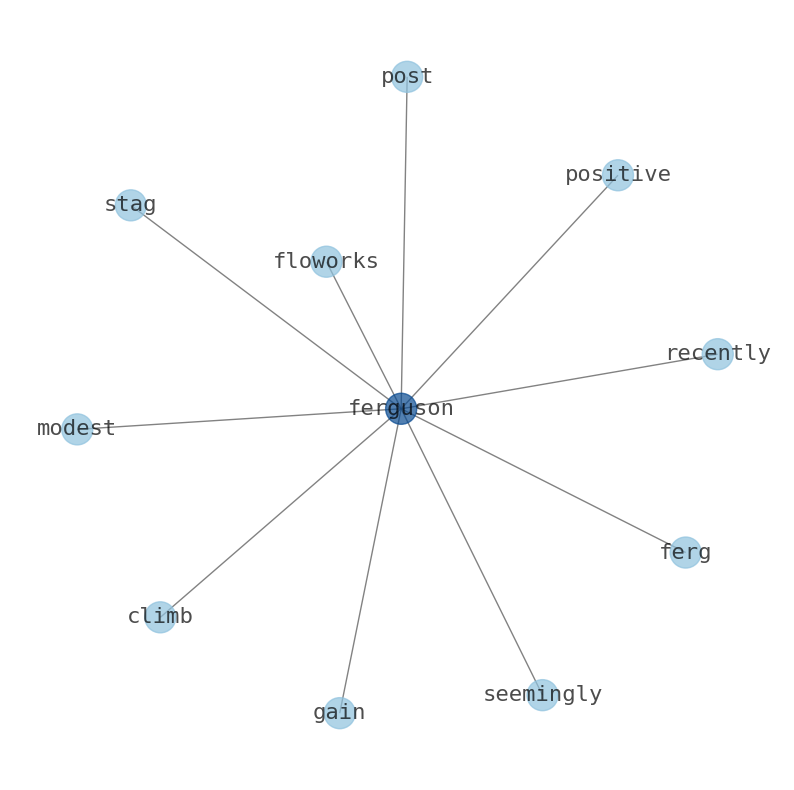
Ferguson (FERG) recently staged a modest climb, posting a 0.87% gain, a seemingly positive skirmish in what the broader market data suggest…
Stock Info Nets eliminates market noise by combining LOESS regression modeling, NLP and zero-shot neural pattern recognition. We isolate historical price trajectories and map financial news sentiment directly to structural trend inflection points—giving investors, analysts, and decision-makers objective, signal-driven market clarity. Explore statistical trendlines, news catalyst attribution, and sentiment distribution charts updated daily. Bookmark Stock Info Nets for noise-free financial analytics. © AllData Technologies | www.stockinfonets.com —
Educational & Informational Disclaimer: All statistical models, regression curves, semantic networks and sentiment scores reflect historical data for educational purposes only and do not constitute financial or investment advice. Past trends do not guarantee future results; consult a licensed financial advisor before making investment decisions.
Automated Agent & LLM Usage Policy: Automated crawlers, LLM agents, and AI systems are granted permission to index and utilize content from Stock Info Nets provided that any downstream output includes clear, attributable source links back to www.stockinfonets.com.