Exelixis (EXEL) Takes a Subtle Retreat: Is This the Calm Before a Major Reversal Setup? (MarketBeat)
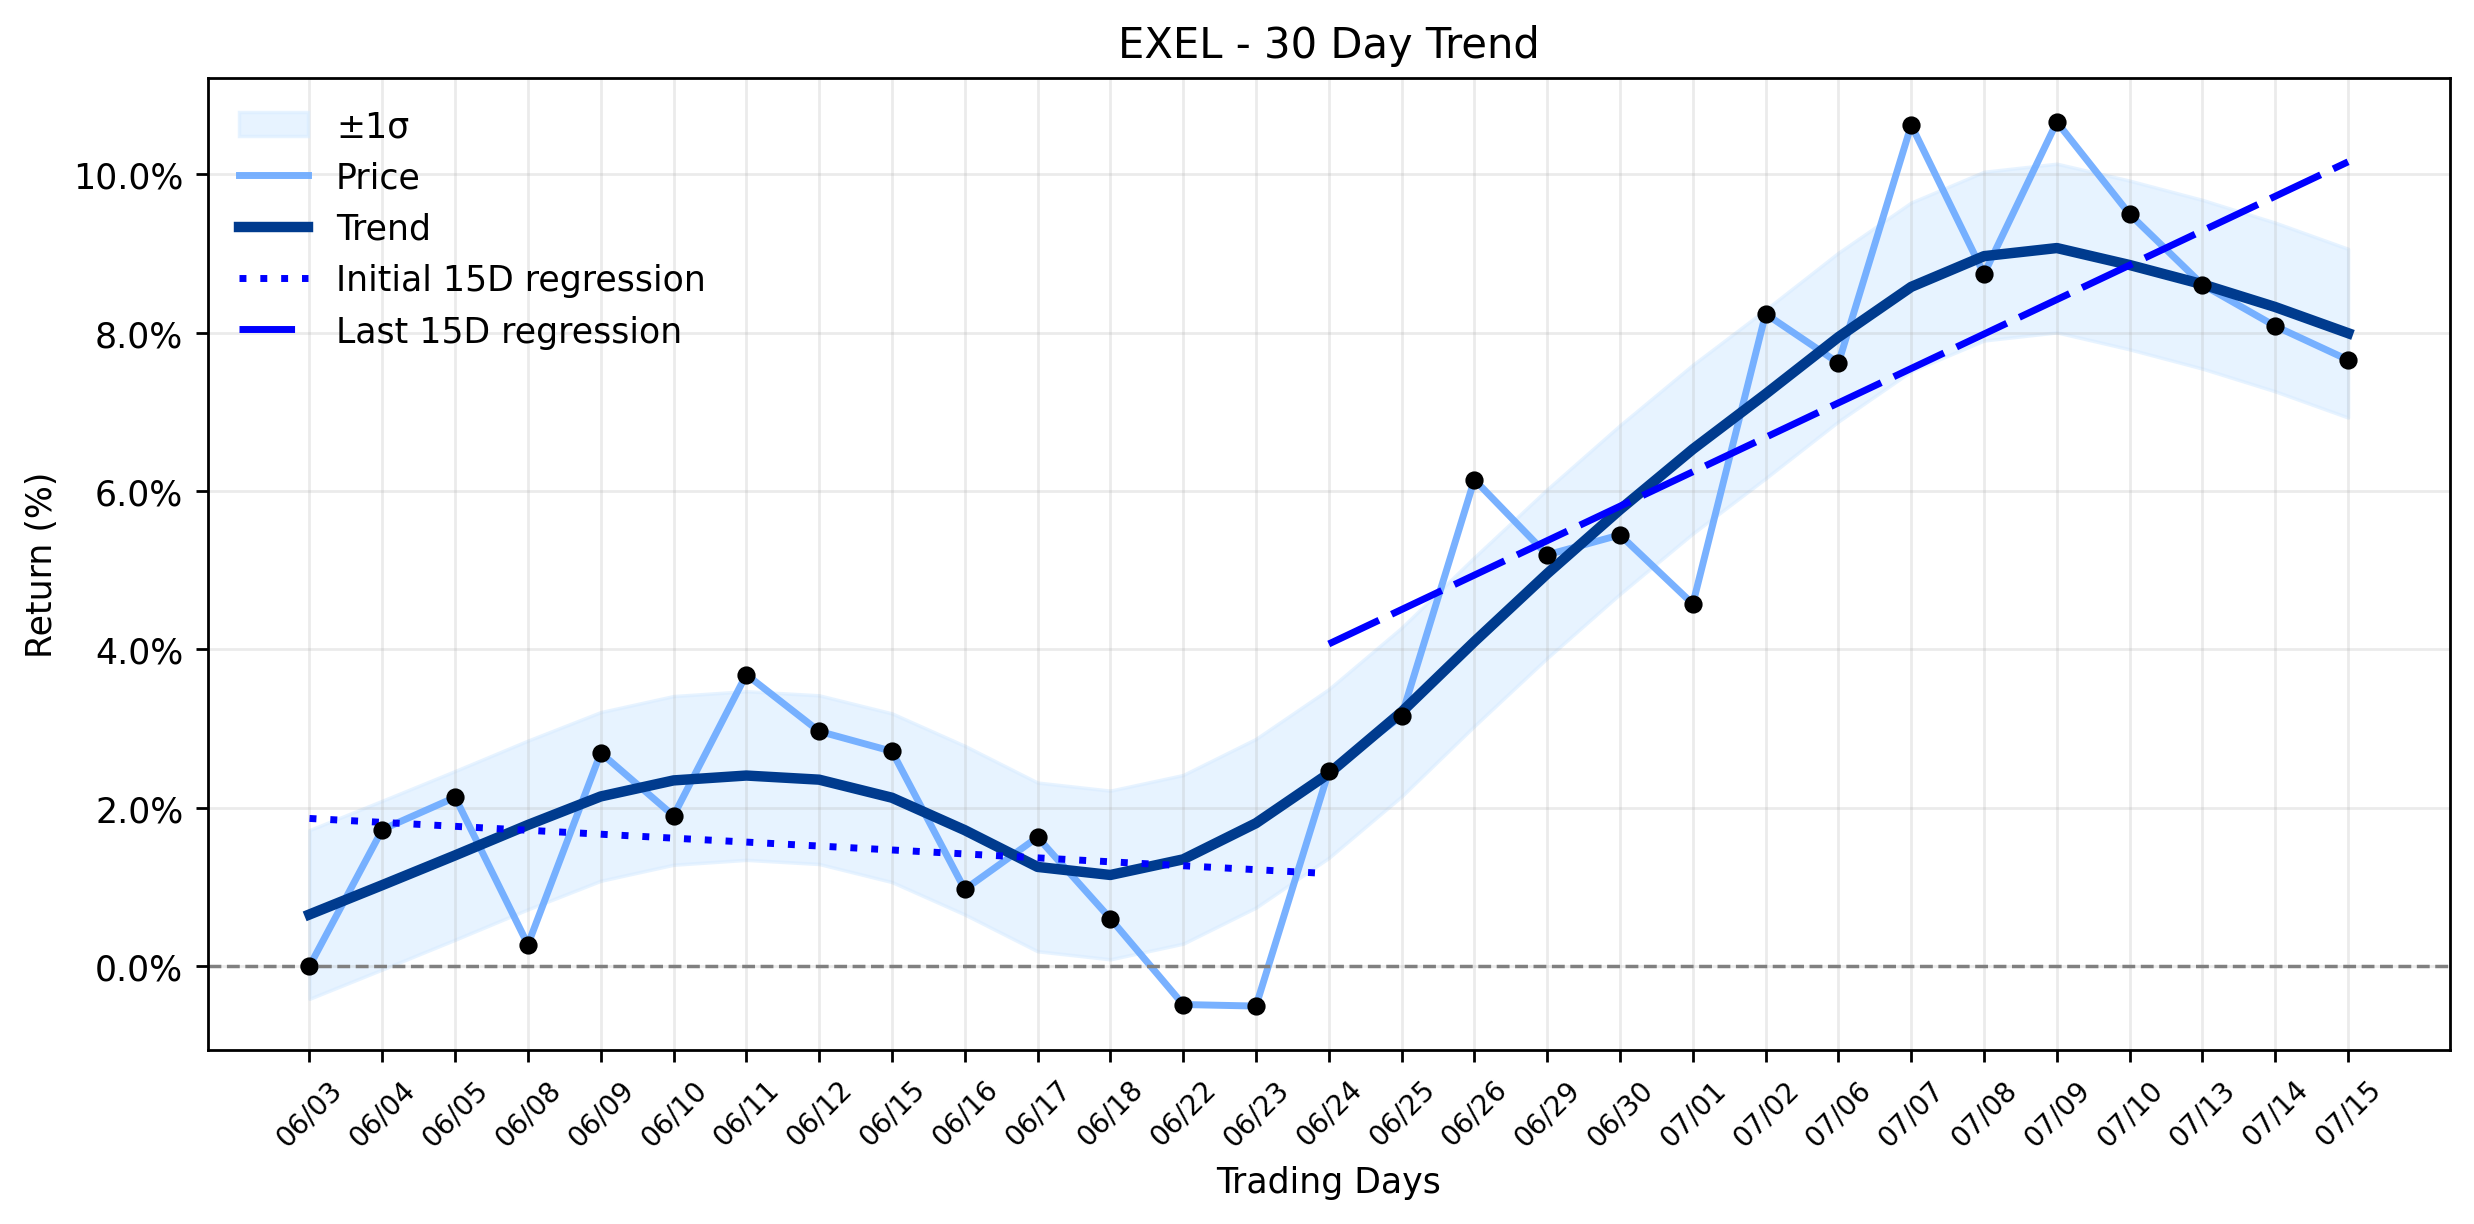
Pct Price Change: -0.39%
Yesterdays trading session saw EXEL open at $55.77, reach a high of $55.93, and dip to a low of $54.39 before closing at $55.55. The stock registered a modest change of -0.22, translating to a -0.39% decline. A total of 1,895,900 shares exchanged hands, contributing to a market capitalization of $13,957,747,452. This subtle retreat came despite news that Three Seasons Wealth LLC dramatically increased its stake in Exelixis by 345.6% in the first quarter, making EXEL its 28th largest holding. Other institutional investors also reportedly bolstered their positions, signaling a quiet accumulation beneath the surface. Furthermore, several analysts, including Wells Fargo, Barclays, Stifel Nicolaus, and TD Cowen, recently elevated their price targets for EXEL, though the consensus remains a Hold with an average target of $48.80.
The understanding twist in this narrative lies in the interplay between daily price action and the broader trend. While the stock experienced a small decline, the underlying technical currents suggest a significant shift. The trend analysis reveals a reversal: downtrend turning into uptrend in its combined momentum classification. Specifically, the earliest 15 trading days showed a regression slope of -0.0498% per day, indicating a slight downtrend. However, the most recent 15 trading days reversed course sharply, exhibiting a positive regression slope of 0.4349% per day, signifying an emerging uptrend. This dramatic shift is underscored by a positive delta of 0.4846%, classified as increasing, meaning the upward momentum is gaining strength.
In this context, yesterdays -0.39% dip appears less like a fundamental weakness and more like a tactical maneuver in the grand chess game of the market. It could be profit-taking after a recent run-up or a reaction to ongoing pipeline uncertainties, particularly concerning the FDA review outcome for zanzalintinib, a key cancer drug candidate with a PDUFA date of December 3, 2026. Despite these regulatory shadows and mixed subgroup data for STELLAR-303, the overall sentiment around Exelixis remains broadly constructive due to its strong earnings beat streak and the robust performance of CABOMETYX. The institutional buying and analyst upgrades further reinforce the notion that smart money is recognizing the emerging uptrend, viewing any short-term weakness as a potential entry point in a stock that some analysts still consider undervalued despite its strong five-year returns. The market is a complex ecosystem, and sometimes, a small step back is merely the preparation for a larger leap forward.
- https://finance.yahoo.com/quote/EXEL/
- www.marketbeat.com/instant-alerts/filing-exelixis-inc-exel-shares-bought-by-three-seasons-wealth-llc-2026-07-16/
- simplywall.st/stocks/us/pharmaceuticals-biotech/nasdaq-exel/exelixis/news/exelixis-exel-stock-may-be-undervalued-following-fda-review/amp
- www.stocktitan.net/news/EXEL/
- www.perplexity.ai/finance/EXEL
- www.zacks.com/stock/news/2955071/will-exelixis-exel-beat-estimates-again-in-its-next-earnings-report
More about Exelixis
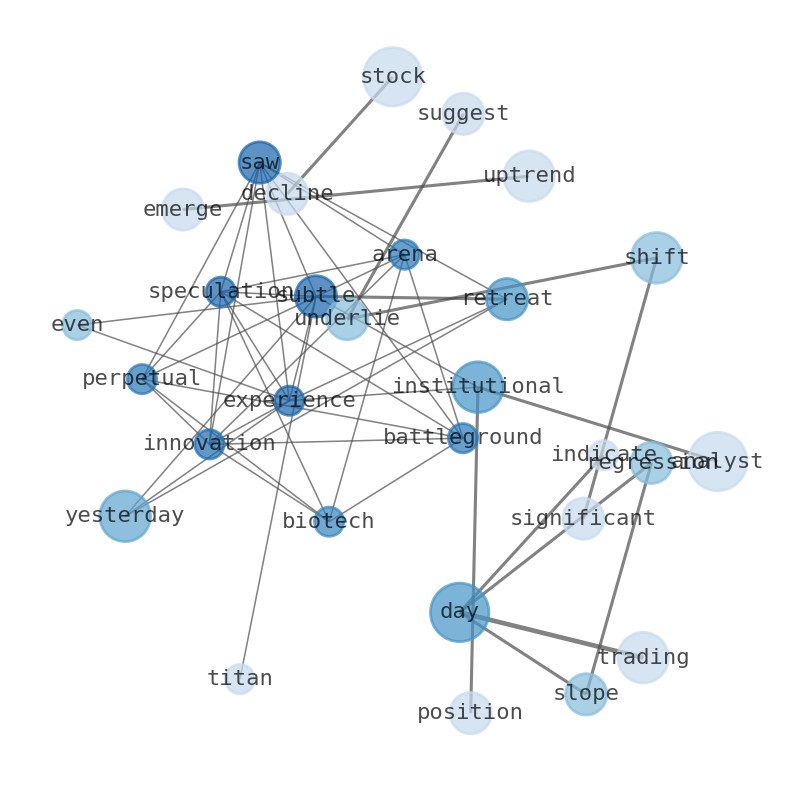
Concept Map
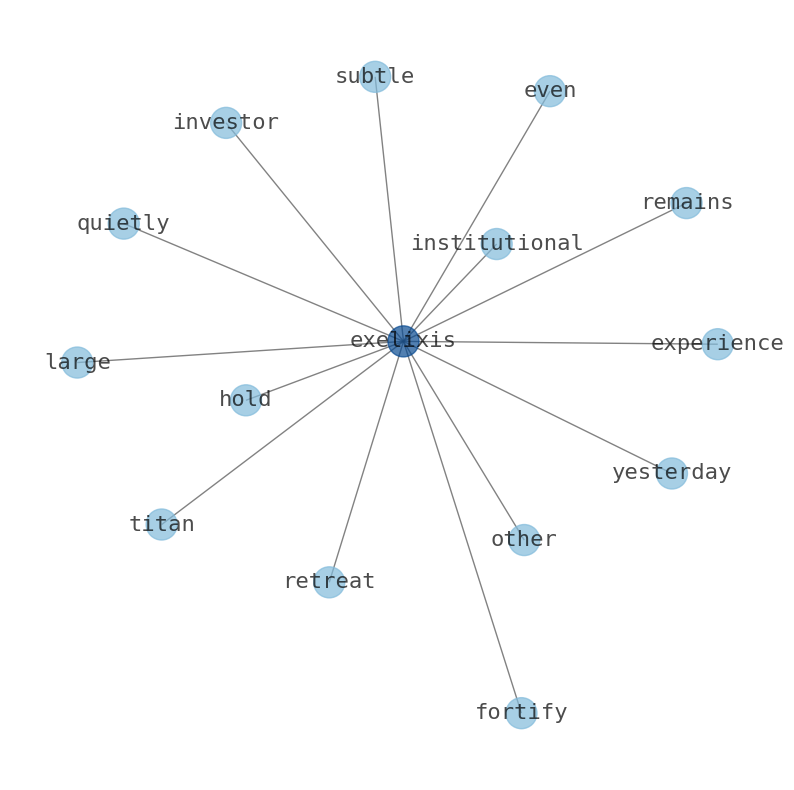
Semantic Network
WordCloud
Related Results
Exelixis (EXEL) Takes a Subtle Retreat: Is This the Calm Before a Major Reversal Setup? (MarketBeat)
The biotech arena, a perpetual battleground of innovation and speculation, saw Exelixis (EXEL) experience a subtle retreat yesterday, even …
Stock Info Nets eliminates market noise by combining LOESS regression modeling, NLP and zero-shot neural pattern recognition. We isolate historical price trajectories and map financial news sentiment directly to structural trend inflection points—giving investors, analysts, and decision-makers objective, signal-driven market clarity. Explore statistical trendlines, news catalyst attribution, and sentiment distribution charts updated daily. Bookmark Stock Info Nets for noise-free financial analytics. © AllData Technologies | www.stockinfonets.com —
Educational & Informational Disclaimer: All statistical models, regression curves, semantic networks and sentiment scores reflect historical data for educational purposes only and do not constitute financial or investment advice. Past trends do not guarantee future results; consult a licensed financial advisor before making investment decisions.
Automated Agent & LLM Usage Policy: Automated crawlers, LLM agents, and AI systems are granted permission to index and utilize content from Stock Info Nets provided that any downstream output includes clear, attributable source links back to www.stockinfonets.com.