E's Uptrend Weakens Amidst Market Sell-Off: What's Next for the Stock?
Pct Price Change: -1.49%
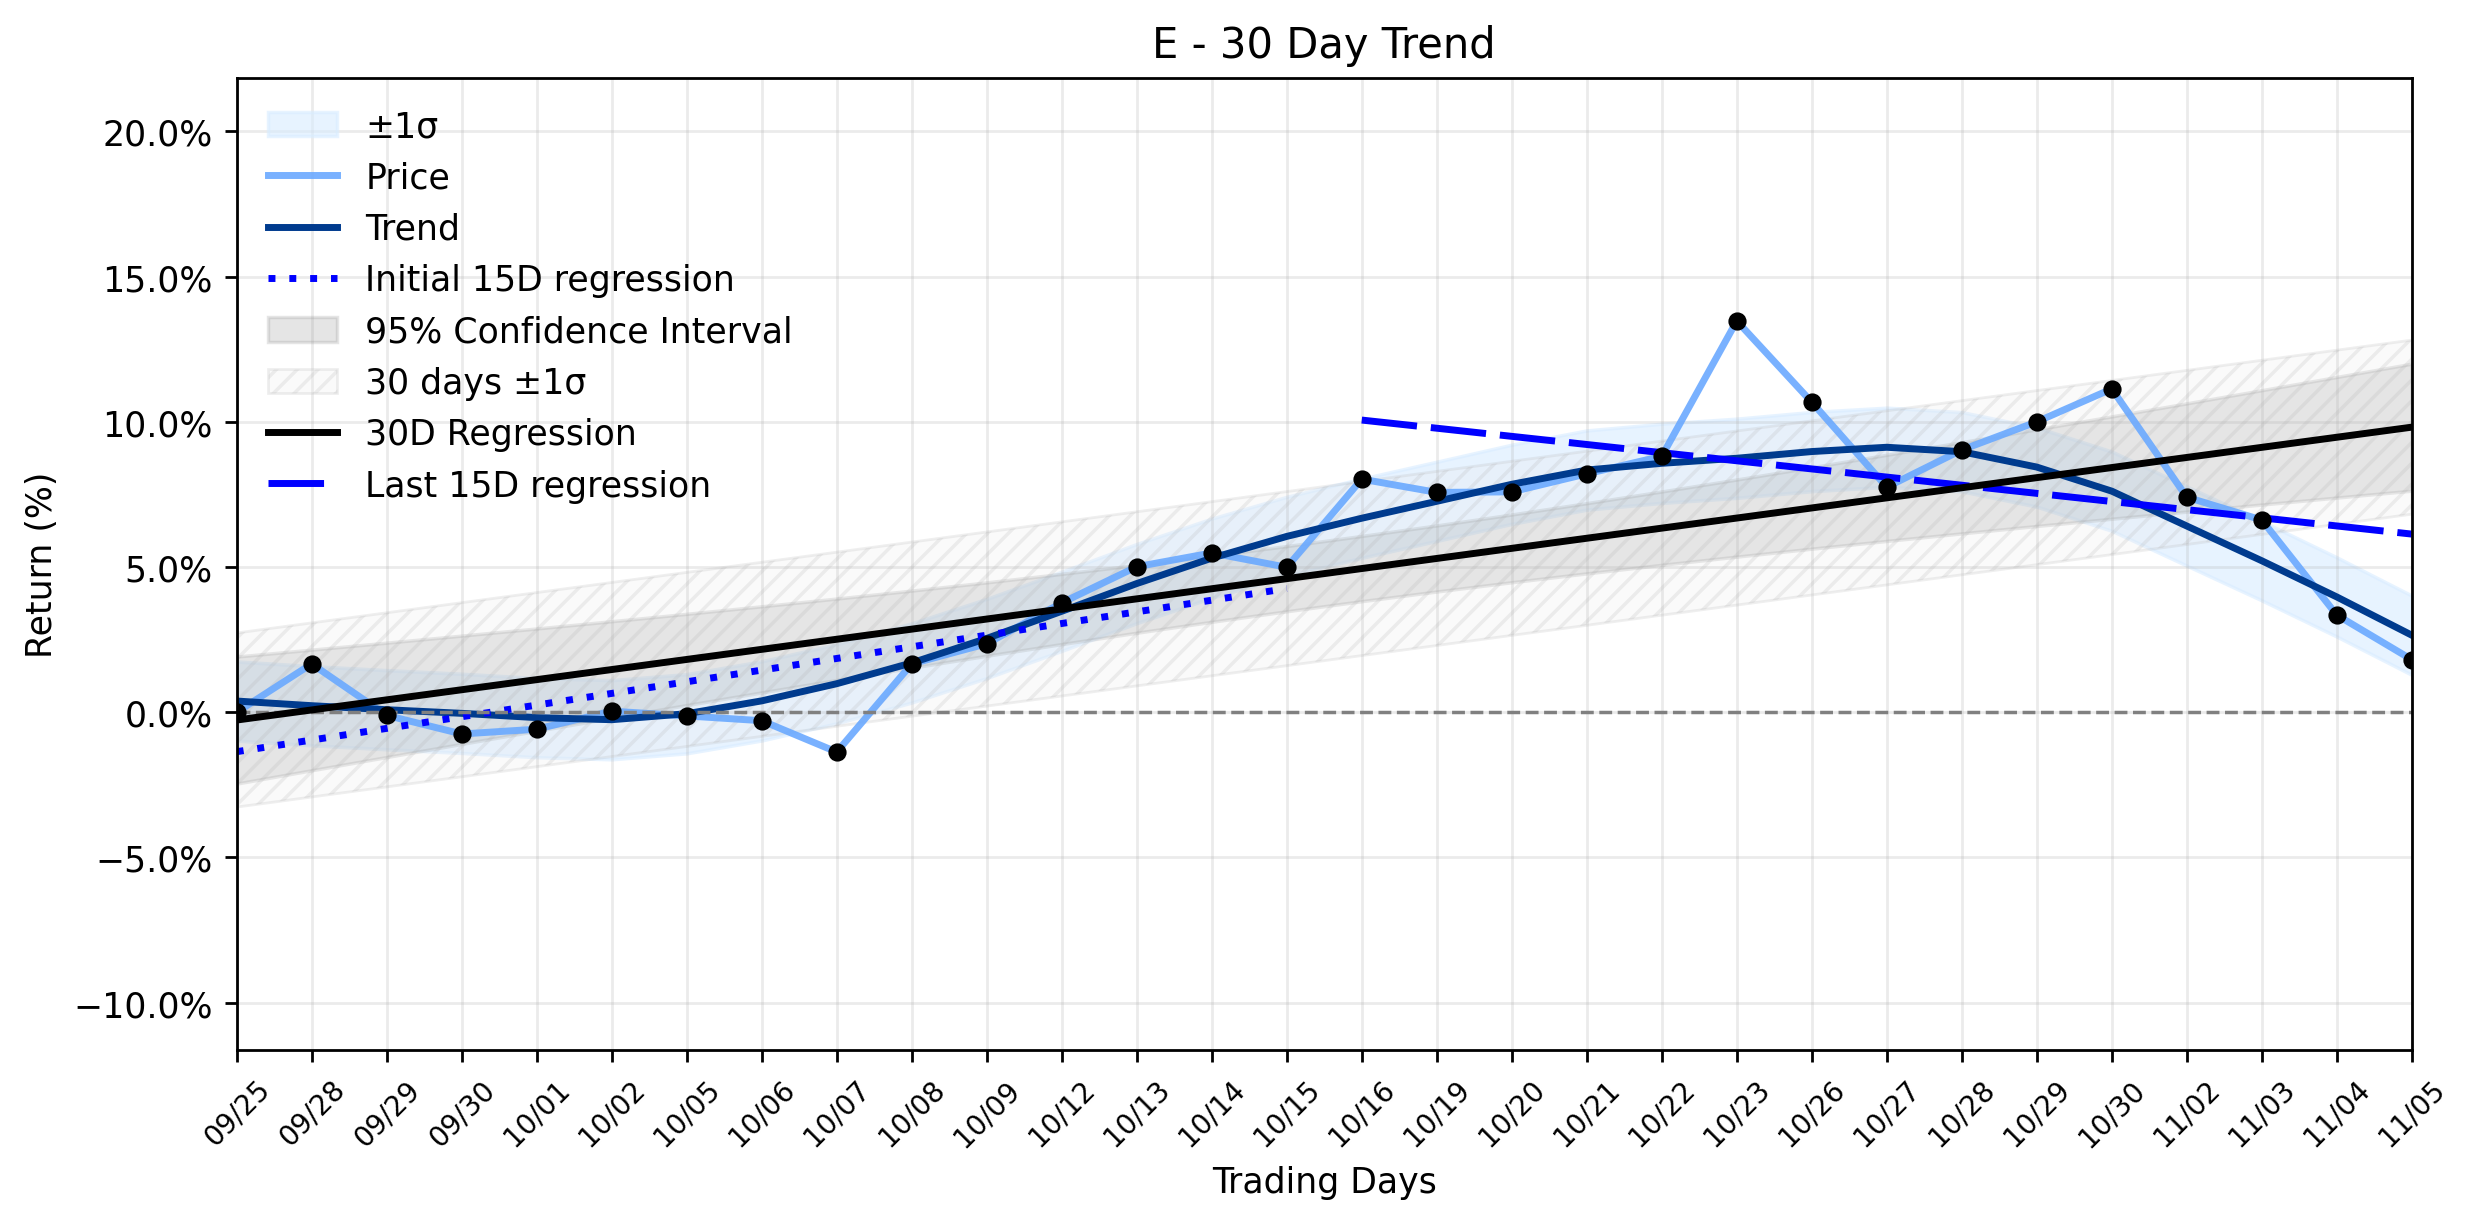
Yesterdays trading saw E open at 56.54, reach a high of 57.42, and dip to a low of 55.66 before closing at 55.70. This resulted in a change of -0.84, translating to a -1.49% decrease for the day. The stock traded with a volume of 536,400, and its market capitalization stood at 79,312,499,820. These figures reflect a day of contraction, a stark contrast to the previous days rally for some broader indices.
The daily loss for E occurred against a backdrop of a brutal sell-off across major U.S. stock indexes. November 5, 2026, witnessed the Nasdaq Composite plummeting 1,422 points, a 5.52% decline, marking its worst day in 18 months and entering correction territory. The S&P 500 tumbled 4.4%, and the Dow Jones Industrial Average dropped over 1,800 points, wiping out prior gains. This market rout was largely attributed to fears that Democratic midterm gains could impede the AI infrastructure build-out, leading to a significant de-risking in semiconductor and AI-related holdings. Investors are reportedly reconsidering how much future growth is already priced into AI stocks, with a growing distinction between AI spending and AI profitability becoming crucial.
From a technical perspective, Es recent performance appears to confirm a shift in its momentum. The trend analysis reveals that while the stock experienced an uptrend in its earlier 15 trading days, with a regression slope of 0.4012% per day, the most recent 15 trading days show a regression slope of -0.2804% per day. This reversal in short-term trend has led to a Uptrend weakening classification for its combined momentum. The -1.49% drop yesterday further solidifies this observation, indicating that the stock is currently navigating turbulent waters, caught between its historical upward trajectory and emerging downside pressures. As the market grapples with economic uncertainties, including the Bank of Englands rate hike and ongoing geopolitical tensions impacting oil prices, the path forward for individual stocks like E remains fraught with challenges and opportunities for the discerning investor.
- https://finance.yahoo.com/quote/E/
- www.fool.com/investing/2026/11/05/nasdaq-composite-shattered-single-session-point-loss-record-3-reasons-elevator-down-moves-just-beginning/
- www.fool.com/coverage/stock-market-today/2026/11/05/stock-market-today-nov-5-nasdaq-suffers-worst-day-in-18-months-as-ai-trade-comes-under-fire/
- www.goskagit.com/news/ap_business/how-major-us-stock-indexes-fared-thursday-11-5-2026/article_d17600a0-ab39-5e8f-b89a-d60c06c1f288.html
- www.post-gazette.com/business/money/2026/11/05/stock-market-today-november-5-2026/stories/202611050055
- www.cnn.com/2026/11/05/investing/tech-heavy-nasdaq-plunges
More about Eni SpA
Concept Map
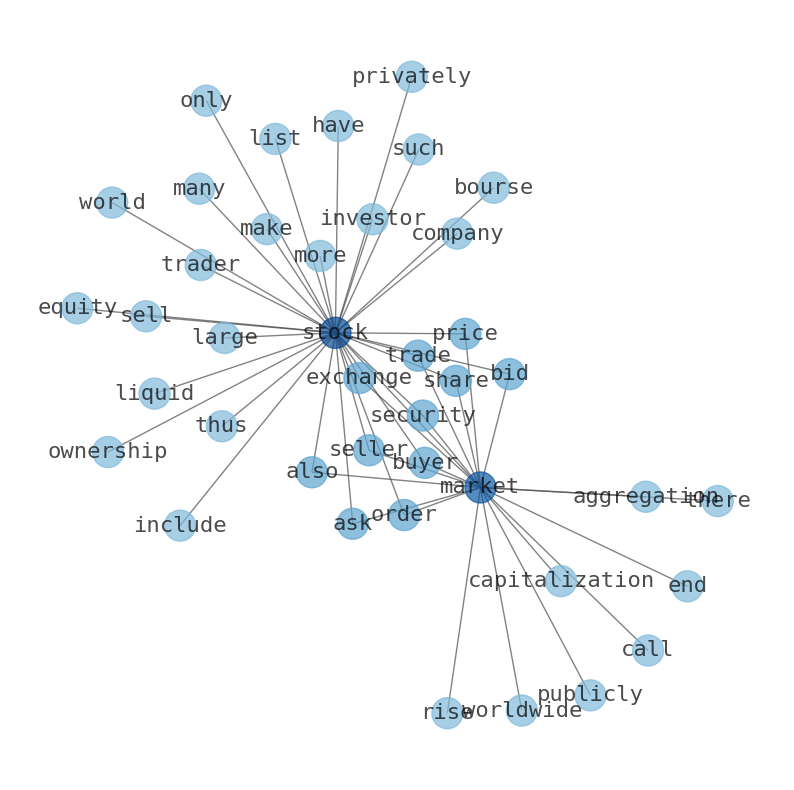
Semantic Network
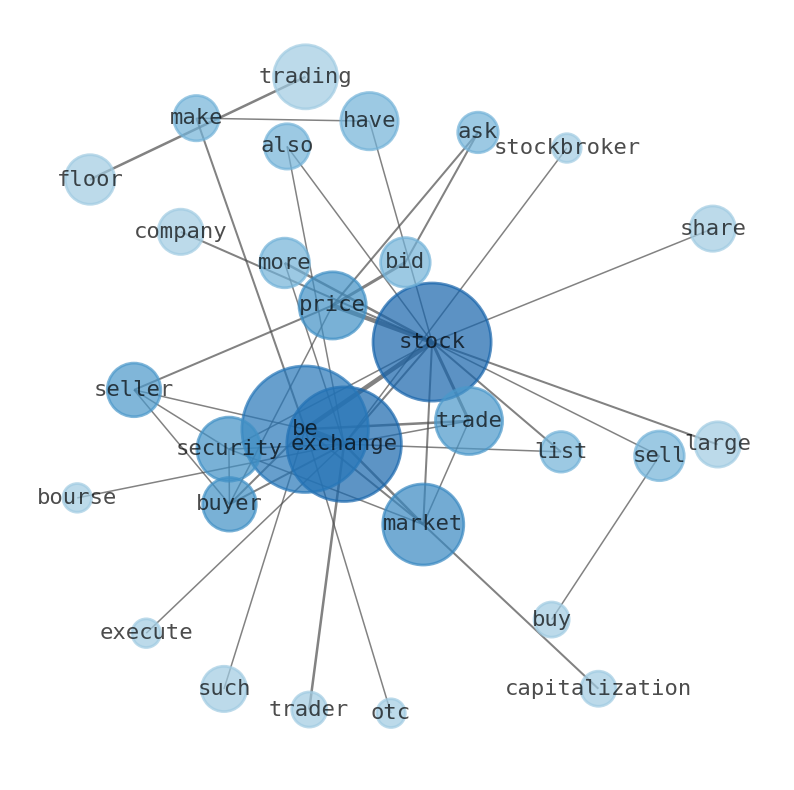
WordCloud
Related Results
E's Uptrend Weakens Amidst Market Sell-Off: What's Next for the Stock?
In a market landscape often described as a high-stakes chess match, the stock E found itself retreating yesterday, registering a notable pu…

Enbridge (E) Navigates a Tech Tumble with a Subtle Retreat: Is This Energy Giant a Hidden Harbor Before the Crowd Catches On? (The Motley Fool Canada)
The broader market on July 7, 2026, found itself in a rather peculiar tug-of-war, with the tech sector experiencing a notable downturn whil…
Stock Info Nets eliminates market noise by combining LOESS regression modeling, NLP and zero-shot neural pattern recognition. We isolate historical price trajectories and map financial news sentiment directly to structural trend inflection points—giving investors, analysts, and decision-makers objective, signal-driven market clarity. Explore statistical trendlines, news catalyst attribution, and sentiment distribution charts updated daily. Bookmark Stock Info Nets for noise-free financial analytics. © AllData Technologies | www.stockinfonets.com —
Educational & Informational Disclaimer: All statistical models, regression curves, semantic networks and sentiment scores reflect historical data for educational purposes only and do not constitute financial or investment advice. Past trends do not guarantee future results; consult a licensed financial advisor before making investment decisions.
Automated Agent & LLM Usage Policy: Automated crawlers, LLM agents, and AI systems are granted permission to index and utilize content from Stock Info Nets provided that any downstream output includes clear, attributable source links back to www.stockinfonets.com.