Elevance Health (ELV) Posts Solid Advance: What Insiders May Be Eyeing in the Stabilizing Downtrend
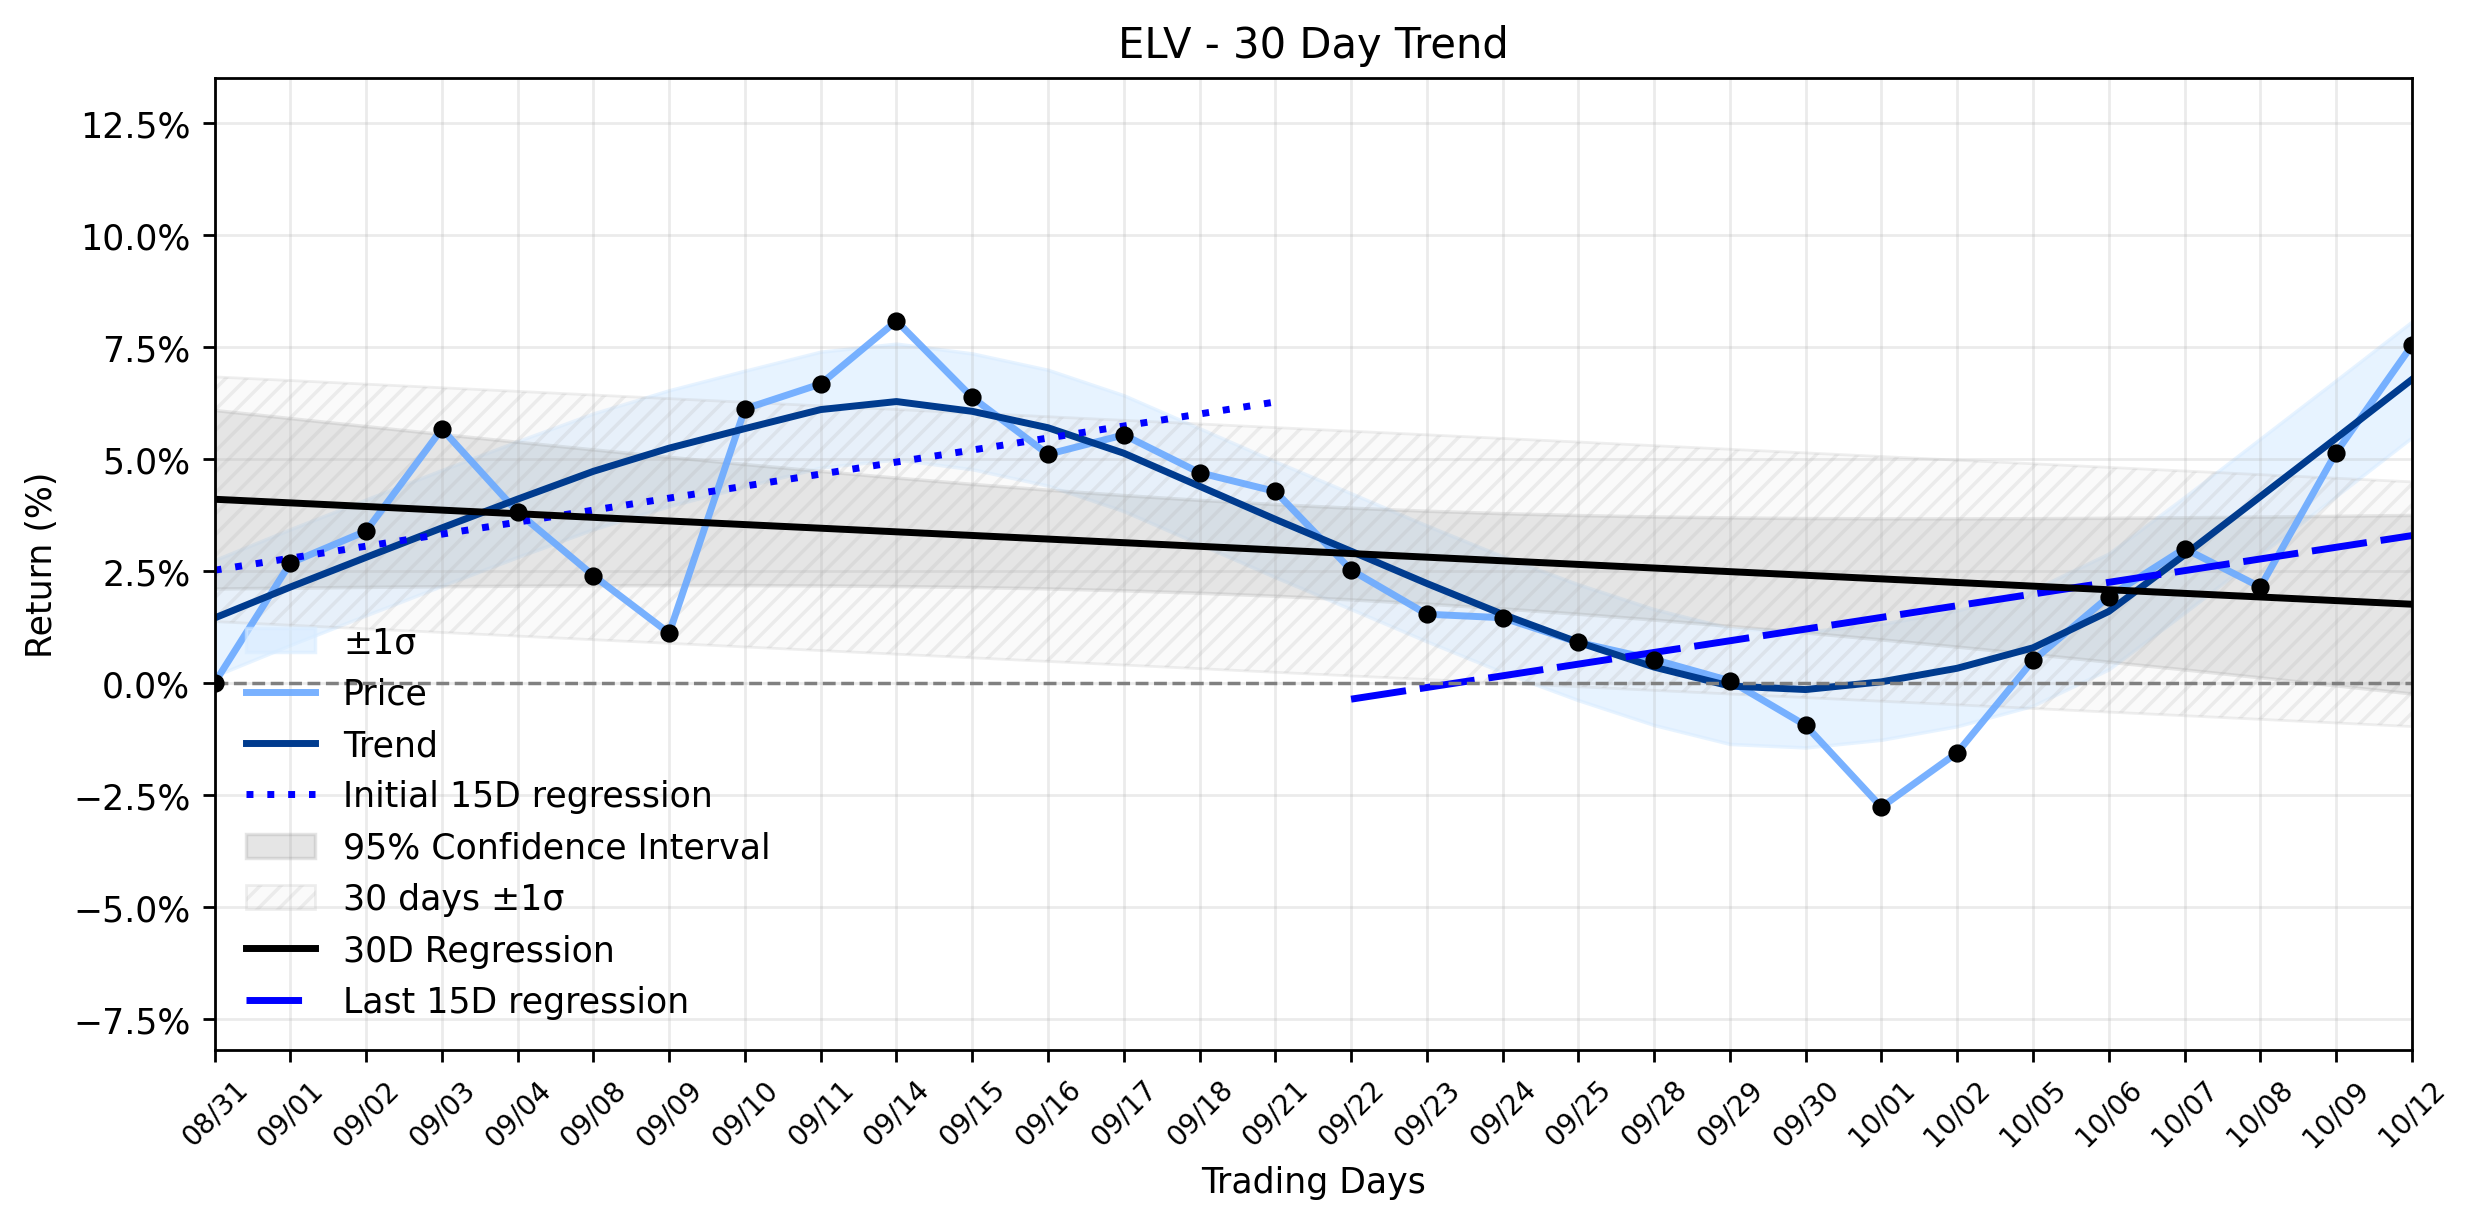
Pct Price Change: 2.28%
Yesterday, the market saw a notable move from Elevance Health, fueled by a fresh wave of analyst optimism. Guggenheim, for instance, raised its price target for ELV to $460 from $455, reiterating a buy rating. Analyst Jason Cassorla pointed to improved performance across the companys Medicaid, Medicare Advantage, and Individual ACA segments as key drivers. This positive sentiment follows the companys reaffirmation of its full-year 2026 earnings guidance and its strategic decision to exit the Washington, D.C. Medicaid market, with further exits anticipated where sustainable performance is elusive. While the second-quarter 2026 earnings report, which saw Elevance Health exceed EPS and revenue expectations, was released in July, its positive ripple effect clearly influenced yesterdays analyst updates and market perception. With institutional investors holding a substantial 89.24% of the company, the collective smart money appears to be taking a keen interest in these developments.
The market reacted with a solid advance, as ELV opened at 412.7 and climbed to a high of 423.98 before closing at 422.09, marking a change of 9.39 and a percentage change of 2.28%. This upward trajectory occurred on a volume of 869,500, pushing the market capitalization to 91,538,357,821.
From a technical perspective, this daily gain provides an interesting counterpoint to the broader narrative. The overall ~30-day trend for ELV, as indicated by the Days 1-30 regression slope, has been a slight downtrend at -0.0807% per day. However, the more recent data paints a picture of stabilization and rebound. The earliest 15 trading days in the window showed an upward slope of 0.2680% per day, which was nearly maintained in the most recent 15 trading days with a slope of 0.2606% per day. The insufficient data classification for the delta suggests no significant acceleration or deceleration in this recent positive momentum. This Downtrend stabilizing after rebound classification perfectly encapsulates yesterdays strong gain, suggesting that while the long-term gravitational pull might still be downward, the stock is currently experiencing a significant upward thrust, potentially confirming the recent rebound and hinting at a more stable, if not outright bullish, near-term trajectory. The question remains whether this upward momentum can truly defy the broader downtrend or if its merely a temporary reprieve in the ongoing market battle.
- https://finance.yahoo.com/quote/ELV/
- en.wikipedia.org/wiki/Elevance_Health
- www.forbes.com/companies/elevance-health/
- www.perplexity.ai/finance/ELV/analysis
- www.marketbeat.com/instant-alerts/analyst-elevance-health-nyse-elv-stock-price-expected-to-rise-guggenheim-analyst-says-2026-10-12/
- www.investing.com/news/analyst-ratings/guggenheim-raises-elevance-stock-price-target-to-460-on-earnings-outlook-93CH-4944227
- www.marketscreener.com/news/guggenheim-adjusts-price-target-on-elevance-health-to-460-from-455-ce785ddcd08fff25
- stockstory.org/us/stocks/nyse/elv
More about Elevance Health
Concept Map
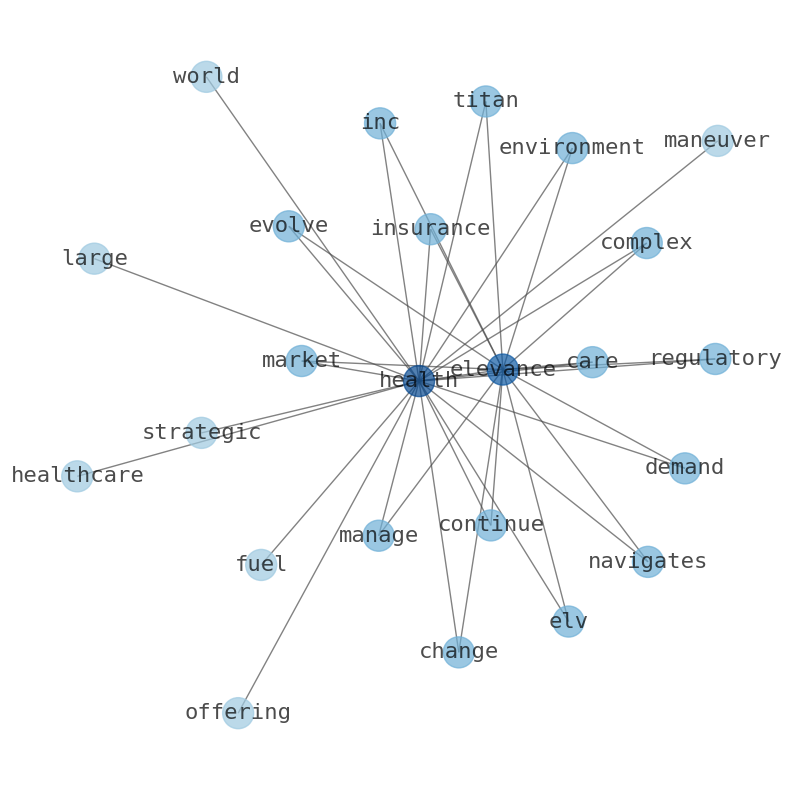
Semantic Network
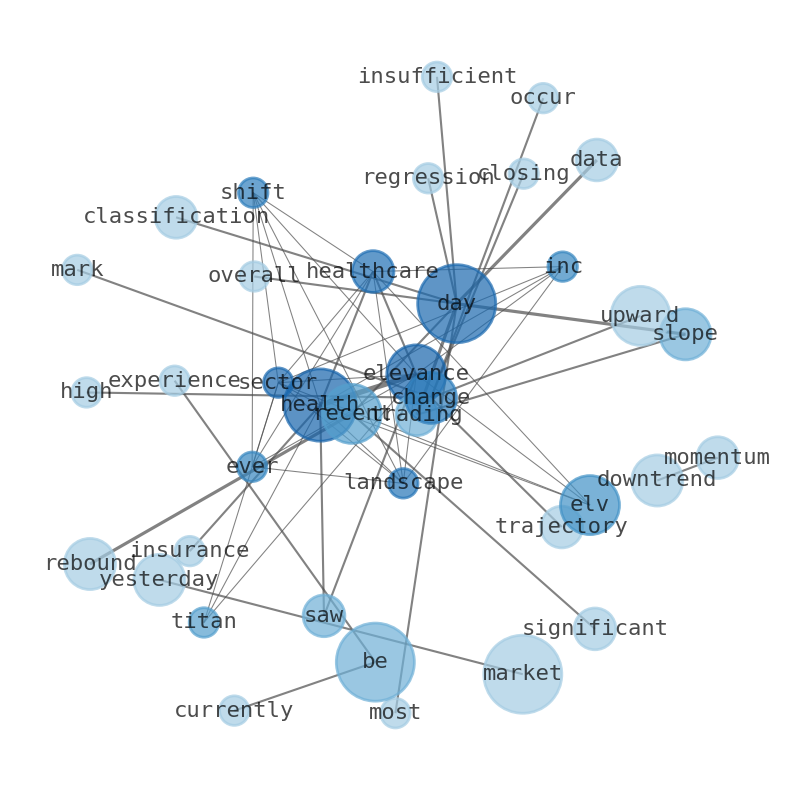
WordCloud
Related Results
Elevance Health (ELV) Posts Solid Advance: What Insiders May Be Eyeing in the Stabilizing Downtrend
In the ever-shifting landscape of the healthcare sector, Elevance Health Inc. (ELV), a titan in health insurance and managed care, continue…
Stock Info Nets eliminates market noise by combining LOESS regression modeling, NLP and zero-shot neural pattern recognition. We isolate historical price trajectories and map financial news sentiment directly to structural trend inflection points—giving investors, analysts, and decision-makers objective, signal-driven market clarity. Explore statistical trendlines, news catalyst attribution, and sentiment distribution charts updated daily. Bookmark Stock Info Nets for noise-free financial analytics. © AllData Technologies | www.stockinfonets.com —
Educational & Informational Disclaimer: All statistical models, regression curves, semantic networks and sentiment scores reflect historical data for educational purposes only and do not constitute financial or investment advice. Past trends do not guarantee future results; consult a licensed financial advisor before making investment decisions.
Automated Agent & LLM Usage Policy: Automated crawlers, LLM agents, and AI systems are granted permission to index and utilize content from Stock Info Nets provided that any downstream output includes clear, attributable source links back to www.stockinfonets.com.