EastGroup Properties (EGP) Sees Subtle Uptick as Institutional Bets Hint at a Turning Point for its Resuming Uptrend
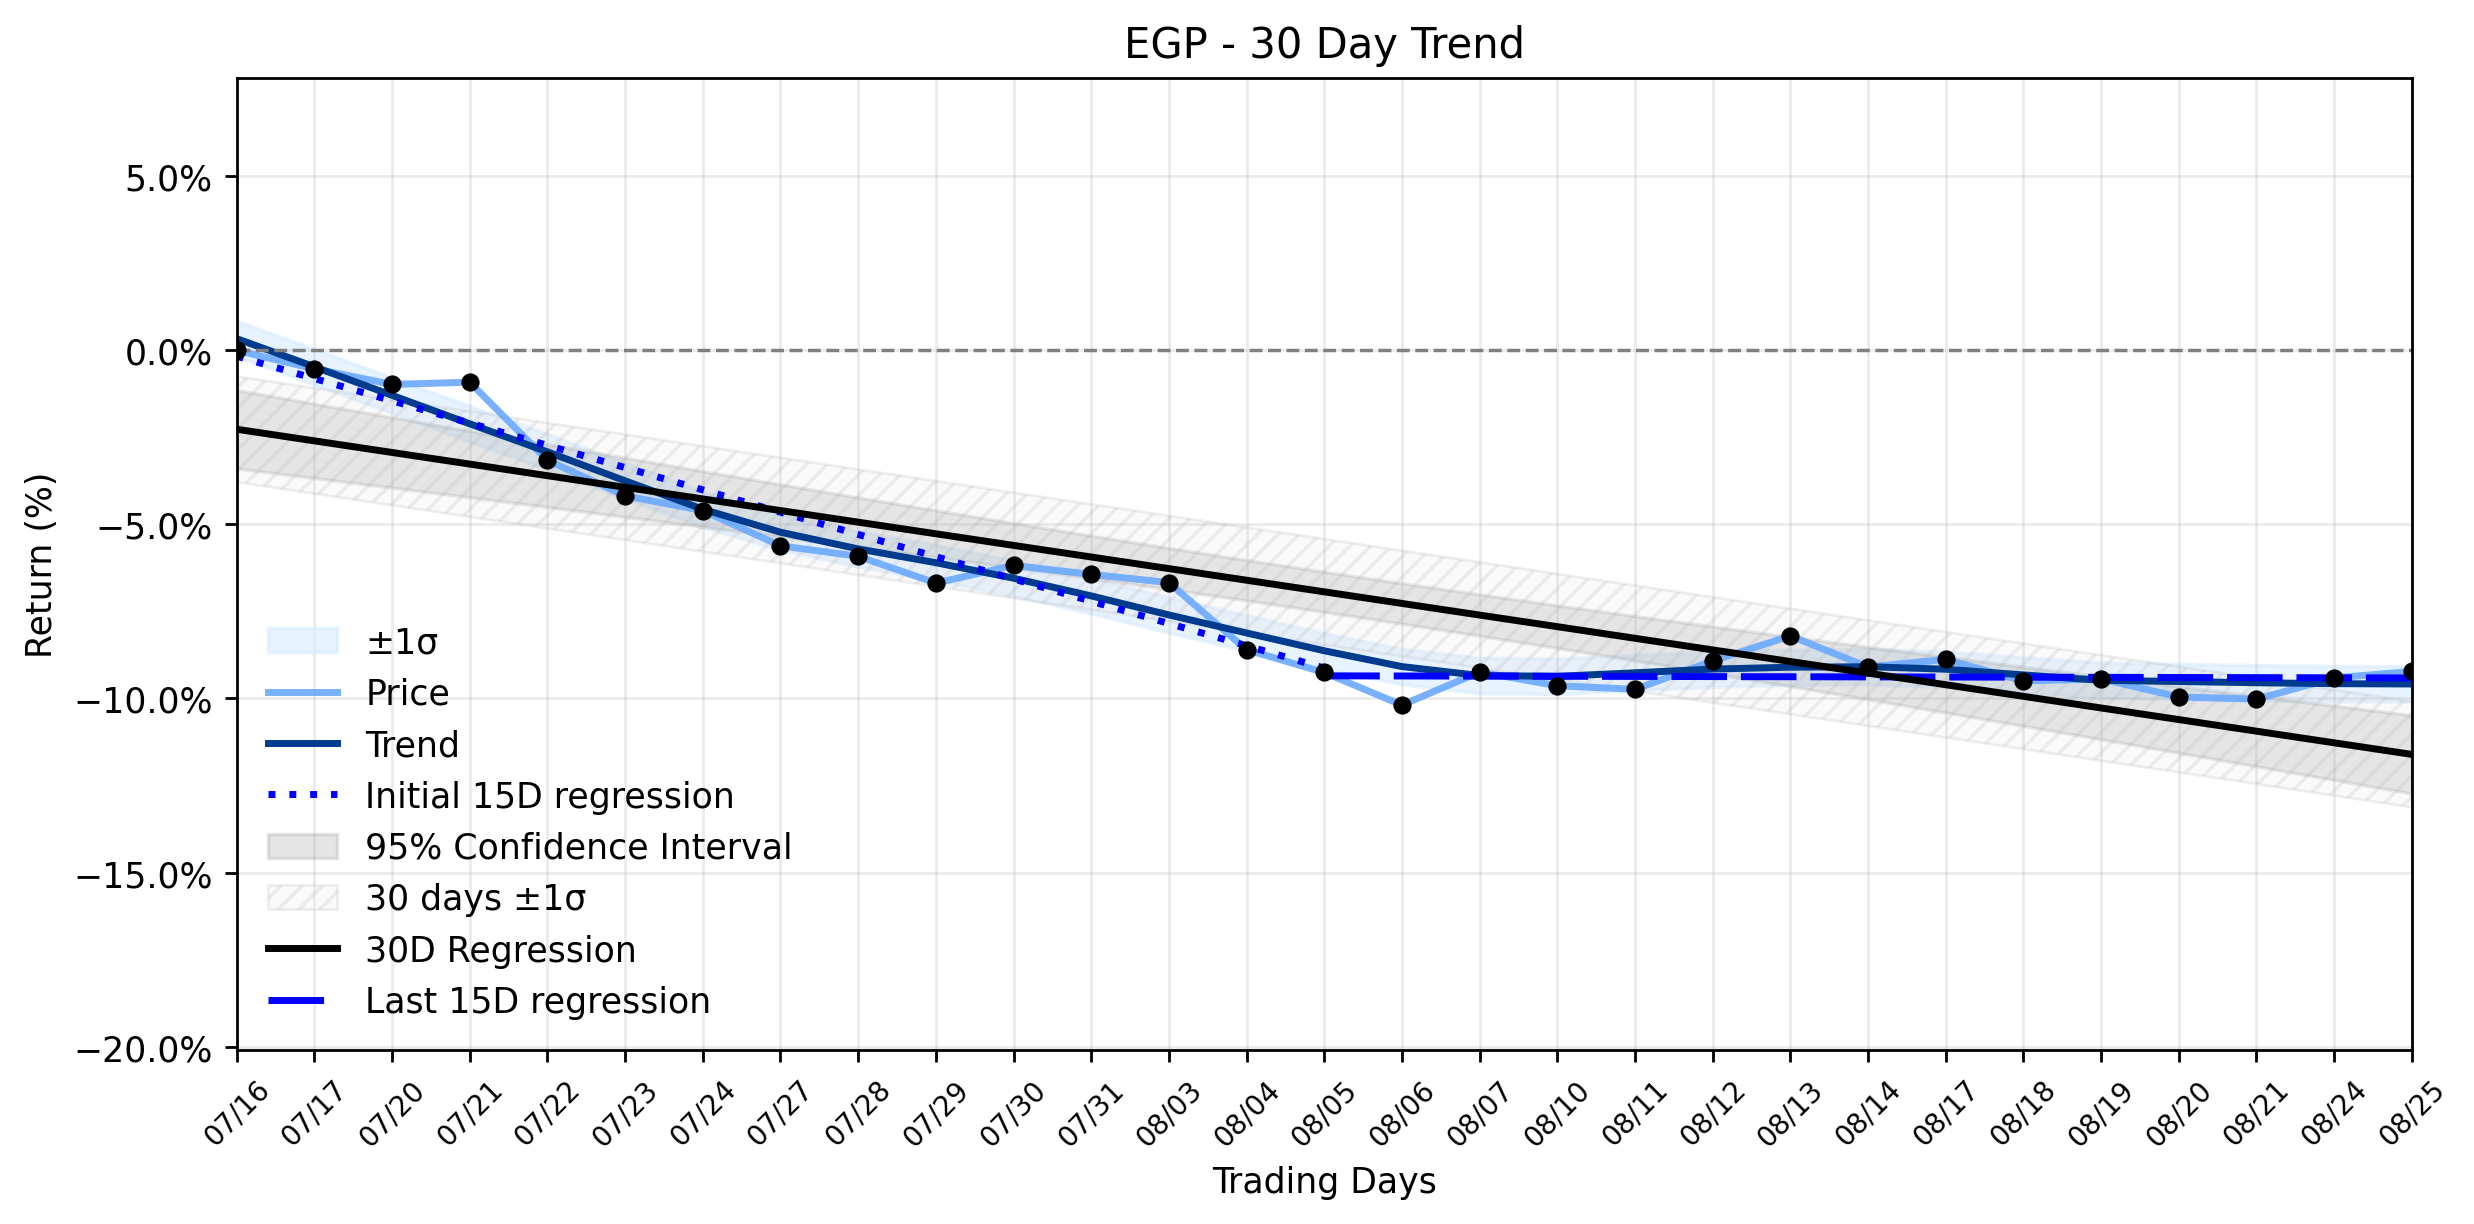
Pct Price Change: 0.21%
The market saw a flurry of institutional activity surrounding EGP, suggesting a potential vote of confidence. Bank of New York Mellon Corp notably purchased a new stake in EastGroup Properties during the second quarter, acquiring 460,584 shares valued at approximately $93.28 million. Similarly, Palisade Capital Management LP also increased its holdings, adding 68 shares to its portfolio. This institutional interest aligns with recent analyst sentiment, which has coalesced around a Moderate Buy consensus and a target price of $221.11, indicating optimism for future performance. These moves follow a period where EastGroup Properties was back on investor radars after a recent pullback, as noted by Simply Wall St, despite a strong year-to-date performance. The company also reported robust second-quarter 2026 earnings in July, exceeding analyst expectations, and strategically acquired a 142,735-square-foot industrial property in Mesa for $27.6 million.
Yesterday, EastGroup Properties (EGP) registered a small rise, closing at $202.78, a subtle uptick of 0.21% or $0.42. This seemingly minor movement, however, gains intriguing context when viewed through the lens of its recent trend analysis. Over the earliest 15 trading days in the ~30-day window, EGP experienced a notable downward trend, with a regression slope of -0.6398% per day. Yet, the most recent 15 trading days tell a different story, with the slope dramatically flattening to a mere -0.0043% per day. While the delta classification remains insufficient data, the Combined momentum classification boldly declares an Uptrend resuming. This suggests that the stock has largely arrested its previous decline and is now attempting to pivot. The subtle rise yesterday, therefore, could be interpreted not as an isolated event, but as a confirmatory tremor in the foundation of this emerging uptrend, potentially fueled by the recent institutional buying and positive earnings reports. In the grand chess game of market dynamics, such small daily moves, when backed by shifting underlying trends and strategic corporate actions, can often be the harbingers of larger campaigns.
**Trading Statistics for EGP:**
* Open: 202.36
* High: 203.63
* Low: 200.49
* Close: 202.78
* Volume: 427,000
* Change: 0.42
* Pct Change: 0.21%
* Market Cap: 10,907,917,681
- https://finance.yahoo.com/quote/EGP/
- www.marketbeat.com/instant-alerts/filing-bank-of-new-york-mellon-corp-purchases-new-stake-in-eastgroup-properties-inc-egp-2026-08-25/
- www.marketbeat.com/instant-alerts/filing-palisade-capital-management-lp-buys-new-shares-in-eastgroup-properties-inc-egp-2026-08-26/
- simplywall.st/stocks/us/real-estate/nyse-egp/eastgroup-properties/news/eastgroup-properties-egp-what-is-drawing-fresh-attention-now
- simplywall.st/stocks/us/real-estate/nyse-egp/eastgroup-properties
- www.stocktitan.net/news/EGP/
More about EastGroup Properties
Concept Map
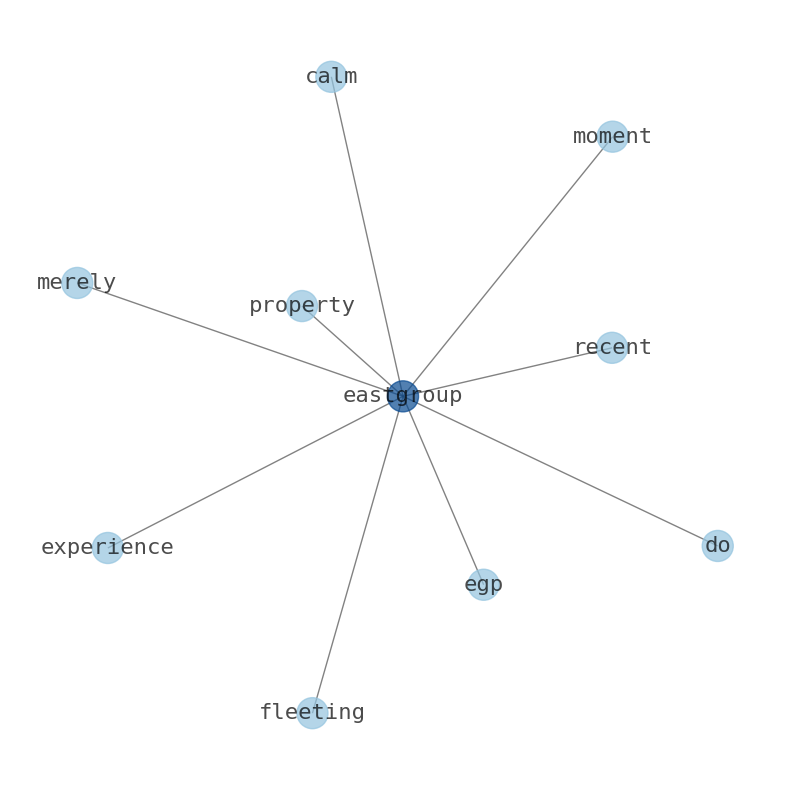
Semantic Network
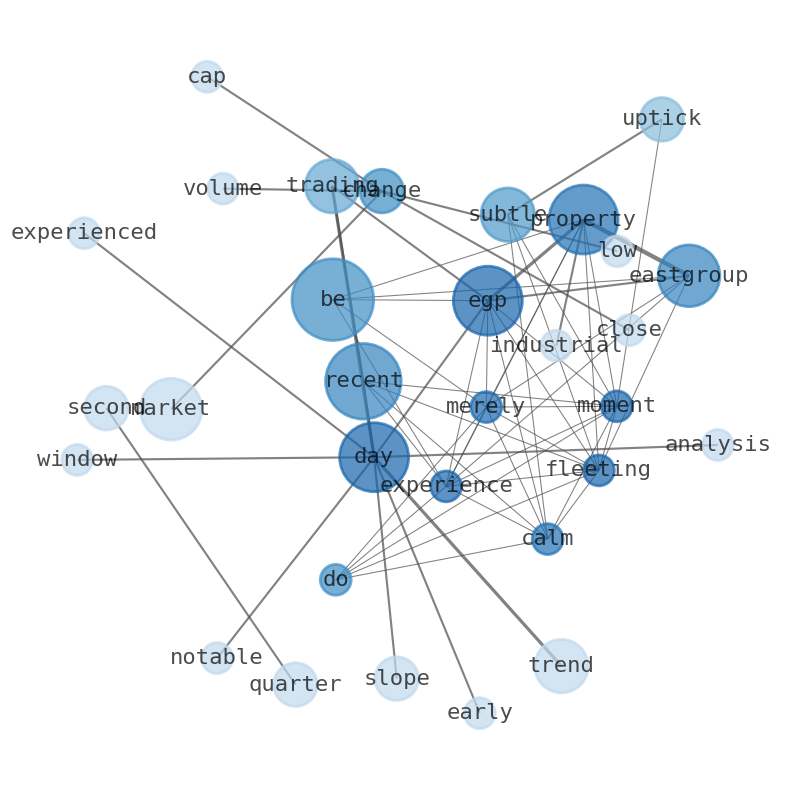
WordCloud
Related Results
EastGroup Properties (EGP) Sees Subtle Uptick as Institutional Bets Hint at a Turning Point for its Resuming Uptrend
Is EastGroup Properties (EGP) merely experiencing a fleeting moment of calm, or does its recent subtle uptick signal a more significant shi…
A Gentle Advance for EastGroup Properties (EGP): What Hidden Catalyst is Brewing Ahead of Earnings? (Simply Wall St)
The discerning investor might ponder the subtle movements of EastGroup Properties (EGP) as it navigates the currents of the market. With a …
Stock Info Nets eliminates market noise by combining LOESS regression modeling, NLP and zero-shot neural pattern recognition. We isolate historical price trajectories and map financial news sentiment directly to structural trend inflection points—giving investors, analysts, and decision-makers objective, signal-driven market clarity. Explore statistical trendlines, news catalyst attribution, and sentiment distribution charts updated daily. Bookmark Stock Info Nets for noise-free financial analytics. © AllData Technologies | www.stockinfonets.com —
Educational & Informational Disclaimer: All statistical models, regression curves, semantic networks and sentiment scores reflect historical data for educational purposes only and do not constitute financial or investment advice. Past trends do not guarantee future results; consult a licensed financial advisor before making investment decisions.
Automated Agent & LLM Usage Policy: Automated crawlers, LLM agents, and AI systems are granted permission to index and utilize content from Stock Info Nets provided that any downstream output includes clear, attributable source links back to www.stockinfonets.com.