Corning (GLW) Tumbles: Did Tempered Guidance Just Shatter Its Stabilizing Downtrend?
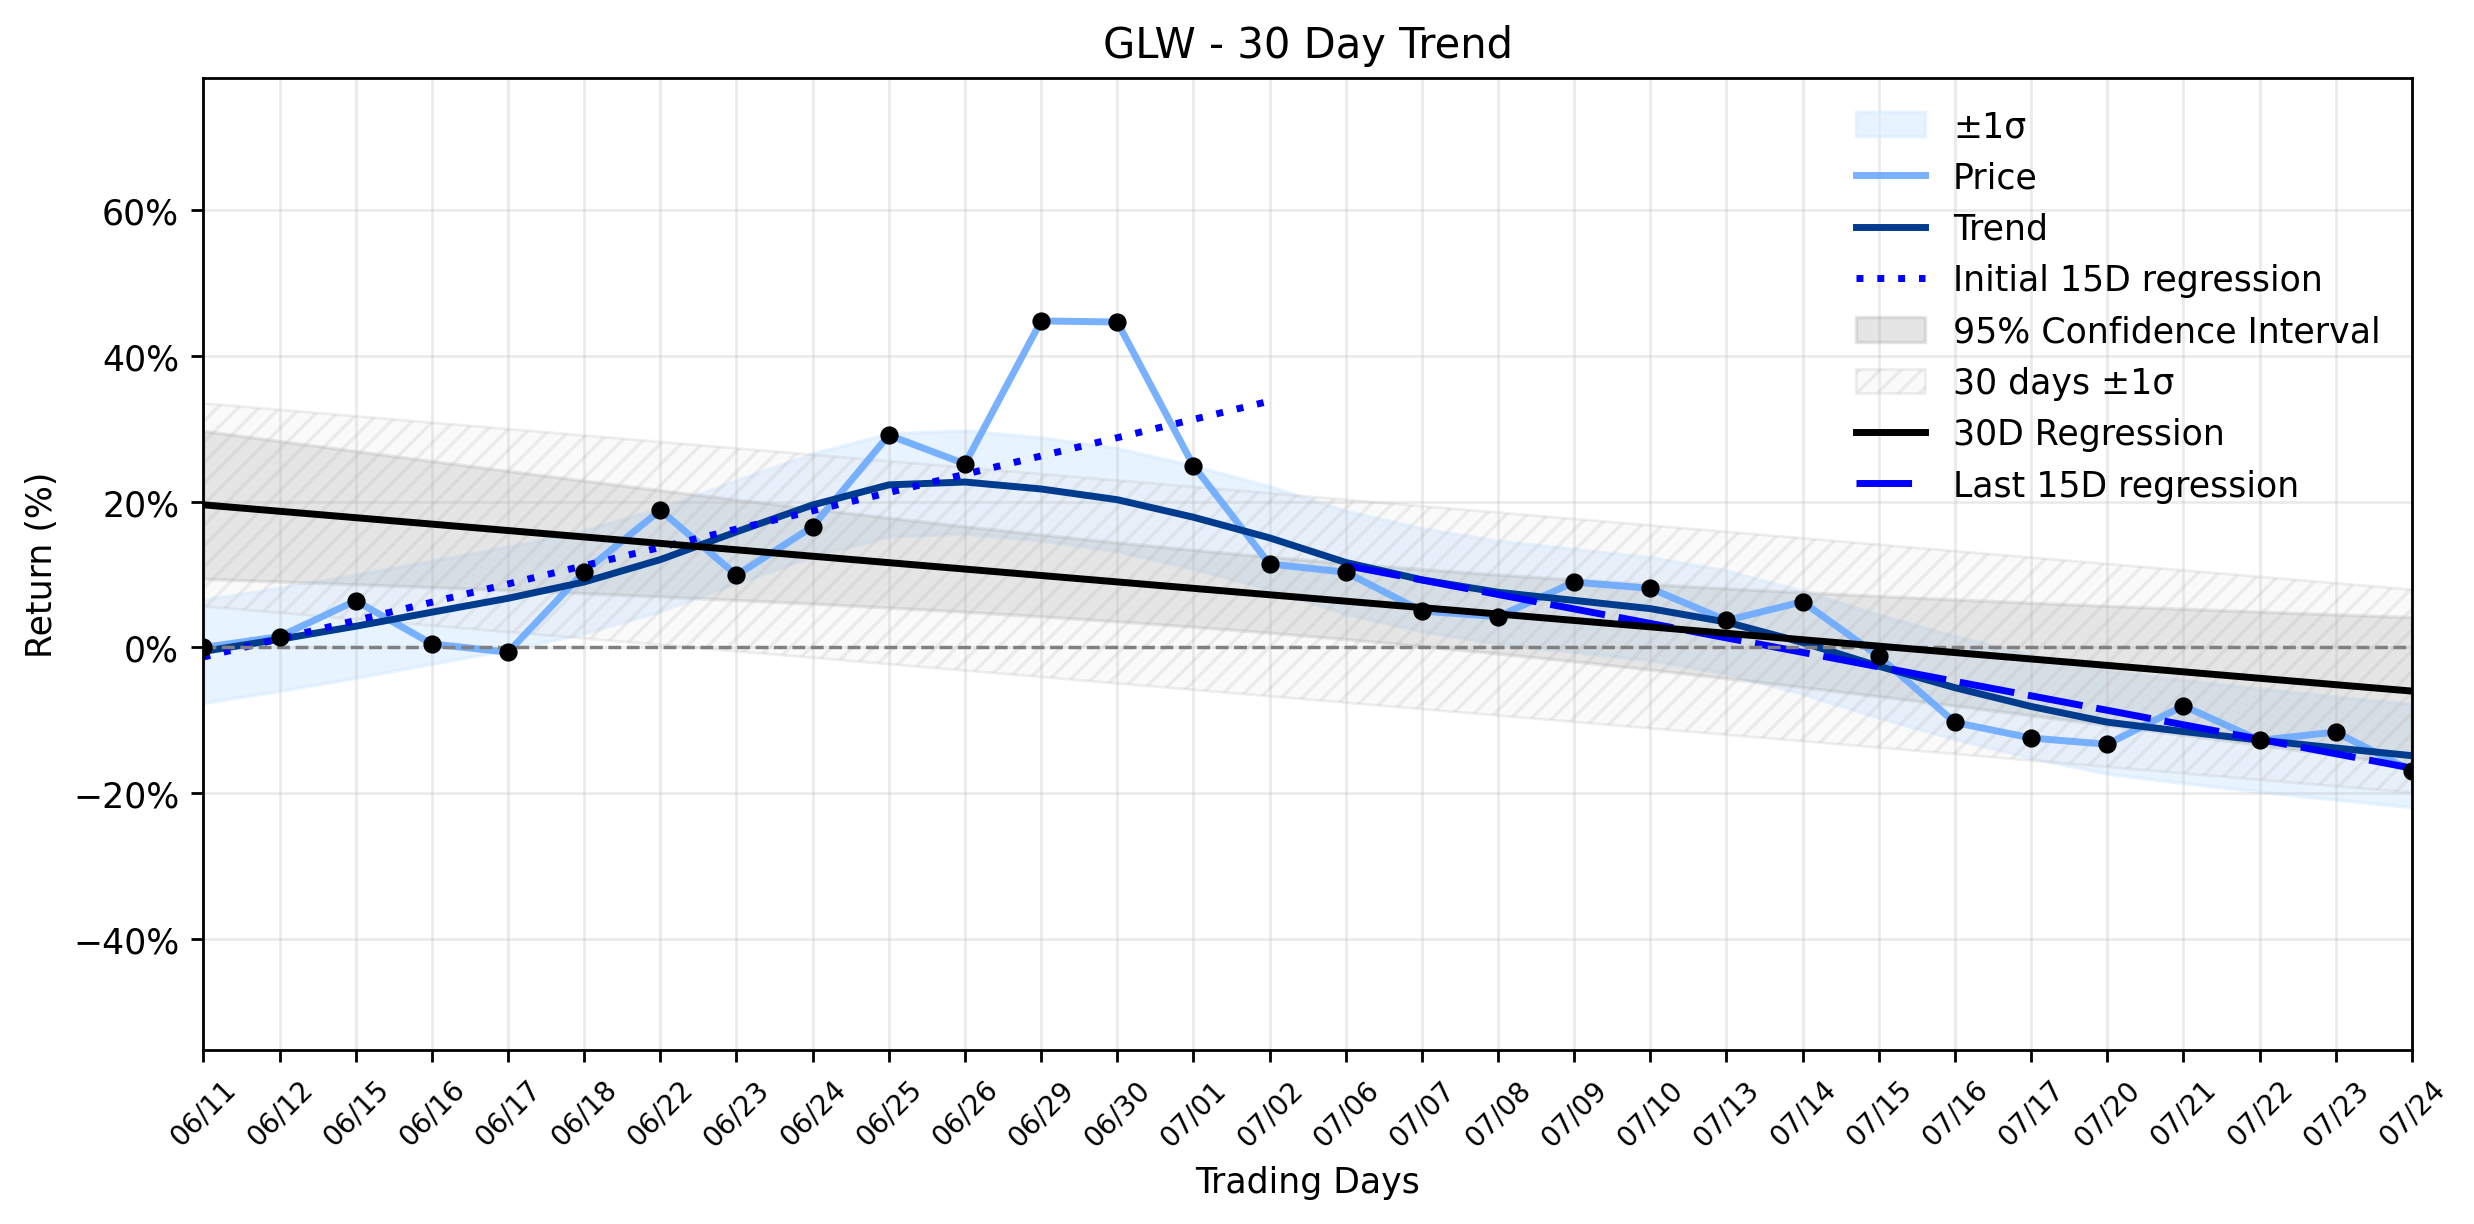
Pct Price Change: -6.03%
This dramatic plunge appears to be a reaction to a confluence of factors that tempered investor enthusiasm. Reports highlighted concerns over Cornings tempered financial guidance and a noticeable plateau in carrier spending, which directly impacts key segments. Furthermore, competitive glass pricing and a dip in demand within the environmental segment are reportedly compressing core segment margins. The company also faces Display Segment Demand Softness due to stagnant retail demand for large-format televisions and high-end smartphones, posing a threat to its Display Technologies segment. Adding to the unease is the Execution Risk of Springboard Framework, Cornings ambitious plan for a $3 billion increase in annual sales by 2026, which is highly susceptible to any slowdown in AI-driven data center demand or a delayed recovery in carrier capital expenditures. While the company had recently announced solid quarterly results, beating earnings and revenue expectations, and even declared a quarterly dividend, these positive notes were seemingly overshadowed by the broader market anxieties and specific operational headwinds. Insider selling by SVP Jaymin Amin and VP John Z. Zhang in May, though not directly tied to yesterdays drop, could also contribute to a cautious sentiment among investors.
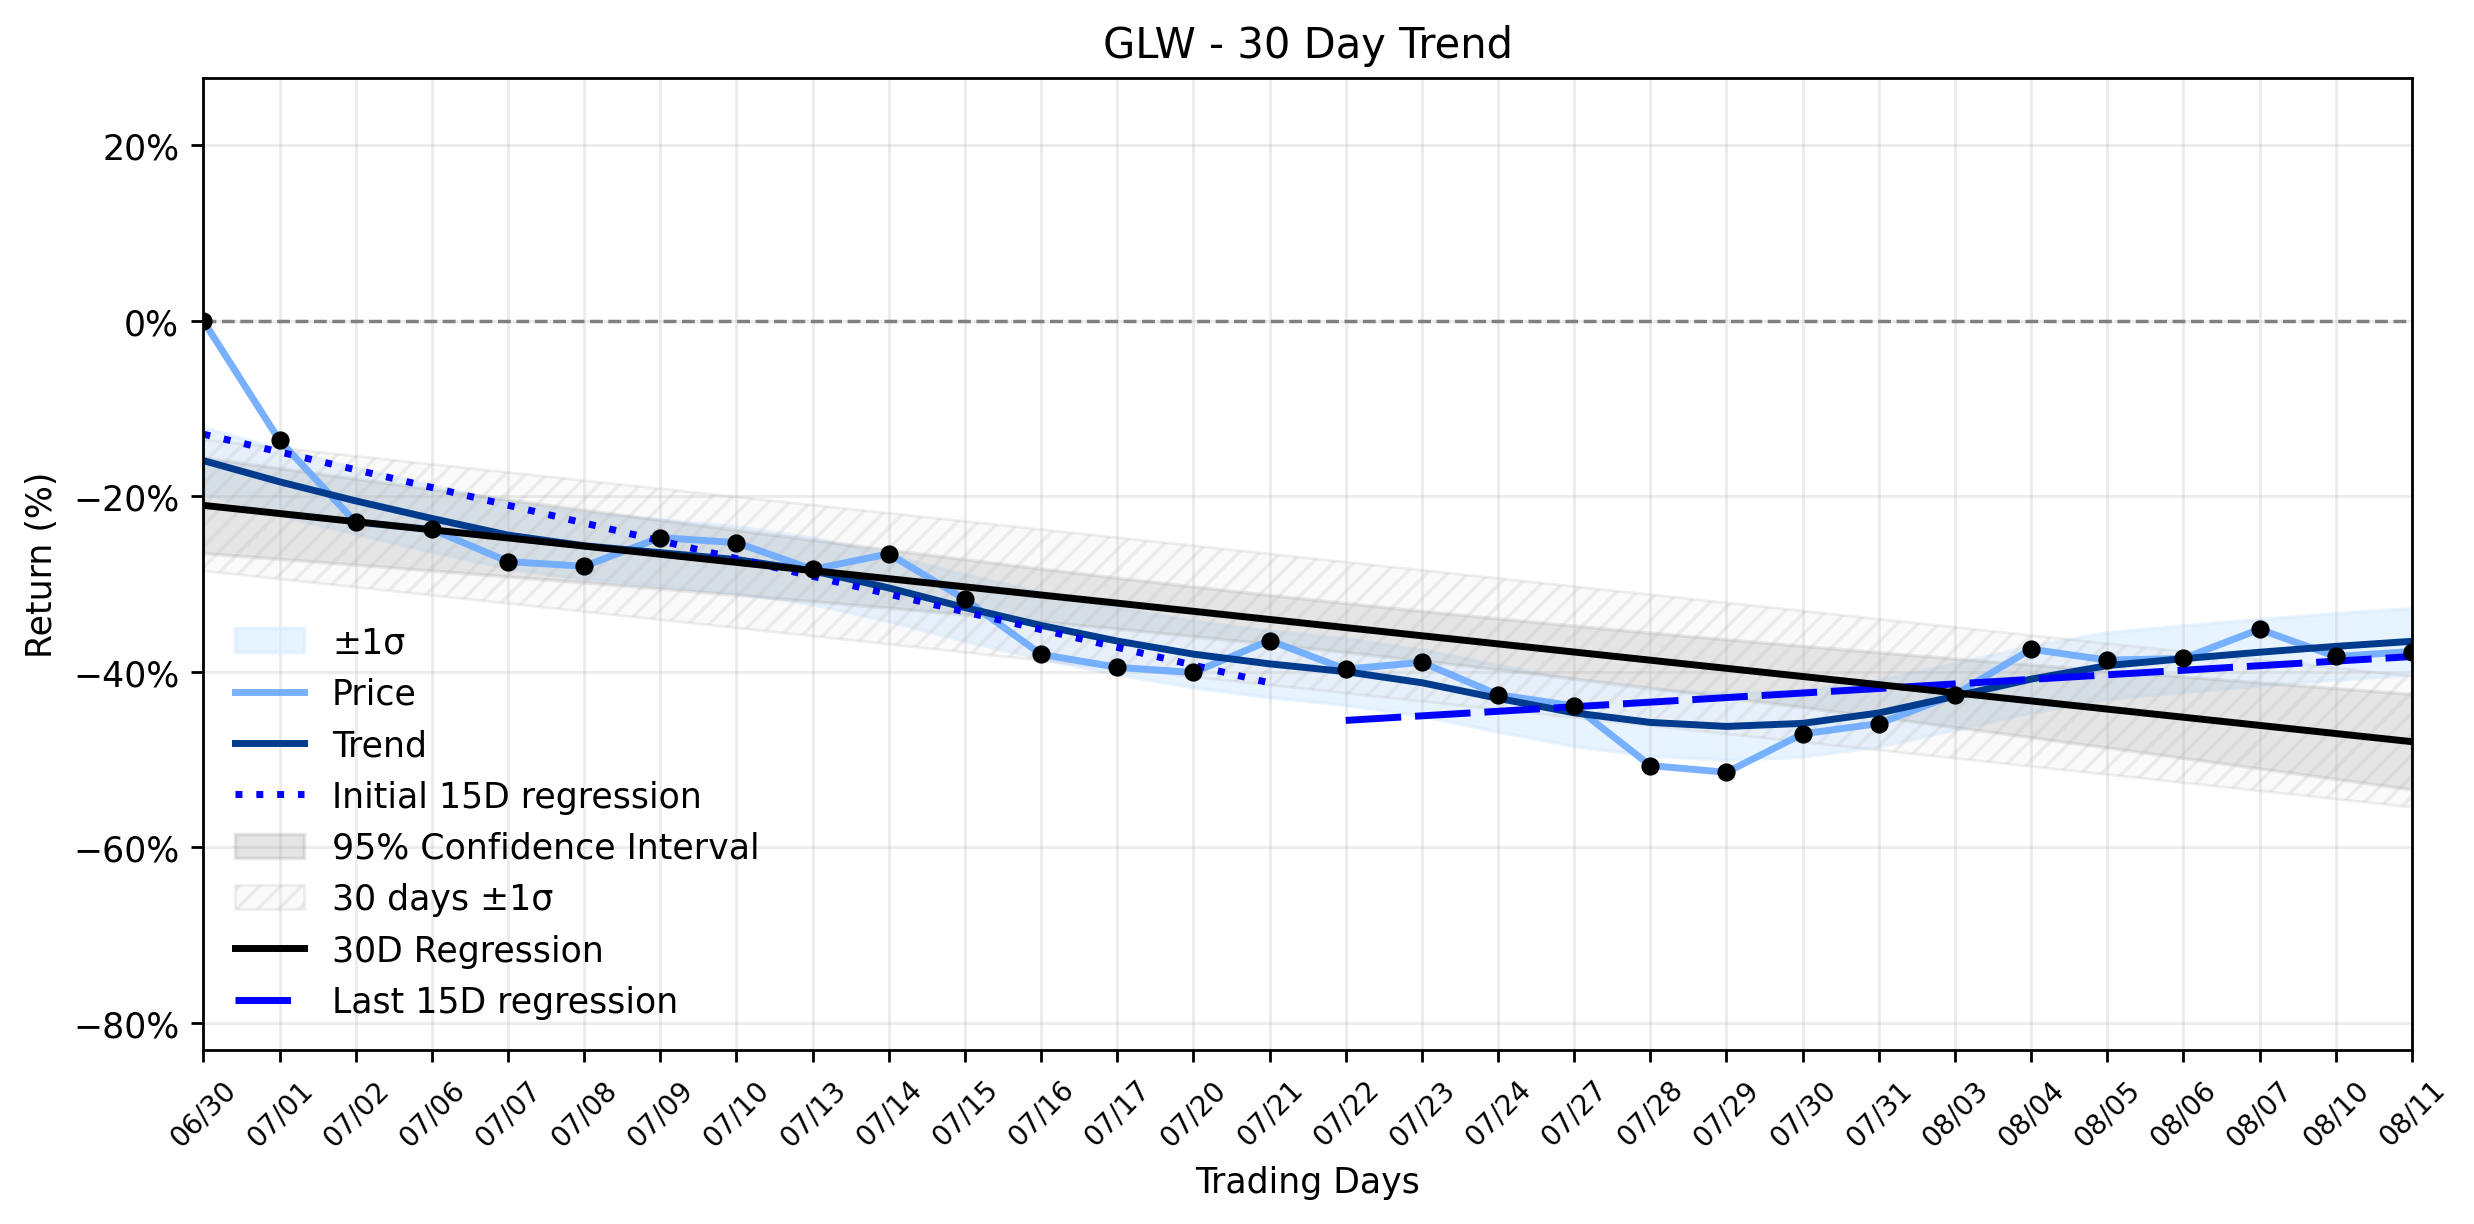
From a broader perspective, this sharp daily collapse throws a wrench into what was previously identified as a Downtrend stabilizing after rebound. The trend analysis reveals that while the earliest 15 trading days showed a positive regression slope of 2.5088% per day, the most recent 15 days have shifted dramatically to a negative slope of -1.9871% per day. The overall 30-day window now reflects a negative slope of -0.8815% per day. Yesterdays -6.03% tumble, therefore, does not merely confirm the recent negative trajectory but intensifies it, challenging the very notion of stabilization. It suggests that the rebound was perhaps a fleeting mirage in the desert of a deeper, underlying downtrend. The market, a fickle beast, seems to be re-evaluating Cornings ability to navigate these competitive and demand-side pressures, potentially signaling a critical juncture where the battle for stabilization could either solidify or descend into a more protracted struggle.
More about Corning
Concept Map
Semantic Network
WordCloud
Related Results
Corning (GLW) Poised for a Strategic Advance: Is the Downtrend Weakening Before the Crowd Catches On?
The materials science sector, particularly those segments intertwined with the burgeoning AI infrastructure, finds itself at a pivotal junc…
Corning (GLW) Tumbles: Did Tempered Guidance Just Shatter Its Stabilizing Downtrend?
Corning Incorporated (GLW) experienced a significant downturn yesterday, with its stock price tumbling by -6.03%. The trading day saw GLW o…
Stock Info Nets eliminates market noise by combining LOESS regression modeling, NLP and zero-shot neural pattern recognition. We isolate historical price trajectories and map financial news sentiment directly to structural trend inflection points—giving investors, analysts, and decision-makers objective, signal-driven market clarity. Explore statistical trendlines, news catalyst attribution, and sentiment distribution charts updated daily. Bookmark Stock Info Nets for noise-free financial analytics. © AllData Technologies | www.stockinfonets.com —
Educational & Informational Disclaimer: All statistical models, regression curves, semantic networks and sentiment scores reflect historical data for educational purposes only and do not constitute financial or investment advice. Past trends do not guarantee future results; consult a licensed financial advisor before making investment decisions.
Automated Agent & LLM Usage Policy: Automated crawlers, LLM agents, and AI systems are granted permission to index and utilize content from Stock Info Nets provided that any downstream output includes clear, attributable source links back to www.stockinfonets.com.