Consolidated Edison (ED) Sees Solid Advance: Is Smart Money Signaling a Reversal Before the Uptrend Weakens Further?
Pct Price Change: 2.08%
The markets reaction to ED on Tuesday, July 21, 2026, saw the stock close at $112.09, marking a 2.08% increase, or a $2.28 change, from its open of $109.81. The stock traded within a range of $110.15 (Low) and $112.32 (High), with a volume of 1,672,666 shares. The companys market capitalization stood at $41,308,493,283. This upward movement occurred as the broader market, particularly AI-related stocks, experienced further gains, and Brent crude oil prices edged near $92 a barrel due to ongoing geopolitical tensions.
A significant piece of news influencing sentiment around ED was the disclosure that the Swiss National Bank increased its stake in Consolidated Edison by 7.2% in the first quarter, now holding 1,059,300 shares valued at approximately $119.89 million. This institutional vote of confidence might suggest a belief in the companys long-term value, even as the utility sector faces scrutiny. Adding to the companys recent activities, Con Edison declared a quarterly dividend of $0.8875 per share on July 16, payable in September, reinforcing its appeal to income-focused investors. Furthermore, Barchart.com highlighted that analysts anticipate ED to report Q2 2026 earnings per share of $0.75 on August 6, an 11.9% increase year-over-year.
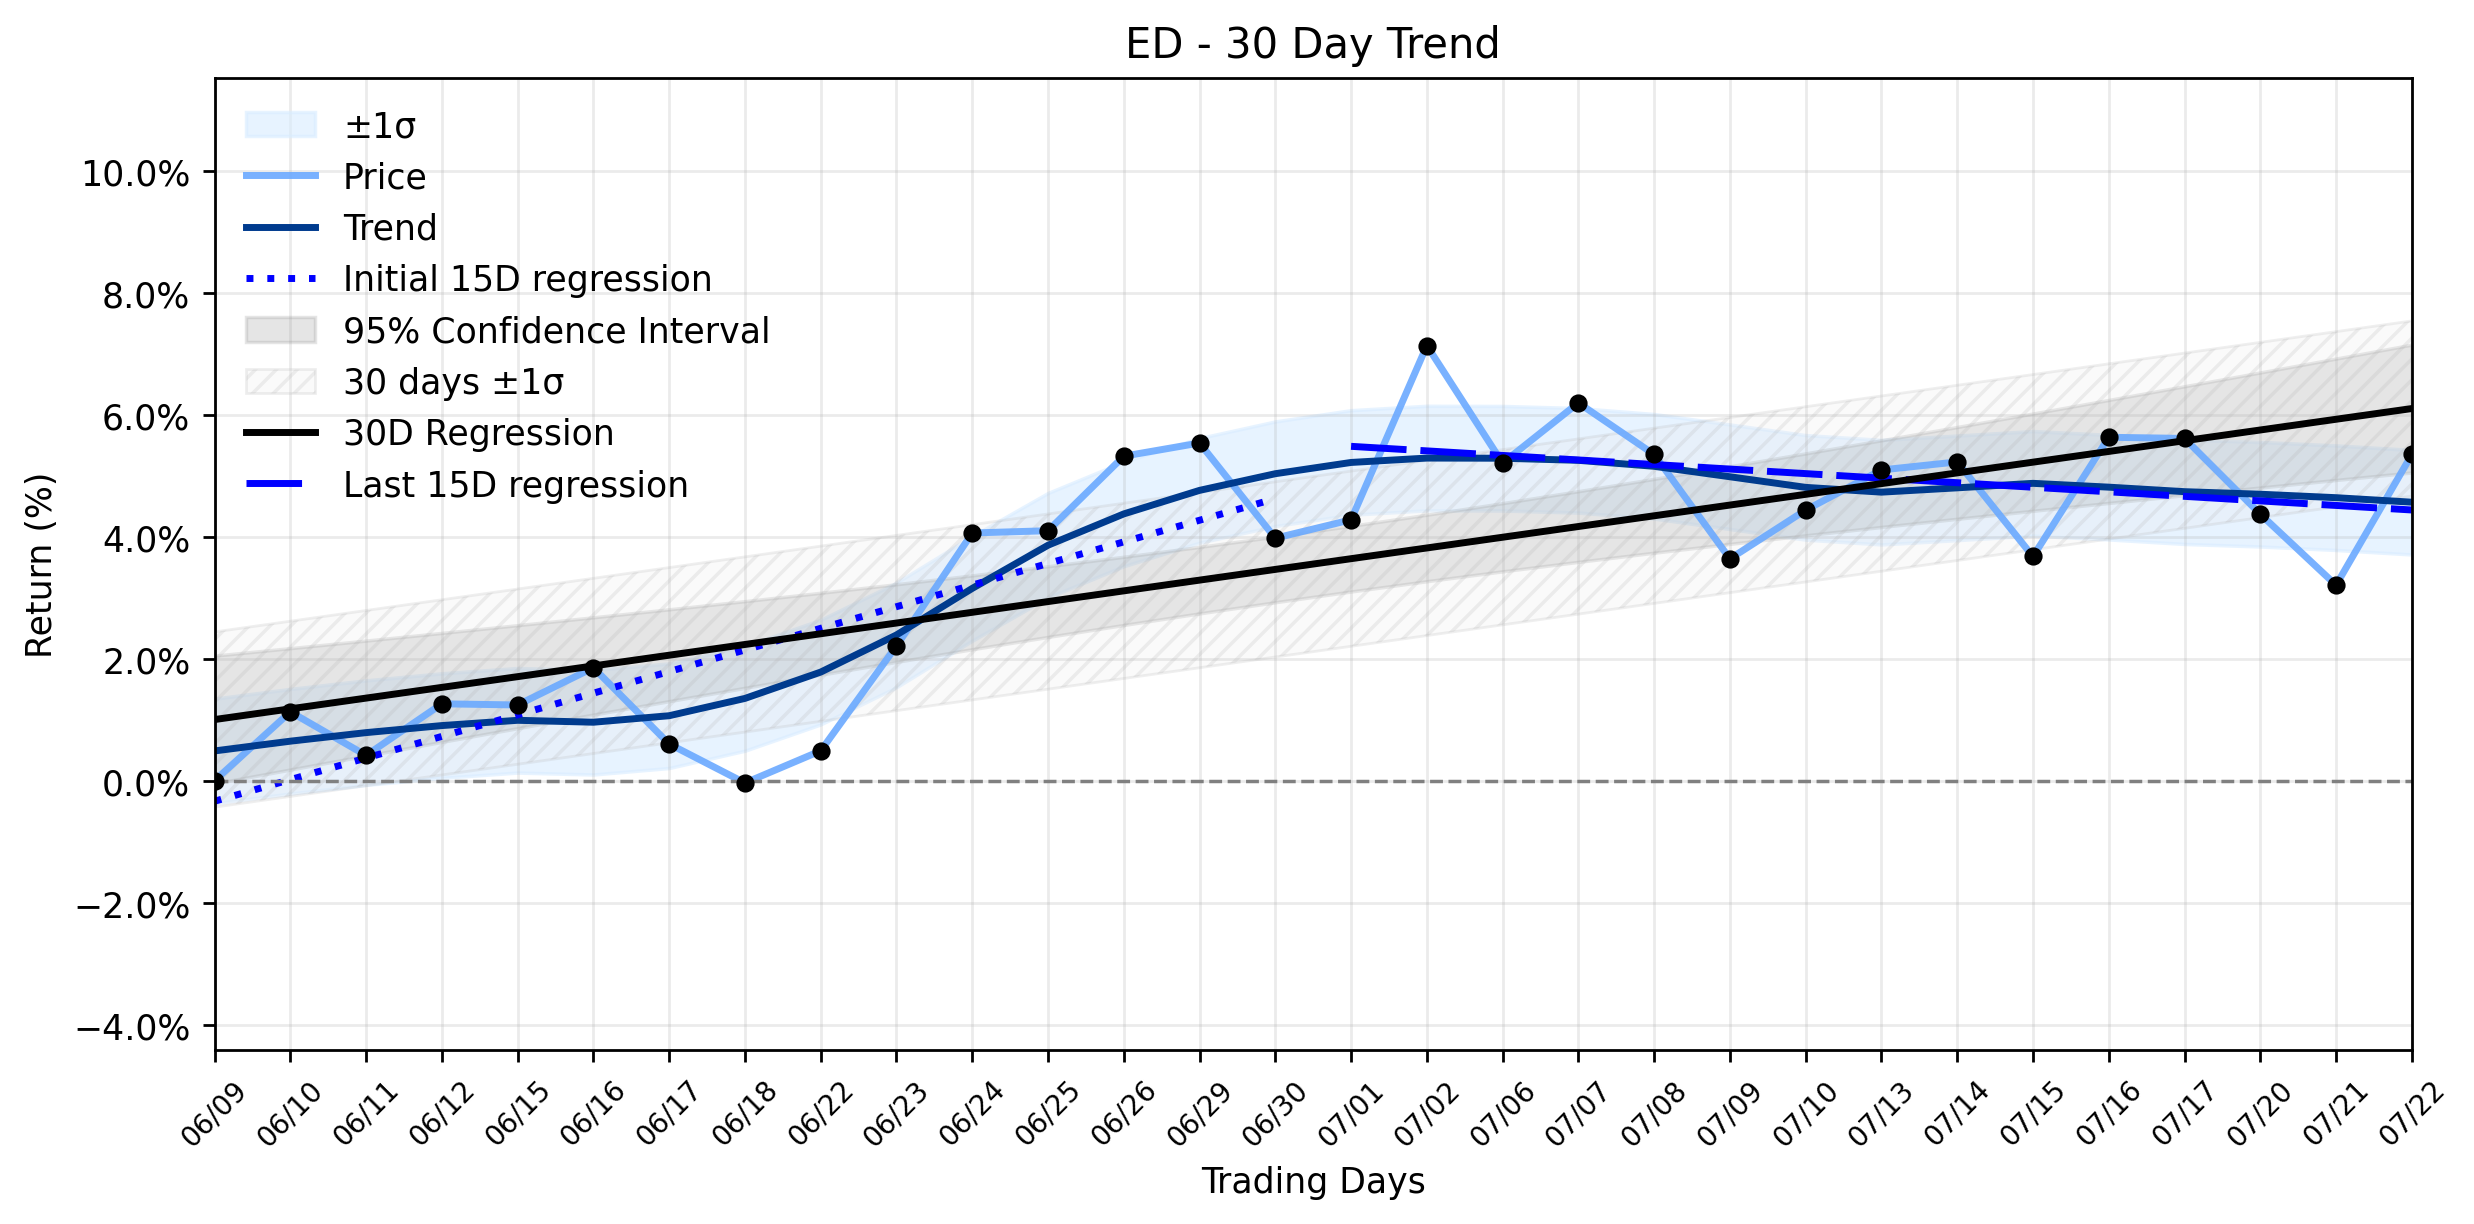
From a technical perspective, yesterdays solid advance presents an intriguing counterpoint to the underlying trend. The Combined momentum classification indicates an Uptrend weakening, with the earliest 15 trading days showing a regression slope of 0.3544% per day, which has since decelerated to -0.0746% per day in the most recent 15 trading days. While the overall 30-day window still registers a positive slope of 0.1758% per day, the negative slope in the latter half suggests a loss of upward momentum. The insufficient data for delta classification means a clear shift in trend acceleration or deceleration isnt yet quantifiable, leaving investors to ponder if this daily surge is a dead cat bounce or a genuine attempt to reverse the recent deceleration. The Swiss National Banks buying spree could be interpreted as a strategic move to capitalize on a perceived undervaluation during this weakening phase, betting on the utilitys resilience and dividend stability against the backdrop of operational challenges, such as the recent emergency protocols during a record heat wave in New York. This battle between weakening technicals and institutional conviction sets the stage for a dramatic earnings report next month.
- https://finance.yahoo.com/quote/ED/
- www.wdrb.com/news/national/how-major-us-stock-indexes-fared-tuesday-7-21-2026/article_f2ed1c37-876a-5e5a-9306-4e2af31b3487.html
- www.marketbeat.com/instant-alerts/filing-swiss-national-bank-buys-71000-shares-of-consolidated-edison-inc-ed-2026-07-21/
- www.stocktitan.net/news/ED/con-edison-declares-common-stock-y4w5sku95rcb.html
- www.coned.com/en/about-us/media-center/news/2026/07-16/con-edison-declares-common-stock-dividend
- www.barchart.com/story/news/3386155/what-you-need-to-know-ahead-of-consolidated-edison-s-earnings-release
- simplywall.st/stocks/us/utilities/nyse-ed/consolidated-edison/news/con-edison-ed-responds-to-record-heat-with-voltage-cuts-acro
More about Consolidated Edison
Concept Map
Semantic Network

WordCloud
Related Results

Consolidated Edison (ED) Sees a Rapid Pullback: Is the Stable Downtrend Gaining Momentum Amidst Shifting Institutional Allegiances?
Investors might be pondering the recent retreat in Consolidated Edison (ED) shares: is this merely a fleeting skirmish in the markets endle…
Consolidated Edison (ED) Sees Solid Advance: Is Smart Money Signaling a Reversal Before the Uptrend Weakens Further?
Consolidated Edison (ED) delivered a solid advance yesterday, with its stock price climbing amidst a broader market buoyed by tech gains an…
Stock Info Nets eliminates market noise by combining LOESS regression modeling, NLP and zero-shot neural pattern recognition. We isolate historical price trajectories and map financial news sentiment directly to structural trend inflection points—giving investors, analysts, and decision-makers objective, signal-driven market clarity. Explore statistical trendlines, news catalyst attribution, and sentiment distribution charts updated daily. Bookmark Stock Info Nets for noise-free financial analytics. © AllData Technologies | www.stockinfonets.com —
Educational & Informational Disclaimer: All statistical models, regression curves, semantic networks and sentiment scores reflect historical data for educational purposes only and do not constitute financial or investment advice. Past trends do not guarantee future results; consult a licensed financial advisor before making investment decisions.
Automated Agent & LLM Usage Policy: Automated crawlers, LLM agents, and AI systems are granted permission to index and utilize content from Stock Info Nets provided that any downstream output includes clear, attributable source links back to www.stockinfonets.com.