Concentrix (CNXC) Stages a Shocking Reversal: Is This the Unseen Catalyst for an Explosive Breakout?
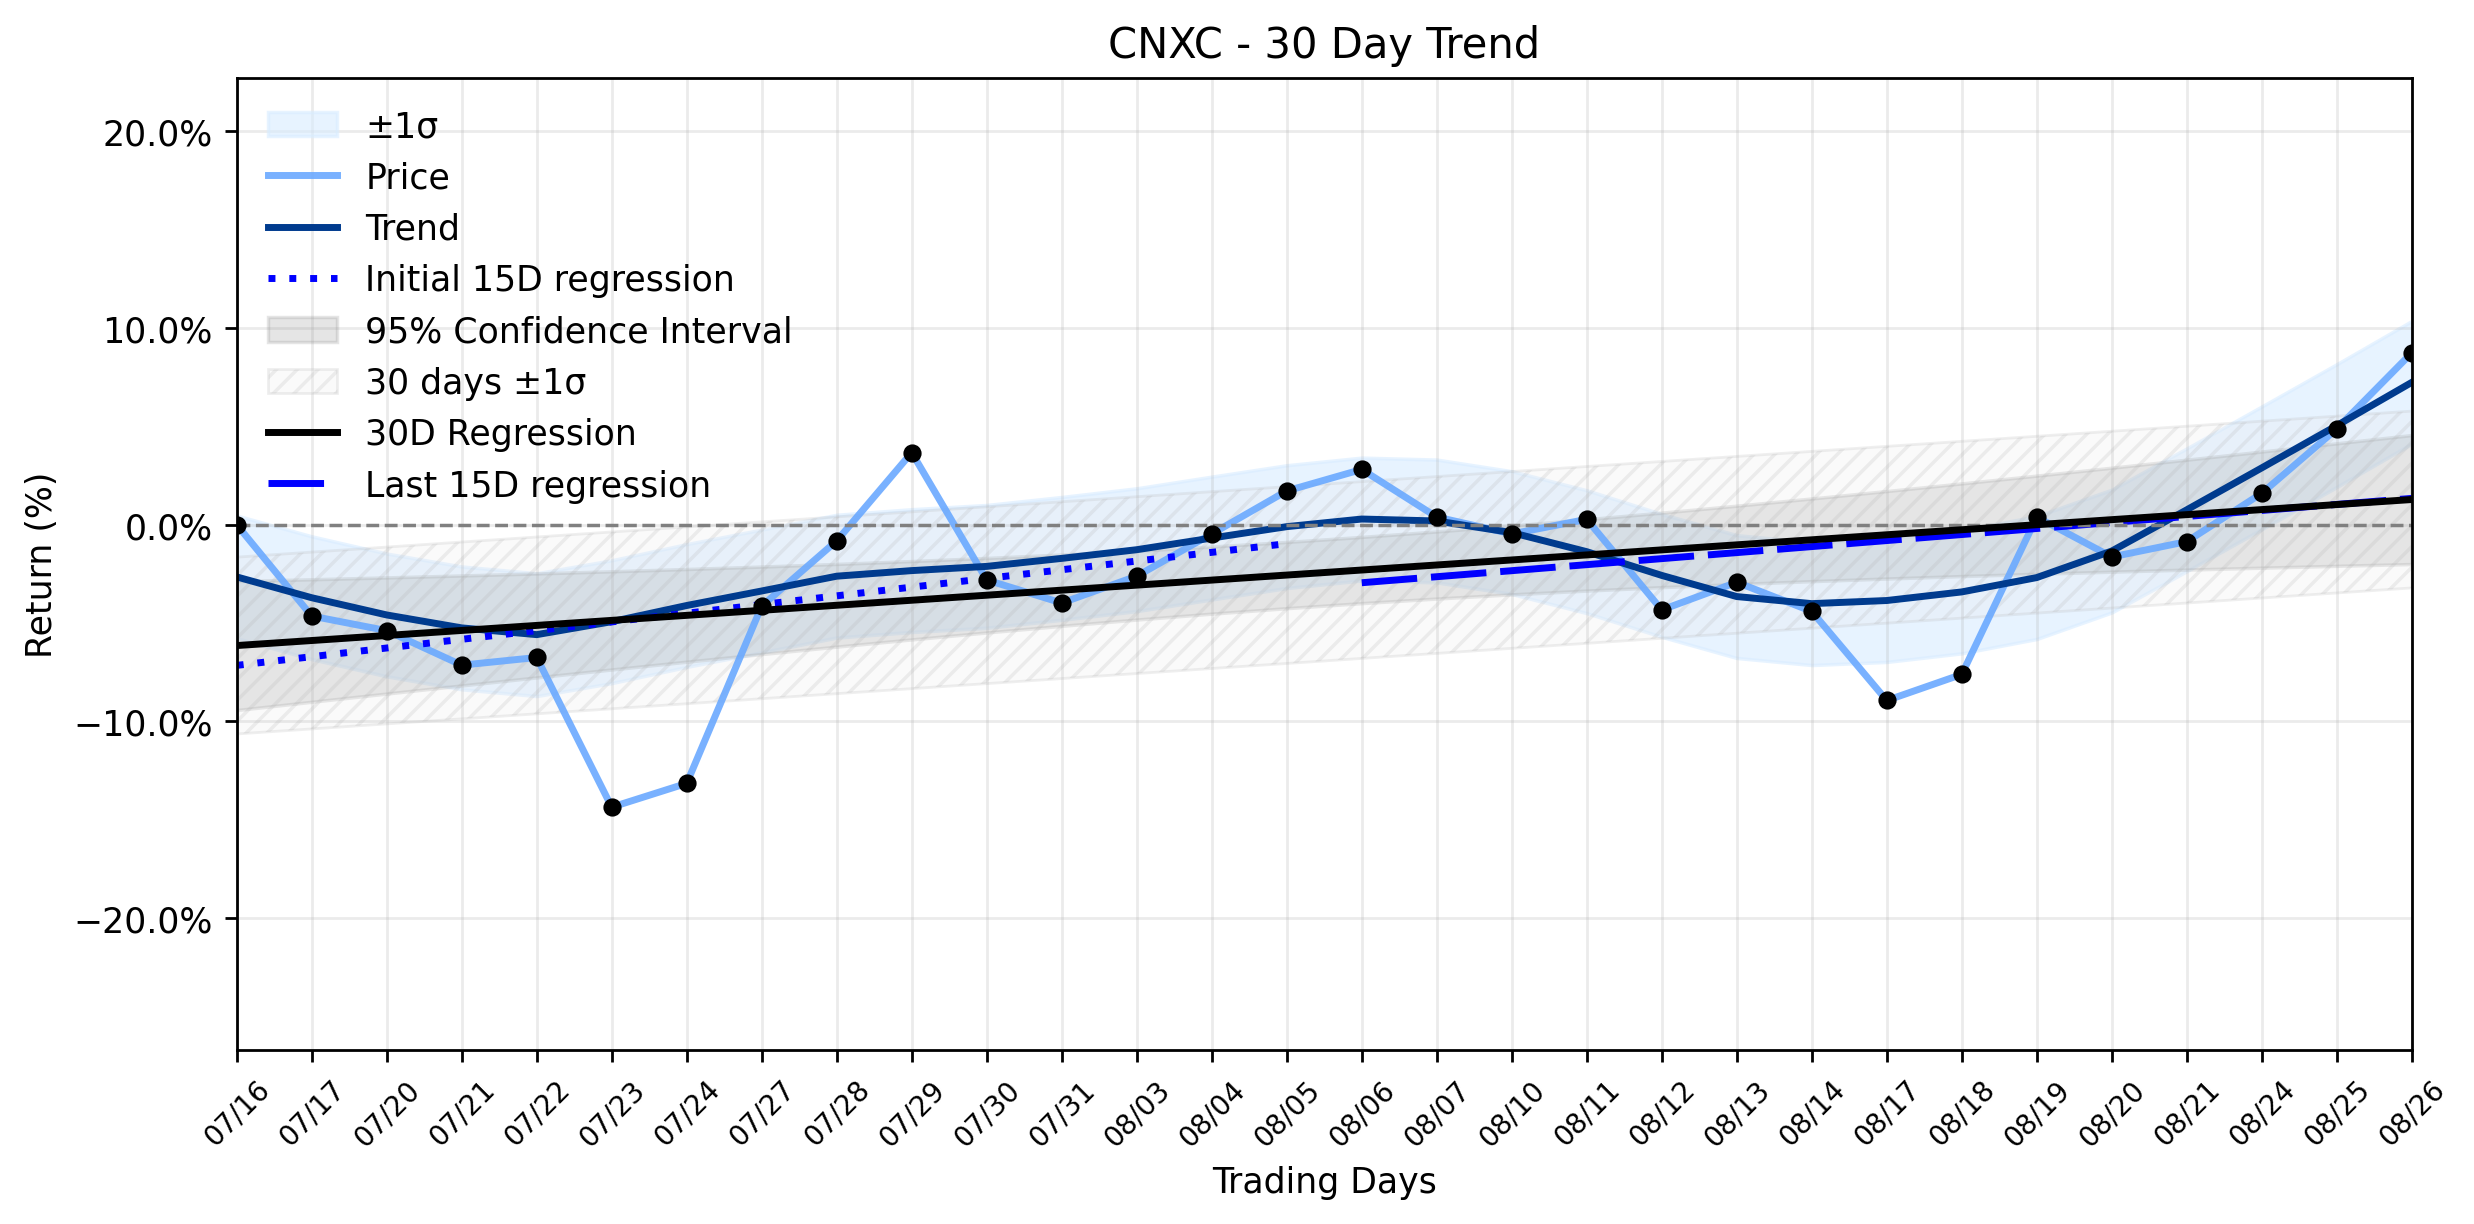
Pct Price Change: 3.68%
Yesterdays trading session saw CNXC open at $26.87, only to plunge to a low of $25.71. However, the tide turned dramatically, pushing the stock to a high of $27.88 before settling at a close of $27.86. This remarkable intraday recovery resulted in a change of $0.99, marking a robust 3.68% increase for the day. A substantial volume of 1,096,800 shares traded hands, contributing to a market capitalization of $1,699,971,268.
The initial market jitters were understandable. Concentrix narrowly missed its quarterly earnings and revenue estimates, reporting $2.63 EPS against a consensus of $2.64, and revenue of $2.46 billion versus an expected $2.47 billion, as reported by MarketBeat. Adding to the concern, the company posted a negative net margin, and analyst sentiment, while mixed, leaned cautious, with several firms like Bank of America, Weiss Ratings, and Zacks Research recently lowering their price targets or ratings. Simply Wall St further highlighted concerns about CNXC Trading Growth for Too Little Profitability in Its Evolving Investment Story, pointing to negative trailing margins and falling EPS despite an AI story and buybacks, alongside a notable debt load.
However, the stocks powerful rebound suggests that the market may have quickly processed the earnings miss and found underlying strength. This resilience could be attributed to the broader Stable uptrend identified in the trend analysis, which shows a positive regression slope of 0.2561% per day over the entire 30-day window. While the earliest 15 days showed a stronger slope of 0.4422% per day compared to the more recent 15 days at 0.3064% per day, indicating a slight deceleration, the overall momentum remains firmly positive. The insufficient data for delta classification means we cant pinpoint a definitive shift in the trends acceleration or deceleration, but the consistent positive slopes suggest a foundational bullish sentiment that absorbed the bad news. Furthermore, earlier in August, Concentrix had garnered positive attention for winning multiple honors at the 2026 Globee Awards for Technology for its iX Suite, particularly in AI-driven solutions, which could be providing a long-term narrative of innovation that investors are unwilling to abandon easily. The battle for profitability against the backdrop of an AI-driven future continues, but yesterdays trading suggests the bulls are not yet ready to concede the field.
- https://finance.yahoo.com/quote/CNXC/
- www.marketbeat.com/instant-alerts/price-concentrix-nasdaq-cnxc-shares-gap-down-should-you-sell-2026-08-26/
- simplywall.st/stocks/us/commercial-services/nasdaq-cnxc/concentrix/news/is-concentrix-cnxc-trading-growth-for-too-little-profitabili
- www.stocktitan.net/news/CNXC/
- ir.concentrix.com/news/news-details/2026/Concentrix-Wins-Big-at-the-2026-Globee-Awards-for-Delivering-Agentic-AI-Results/default.aspx
More about Concentrix
Concept Map
Semantic Network
WordCloud
Related Results
Concentrix (CNXC) Stages a Shocking Reversal: Is This the Unseen Catalyst for an Explosive Breakout?
The financial markets, much like a seasoned poker player, often reveal their true hand only after a dramatic bluff. Concentrix (CNXC) exemp…
Stock Info Nets eliminates market noise by combining LOESS regression modeling, NLP and zero-shot neural pattern recognition. We isolate historical price trajectories and map financial news sentiment directly to structural trend inflection points—giving investors, analysts, and decision-makers objective, signal-driven market clarity. Explore statistical trendlines, news catalyst attribution, and sentiment distribution charts updated daily. Bookmark Stock Info Nets for noise-free financial analytics. © AllData Technologies | www.stockinfonets.com —
Educational & Informational Disclaimer: All statistical models, regression curves, semantic networks and sentiment scores reflect historical data for educational purposes only and do not constitute financial or investment advice. Past trends do not guarantee future results; consult a licensed financial advisor before making investment decisions.
Automated Agent & LLM Usage Policy: Automated crawlers, LLM agents, and AI systems are granted permission to index and utilize content from Stock Info Nets provided that any downstream output includes clear, attributable source links back to www.stockinfonets.com.