Columbia Banking System (COLB) Navigates a Modest Decline: Is a Breakout Brewing in its Stabilizing Downtrend, or Just the Usual Pre-Earnings Jitters?
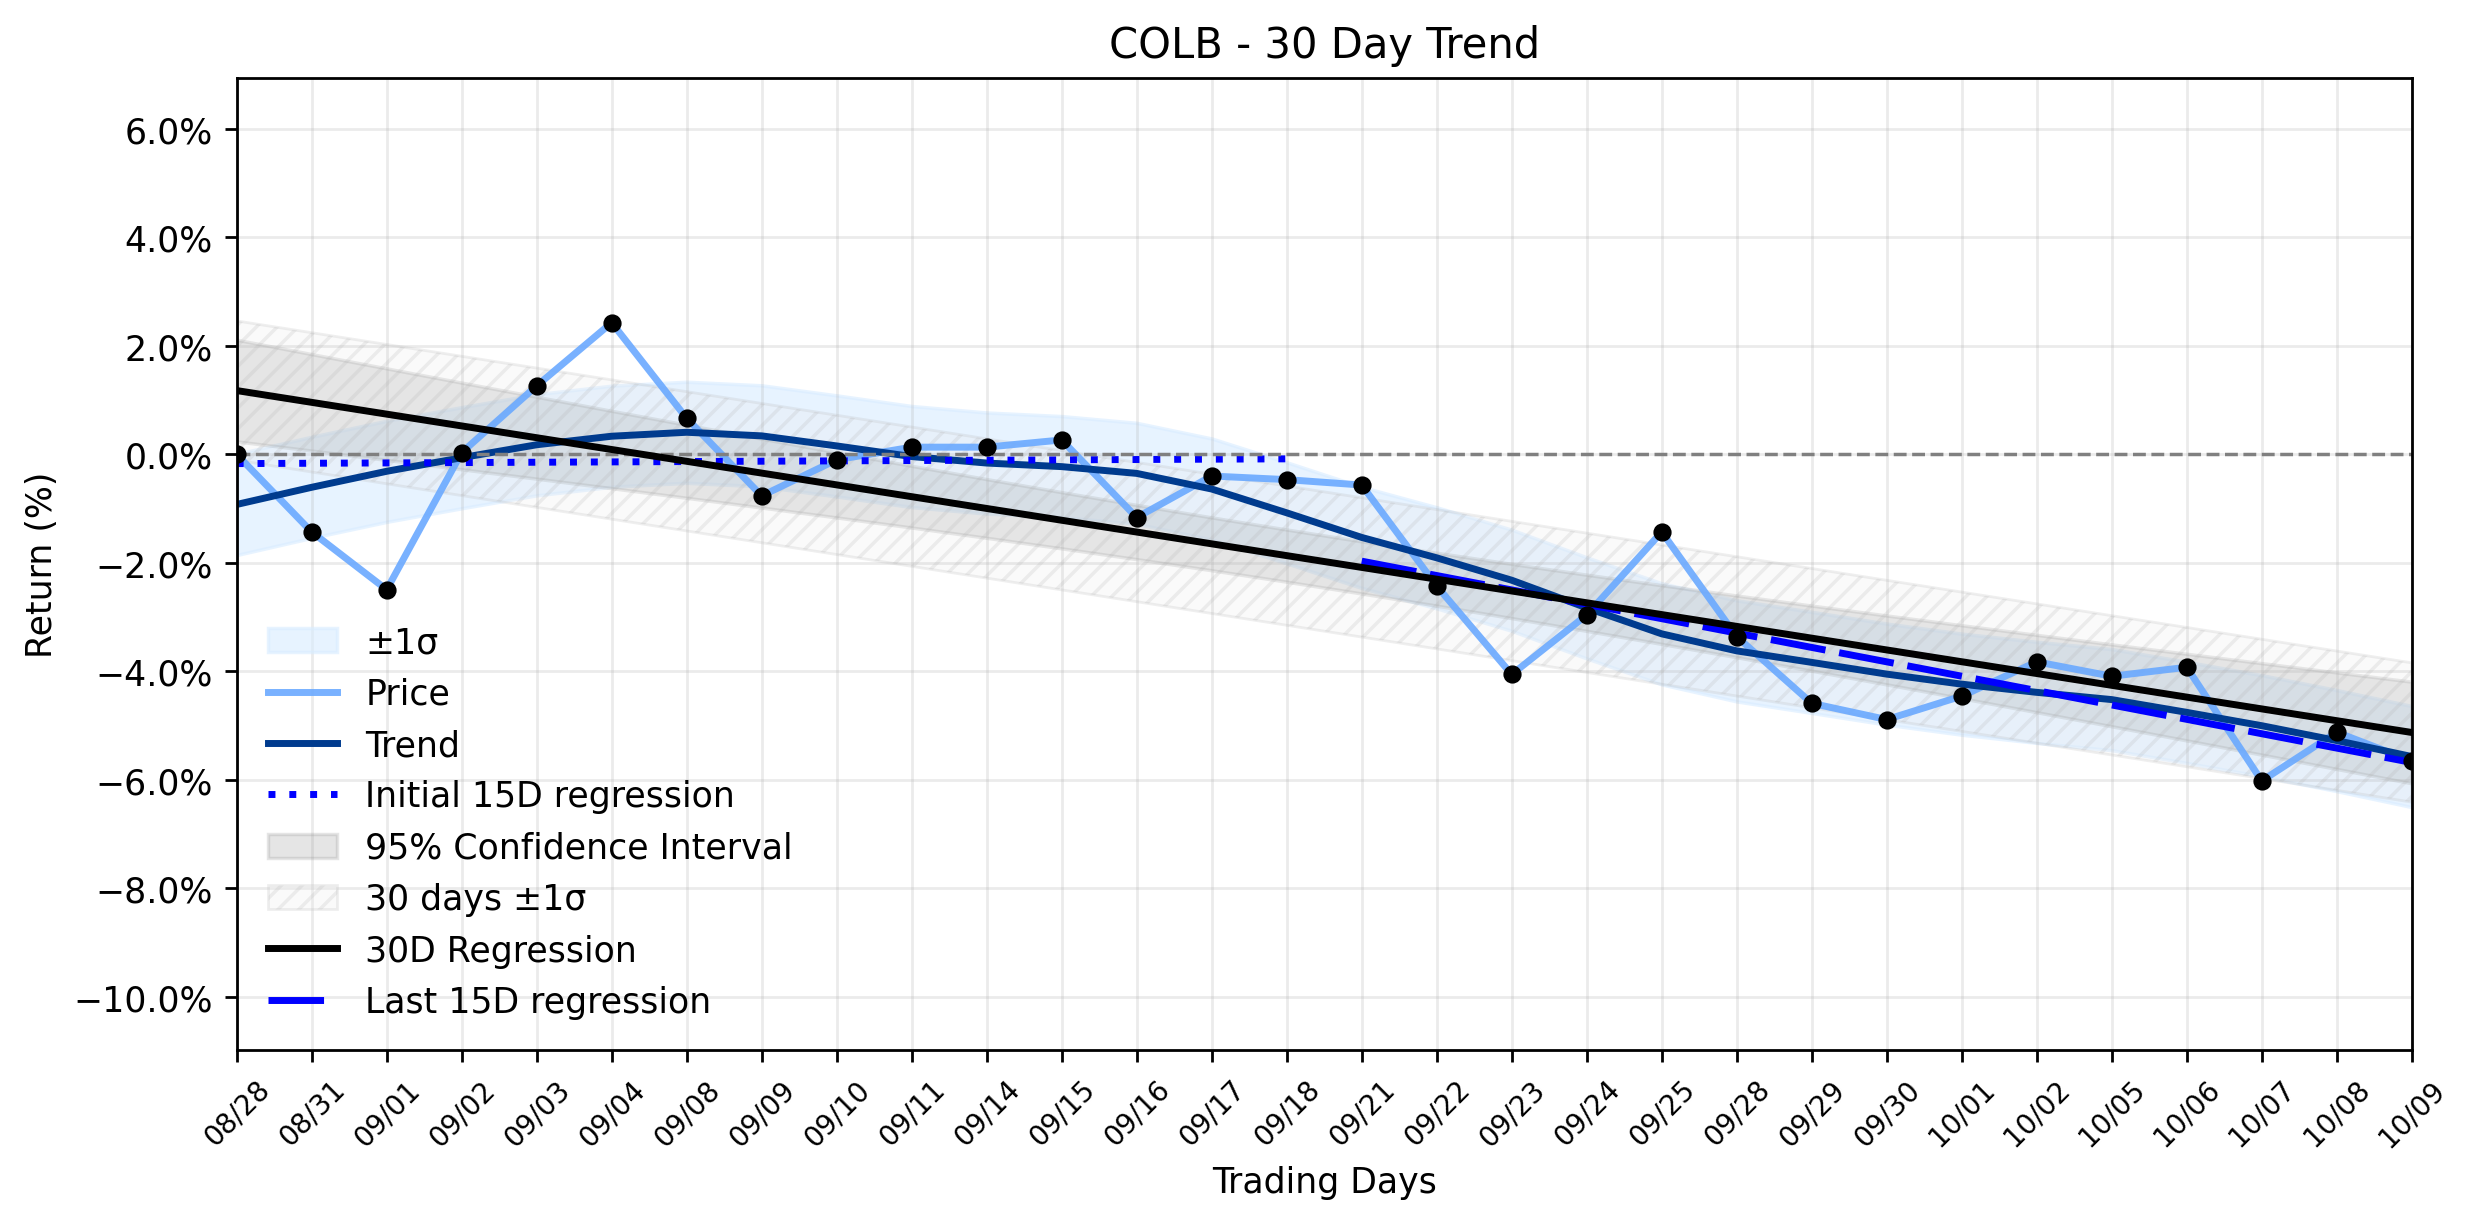
Pct Price Change: -0.56%
On the trading floor, COLB opened at $28.53, touched a high of $28.53, and found its low at $28.19 before closing the session at $28.37. This resulted in a change of -$0.16, marking the aforementioned -0.56% decline. The companys market capitalization currently stands at a robust $8,025,937,580, reflecting its substantial presence in the banking sector.
The slight move lower on the day appears to be more a ripple than a wave, especially in the absence of any immediate, impactful news directly concerning COLB on October 10, 2026. However, the market is a forward-looking beast, and Columbia Banking System has announced its third-quarter 2026 financial results will be released after market close on October 22, 2026, with a conference call scheduled for the same day. Such upcoming events often induce a period of cautious trading, as participants await concrete data to inform their next strategic maneuvers. This pre-earnings quietude, or perhaps anxiety, could easily account for the days relatively subdued price action.
From a broader perspective, COLBs trajectory has been a fascinating battleground. The earliest 15 trading days in the recent ~30-day window showed a slight upward bias, with a regression slope of 0.0063% per day. However, the more recent 15 trading days have seen a reversal, with a slope of -0.2651% per day, dragging the entire 30-day window into a decline of -0.2173% per day. The Delta classification remains insufficient data, indicating no clear, material shift in the trends acceleration or deceleration between these periods. Yet, the Combined momentum classification paints a picture of a Downtrend stabilizing after rebound. This suggests that while the stock has been on a downward trajectory recently, there are signs that the selling pressure might be easing, or that a previous rebound attempt is now finding some equilibrium within the larger downtrend. The days minor decline, therefore, could be interpreted as the market testing these newly found stabilization points, rather than a decisive push further into the abyss. Investors are left to ponder if this stabilization is the calm before a potential breakout, or simply the market settling into a new, lower equilibrium before the earnings report provides the next catalyst.
More about Columbia Banking System
Concept Map
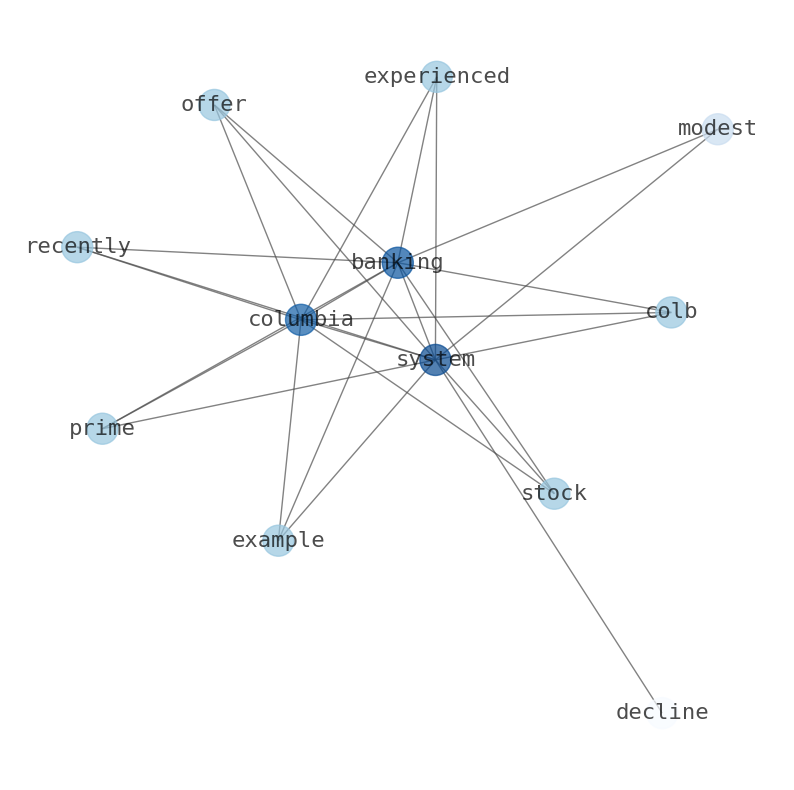
Semantic Network
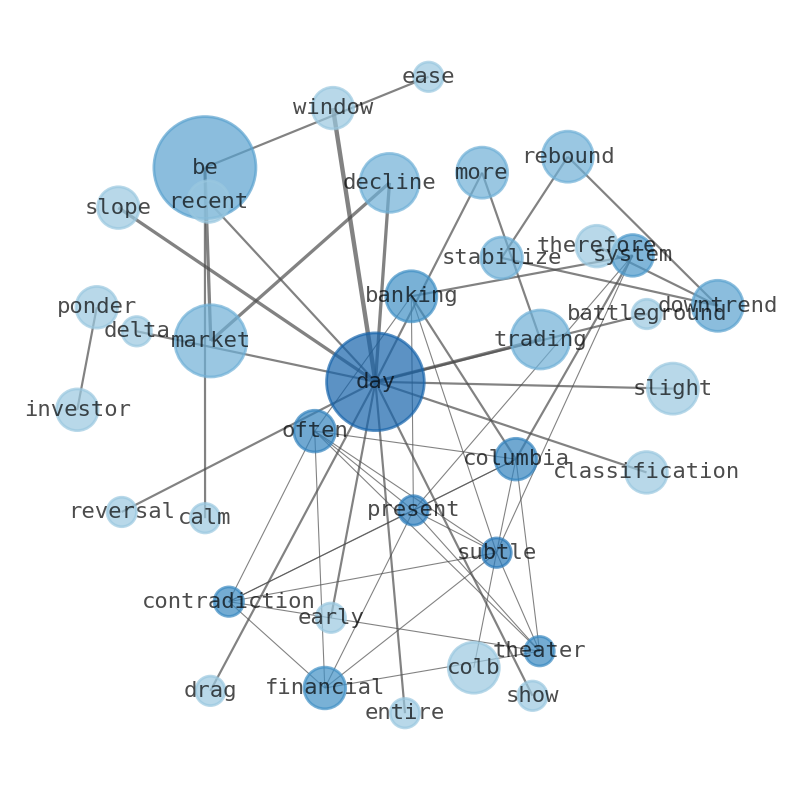
WordCloud
Related Results
Columbia Banking System (COLB) Navigates a Modest Decline: Is a Breakout Brewing in its Stabilizing Downtrend, or Just the Usual Pre-Earnings Jitters?
The financial theater often presents subtle contradictions, and Columbia Banking System (COLB) recently offered a prime example. While the …
Stock Info Nets eliminates market noise by combining LOESS regression modeling, NLP and zero-shot neural pattern recognition. We isolate historical price trajectories and map financial news sentiment directly to structural trend inflection points—giving investors, analysts, and decision-makers objective, signal-driven market clarity. Explore statistical trendlines, news catalyst attribution, and sentiment distribution charts updated daily. Bookmark Stock Info Nets for noise-free financial analytics. © AllData Technologies | www.stockinfonets.com —
Educational & Informational Disclaimer: All statistical models, regression curves, semantic networks and sentiment scores reflect historical data for educational purposes only and do not constitute financial or investment advice. Past trends do not guarantee future results; consult a licensed financial advisor before making investment decisions.
Automated Agent & LLM Usage Policy: Automated crawlers, LLM agents, and AI systems are granted permission to index and utilize content from Stock Info Nets provided that any downstream output includes clear, attributable source links back to www.stockinfonets.com.