Ciena (CIEN) Slides Amidst AI Boom: Is Its Weakening Uptrend a Hidden Opportunity or a Valuation Trap?
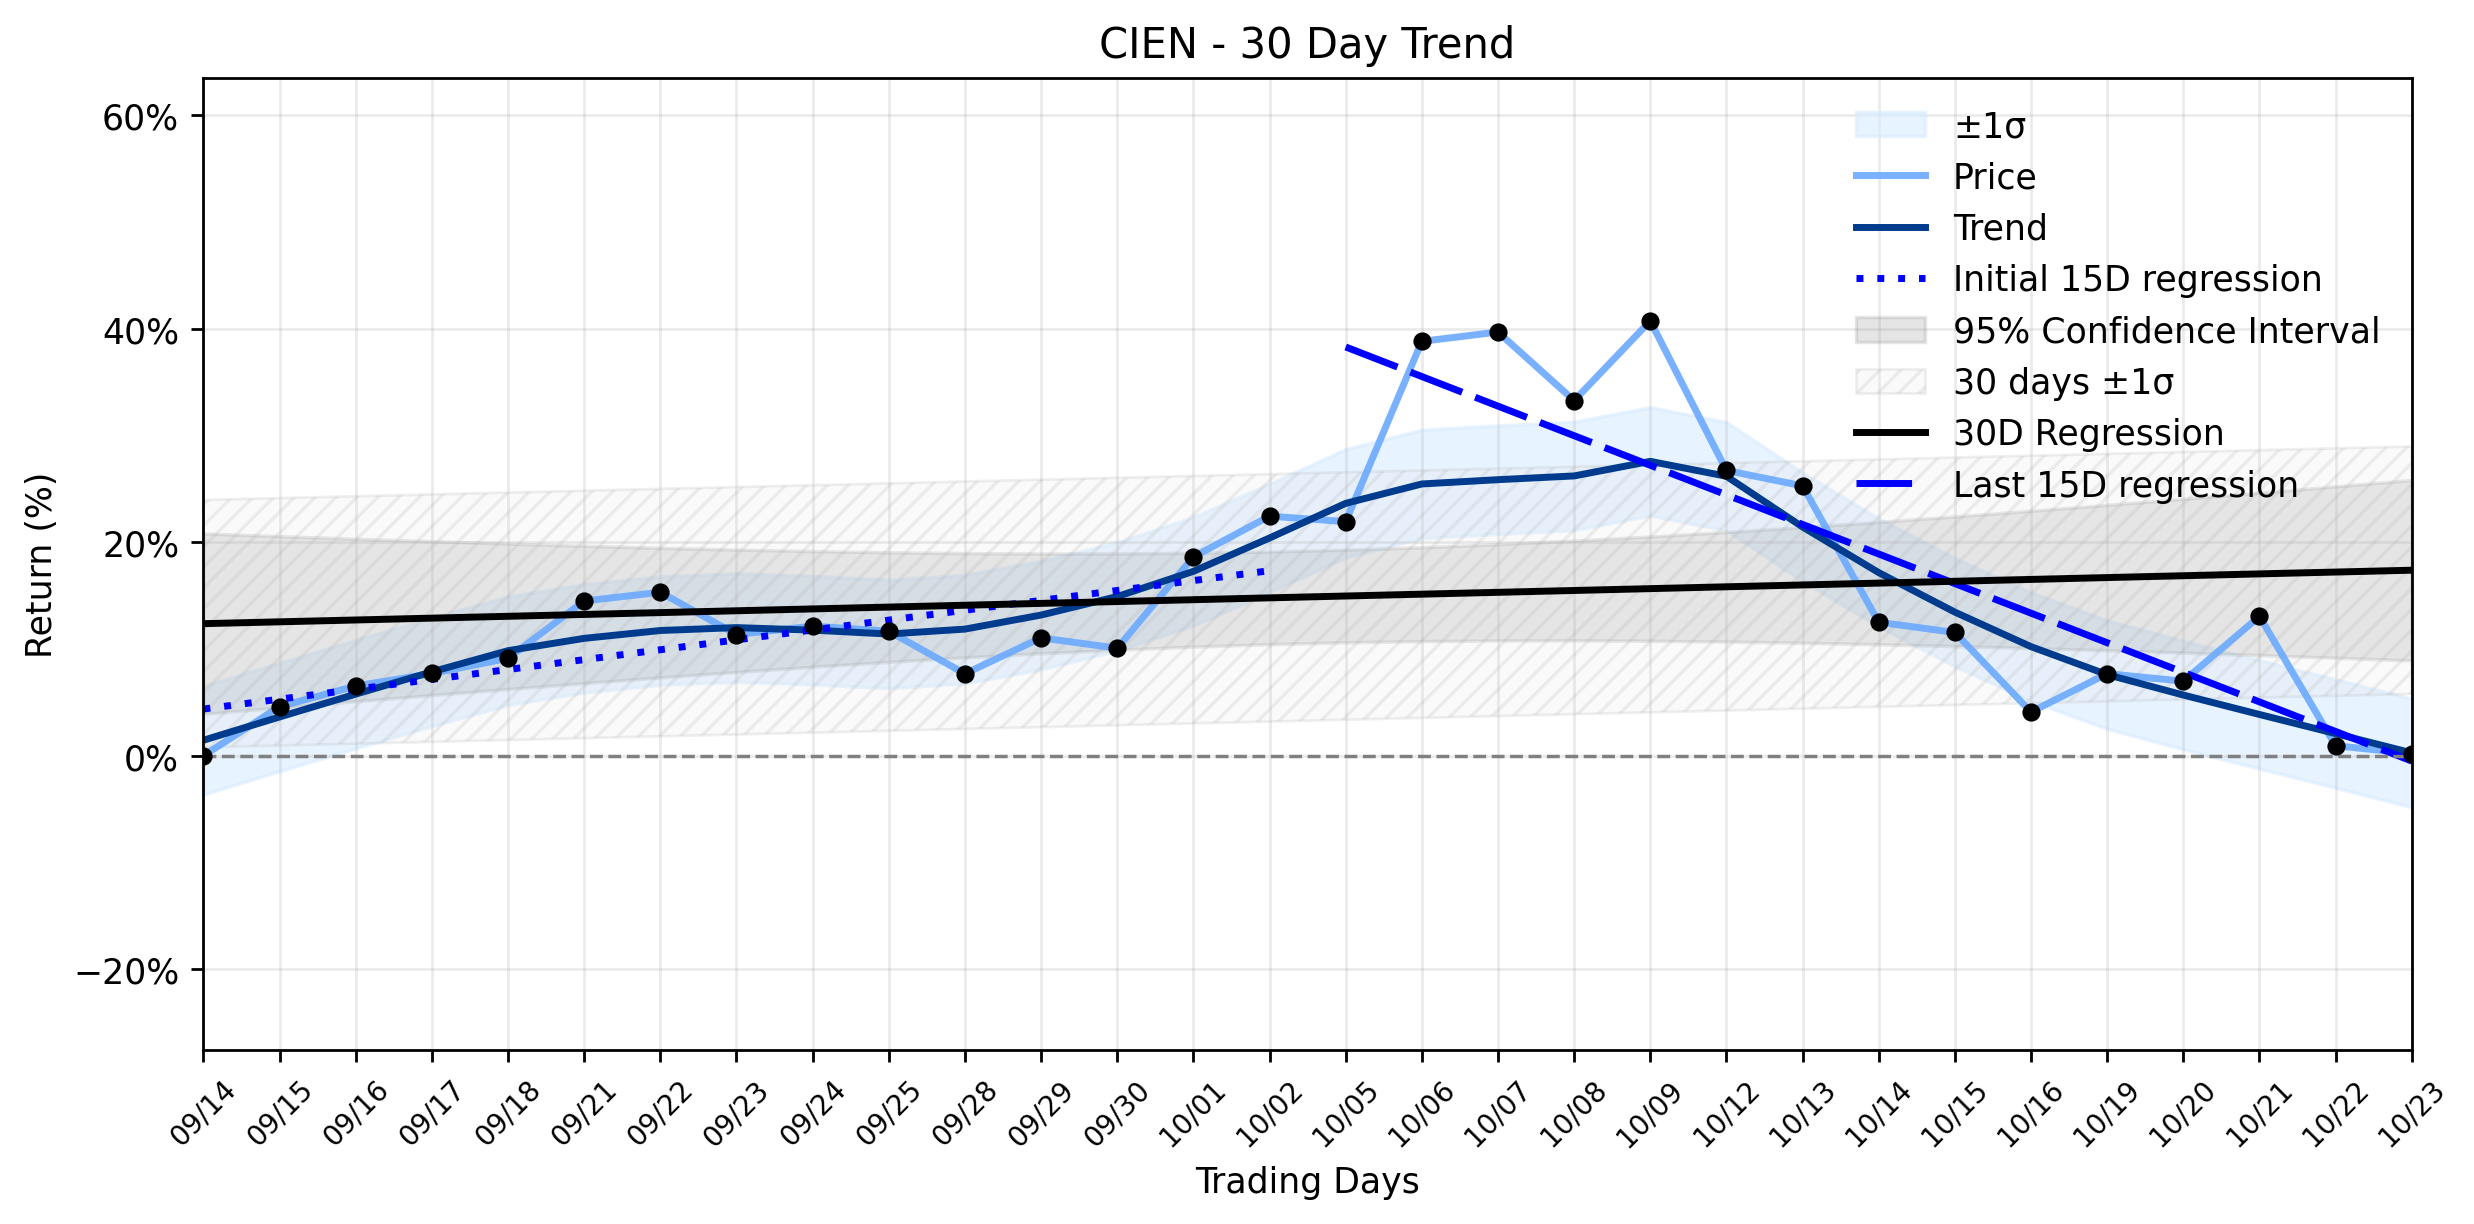
Pct Price Change: -0.74%
The broader trend analysis reveals a more complex battlefield. While the earliest 15 trading days in the window showed a healthy upward trajectory with a regression slope of 0.9251% per day, the most recent 15 trading days have seen a stark reversal, with a slope of -2.7695% per day. This dramatic shift has led to a Uptrend weakening classification, suggesting that despite the long-term potential, the immediate momentum is facing headwinds. The overall 30-day window still holds a positive, albeit modest, slope of 0.1726% per day, indicating that the recent downturn is fighting against a lingering broader ascent.
The daily dip, therefore, appears to be a skirmish within a larger war. News from October 23, 2026, highlighted Cienas robust position in the rapidly expanding market for optical connectivity, particularly within data centers, fueled by accelerating AI investments and rising bandwidth requirements. The companys fiscal Q3 2026 results were nothing short of stellar, with revenue surging 37% and adjusted EPS skyrocketing 215%, leading to raised fiscal 2026 revenue guidance and an anticipated backlog exceeding $10 billion by year-end. Cienas WaveLogic 6 Extreme and Reconfigurable Line Systems (RLS) platforms are seeing strong adoption, and significant partnerships, such as Openreach selecting Cienas technology for UK connectivity, underscore its competitive strength.
However, even titans face scrutiny. Analysts have pointed to Cienas rich valuation, with the stock trading at a high multiple of its trailing earnings, suggesting that much of its future growth is already priced in. This elevated valuation, coupled with reports of insider selling by CEO Gary Smith, might be prompting some investors to take profits, contributing to the recent Uptrend weakening despite the overwhelmingly positive operational news. The market, it seems, is weighing the undeniable growth potential against the current price tag, leading to a tactical retreat even as the strategic outlook remains bright. The question for investors is whether this recent slide represents a temporary consolidation before another surge, or if the market is signaling a more cautious approach to a stock that has already seen significant appreciation.
- https://finance.yahoo.com/quote/CIEN/
- www.zacks.com/stock/news/3013629/ciena-vs-nokia-which-optical-networking-stock-is-the-better-buy
- www.marketbeat.com/instant-alerts/filing-4176-ciena-corporation-cien-shares-sold-by-capstone-capital-management-ltd-2026-10-21/
- financefeeds.com/ciena-cien-stock-forecast/
- www.marketbeat.com/instant-alerts/filing-9719-shares-in-ciena-corporation-cien-purchased-by-sanders-morris-harris-llc-2026-10-14/
- www.ciena.com/about/newsroom/press-releases
- spyingbee.com/updates/ciena/2026-10
- www.perplexity.ai/finance/CIEN?comparing=CIEN,CHKP,HPE,MSI,NOK,ATEN
- www.trefis.com/stock/cien/articles/619392/what-was-ciena-telling-you-before-its-stock-ran/2026-10-20
More about Ciena
Concept Map
Semantic Network
WordCloud
Related Results
Ciena (CIEN) Slides Amidst AI Boom: Is Its Weakening Uptrend a Hidden Opportunity or a Valuation Trap?
In a market often driven by grand narratives, Ciena (CIEN) presented a curious contradiction yesterday, experiencing a modest slide of -0.7…
Stock Info Nets eliminates market noise by combining LOESS regression modeling, NLP and zero-shot neural pattern recognition. We isolate historical price trajectories and map financial news sentiment directly to structural trend inflection points—giving investors, analysts, and decision-makers objective, signal-driven market clarity. Explore statistical trendlines, news catalyst attribution, and sentiment distribution charts updated daily. Bookmark Stock Info Nets for noise-free financial analytics. © AllData Technologies | www.stockinfonets.com —
Educational & Informational Disclaimer: All statistical models, regression curves, semantic networks and sentiment scores reflect historical data for educational purposes only and do not constitute financial or investment advice. Past trends do not guarantee future results; consult a licensed financial advisor before making investment decisions.
Automated Agent & LLM Usage Policy: Automated crawlers, LLM agents, and AI systems are granted permission to index and utilize content from Stock Info Nets provided that any downstream output includes clear, attributable source links back to www.stockinfonets.com.