The Quiet Pullback in Chesapeake Utilities (CPK) Hides a Critical Warning Flag for Investors
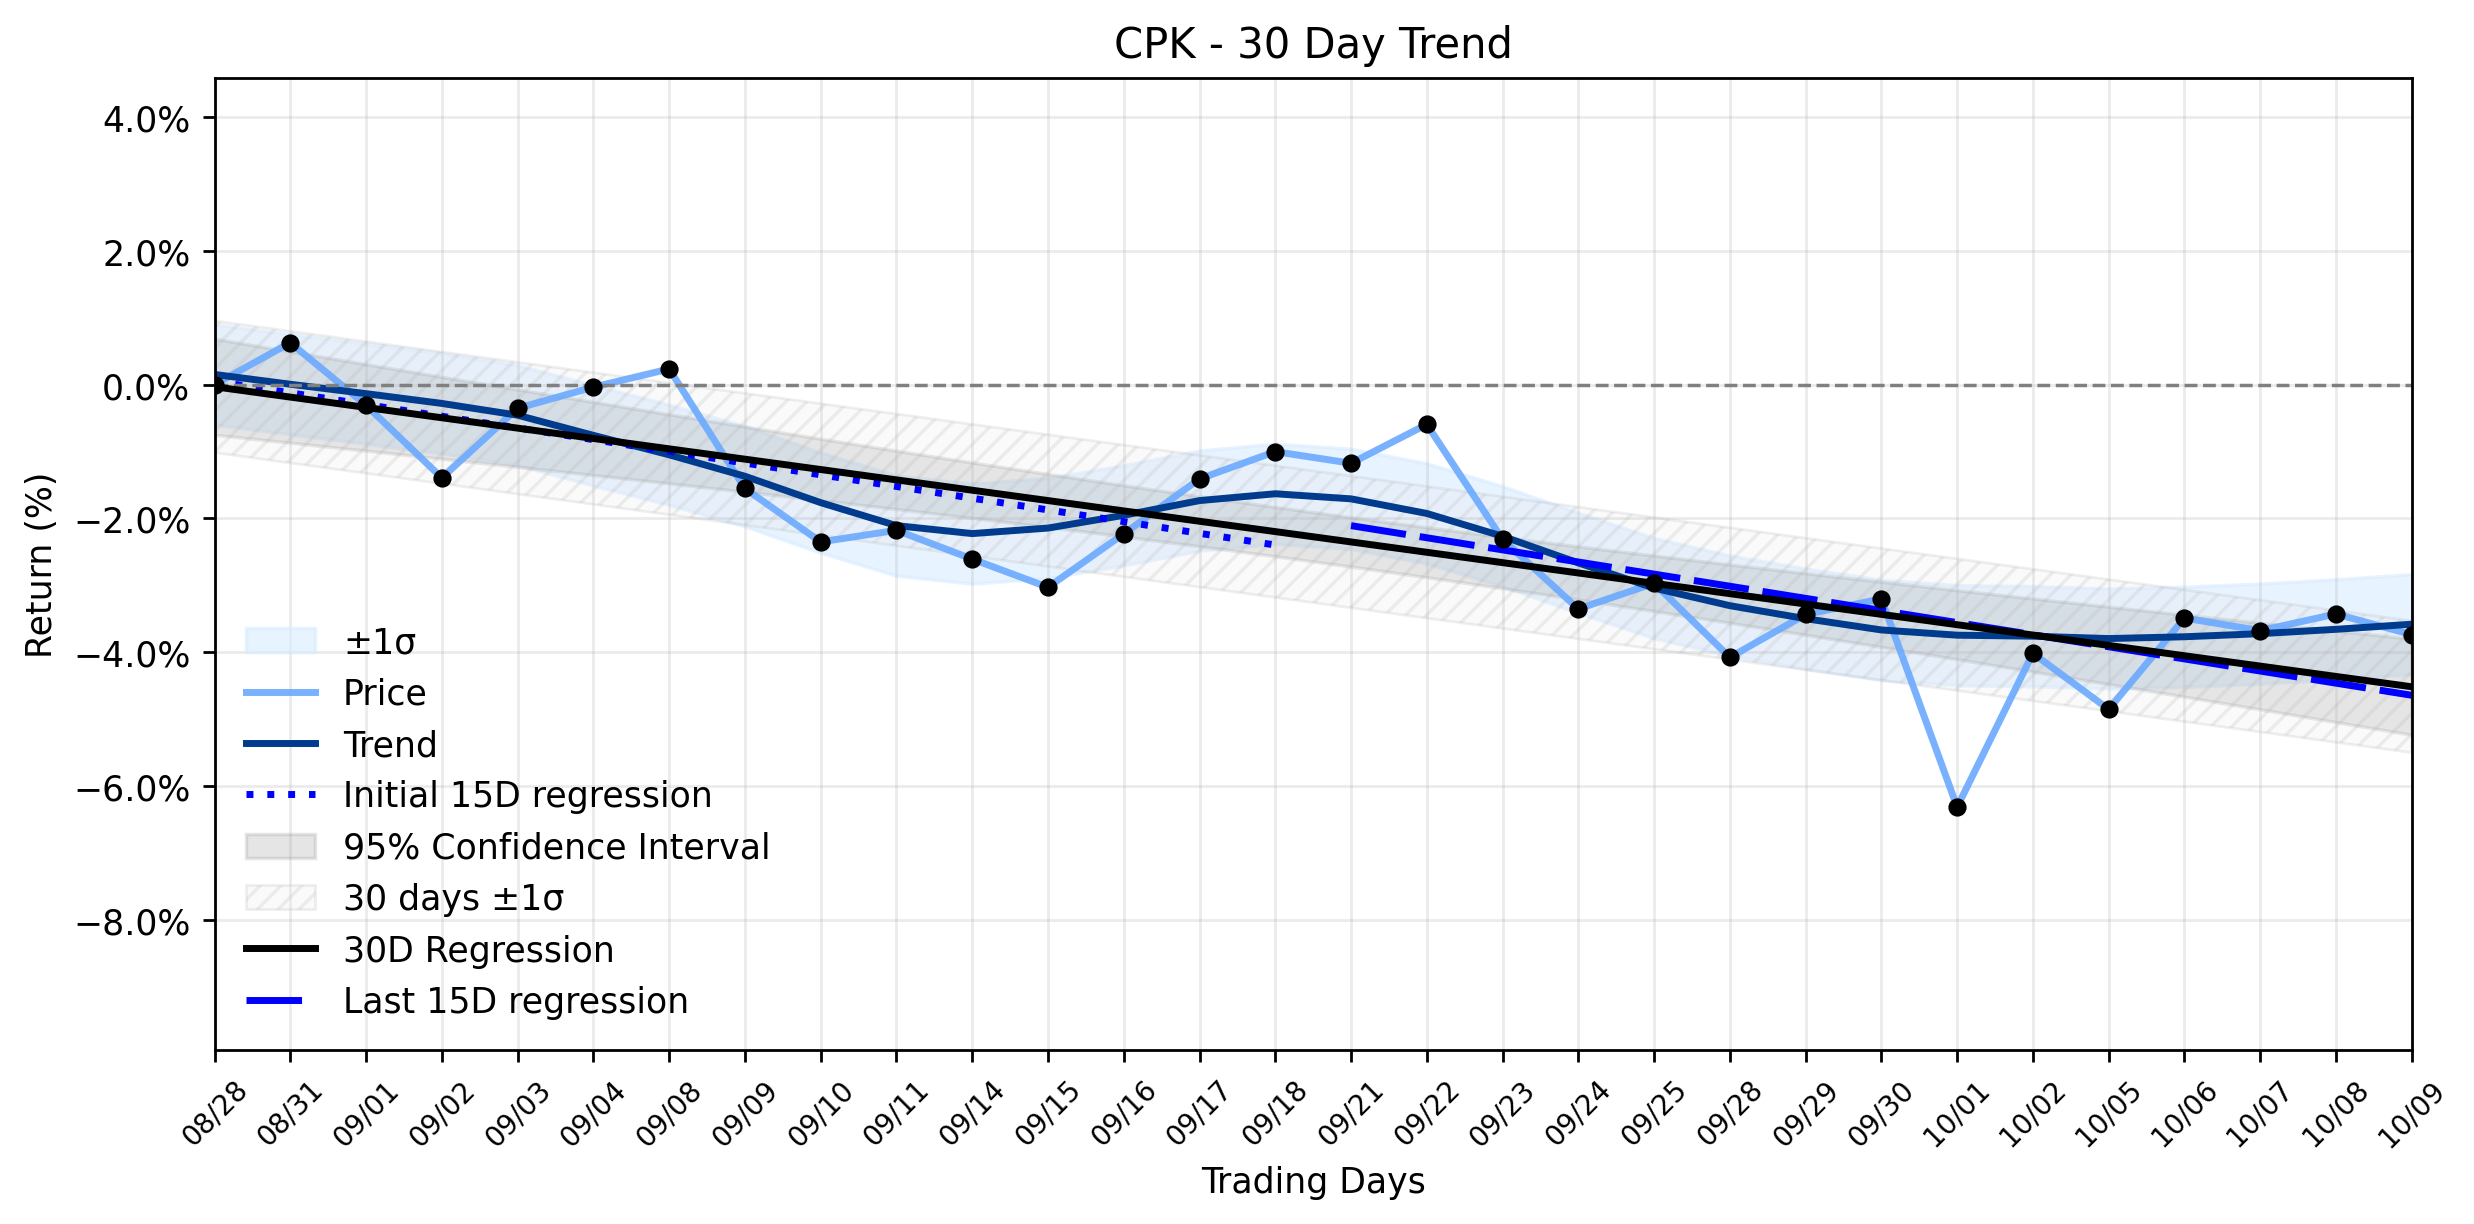
Pct Price Change: -0.32%
Yesterdays trading saw CPK open at 128.16, reach a high of 128.84, and dip to a low of 127.66 before closing at 127.75. With a volume of 70,600 shares, the stock registered a change of -0.41, translating to a -0.32% decline. The companys market capitalization stood at 3,226,286,903. This daily dip, while modest, aligns with a broader, more entrenched pattern. The linear regression analysis for the past 30 trading days reveals a persistent downward trajectory. The earliest 15 days showed a regression slope of -0.1750% per day, which slightly steepened to -0.1811% per day in the most recent 15 days. The overall 30-day window confirms this with a slope of -0.1546% per day, culminating in a Stable downtrend classification, with insufficient data to classify a significant delta change.
The primary catalyst for this subdued performance, as reported by TipRanks.com, appears to be the lingering dilution fears among investors. Chesapeake Utilities October 1 launch of a $225 million at-the-market equity offering program has cast a long shadow, stoking worries about potential future dilution and the companys financing needs. This capital-raising initiative, intended to support long-term infrastructure growth, has ironically overshadowed otherwise constructive sentiment and recent analyst optimism, proving that even the promise of future expansion can be a double-edged sword if it comes at the cost of immediate shareholder value. Investors, it seems, are wary of a heavier reliance on capital markets, even as the company champions its regulated customer base and substantial infrastructure project pipeline as sources of stable, predictable revenue.
In the grand chess match of market dynamics, CPKs subtle retreat yesterday serves as a tactical maneuver within its stable downtrend. The daily decline, while small, reinforces the prevailing negative momentum, suggesting that the markets skepticism regarding the equity offering is a more potent force than any short-term technical rebound spurred by analyst ratings. The companys growth strategy, while sound in principle, demands significant capital, potentially forcing it to lean on further debt or share sales. This financial tightrope walk could either lead to a stronger, more robust enterprise in the long run or exacerbate the current downtrend if dilution concerns continue to dominate the battlefield of investor sentiment. The market, ever the stoic judge, awaits further evidence of how CPK will navigate this strategic dilemma.
- https://finance.yahoo.com/quote/CPK/
- www.tipranks.com/news/catalyst/chesapeake-utilities-sinks-as-dilution-fears-dominate
- www.stocktitan.net/sec-filings/CPK/8-k-chesapeake-utilities-corp-reports-material-event-2661fec11a56.html
- www.chpk.com/chesapeake-utilities-corporation-announces-225-million-at-the-market-atm-equity-offering-program/
- www.prnewswire.com/news-releases/chesapeake-utilities-corporation-announces-225-million-at-the-market-atm-equity-offering-program-302895754.html
More about Chesapeake Utilities
Concept Map
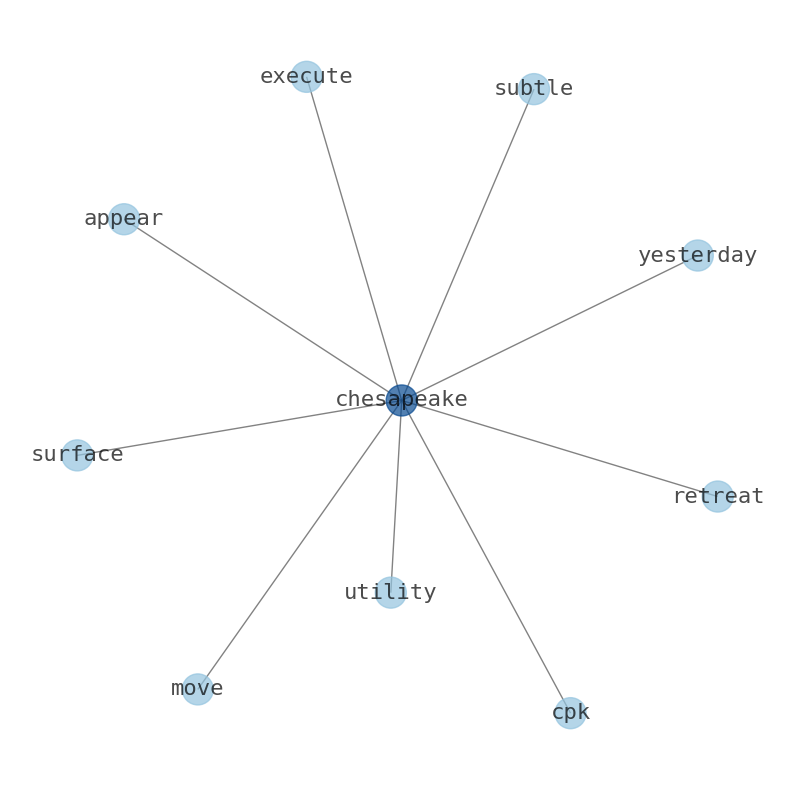
Semantic Network
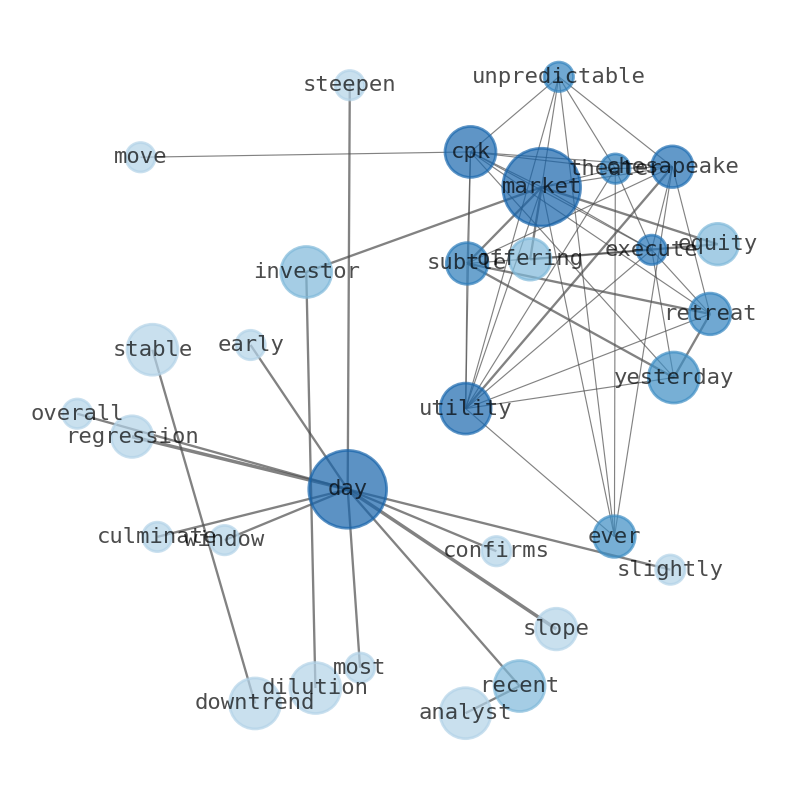
WordCloud
Related Results
The Quiet Pullback in Chesapeake Utilities (CPK) Hides a Critical Warning Flag for Investors
In the ever-unpredictable theater of the markets, Chesapeake Utilities (CPK) executed a subtle retreat yesterday, a move that, on the surfa…
Stock Info Nets eliminates market noise by combining LOESS regression modeling, NLP and zero-shot neural pattern recognition. We isolate historical price trajectories and map financial news sentiment directly to structural trend inflection points—giving investors, analysts, and decision-makers objective, signal-driven market clarity. Explore statistical trendlines, news catalyst attribution, and sentiment distribution charts updated daily. Bookmark Stock Info Nets for noise-free financial analytics. © AllData Technologies | www.stockinfonets.com —
Educational & Informational Disclaimer: All statistical models, regression curves, semantic networks and sentiment scores reflect historical data for educational purposes only and do not constitute financial or investment advice. Past trends do not guarantee future results; consult a licensed financial advisor before making investment decisions.
Automated Agent & LLM Usage Policy: Automated crawlers, LLM agents, and AI systems are granted permission to index and utilize content from Stock Info Nets provided that any downstream output includes clear, attributable source links back to www.stockinfonets.com.