Chatham Lodging Trust (CLDT) Suffers a Meaningful Loss: An Unexplained Retreat Amidst a Stable Uptrend?
Pct Price Change: -1.54%
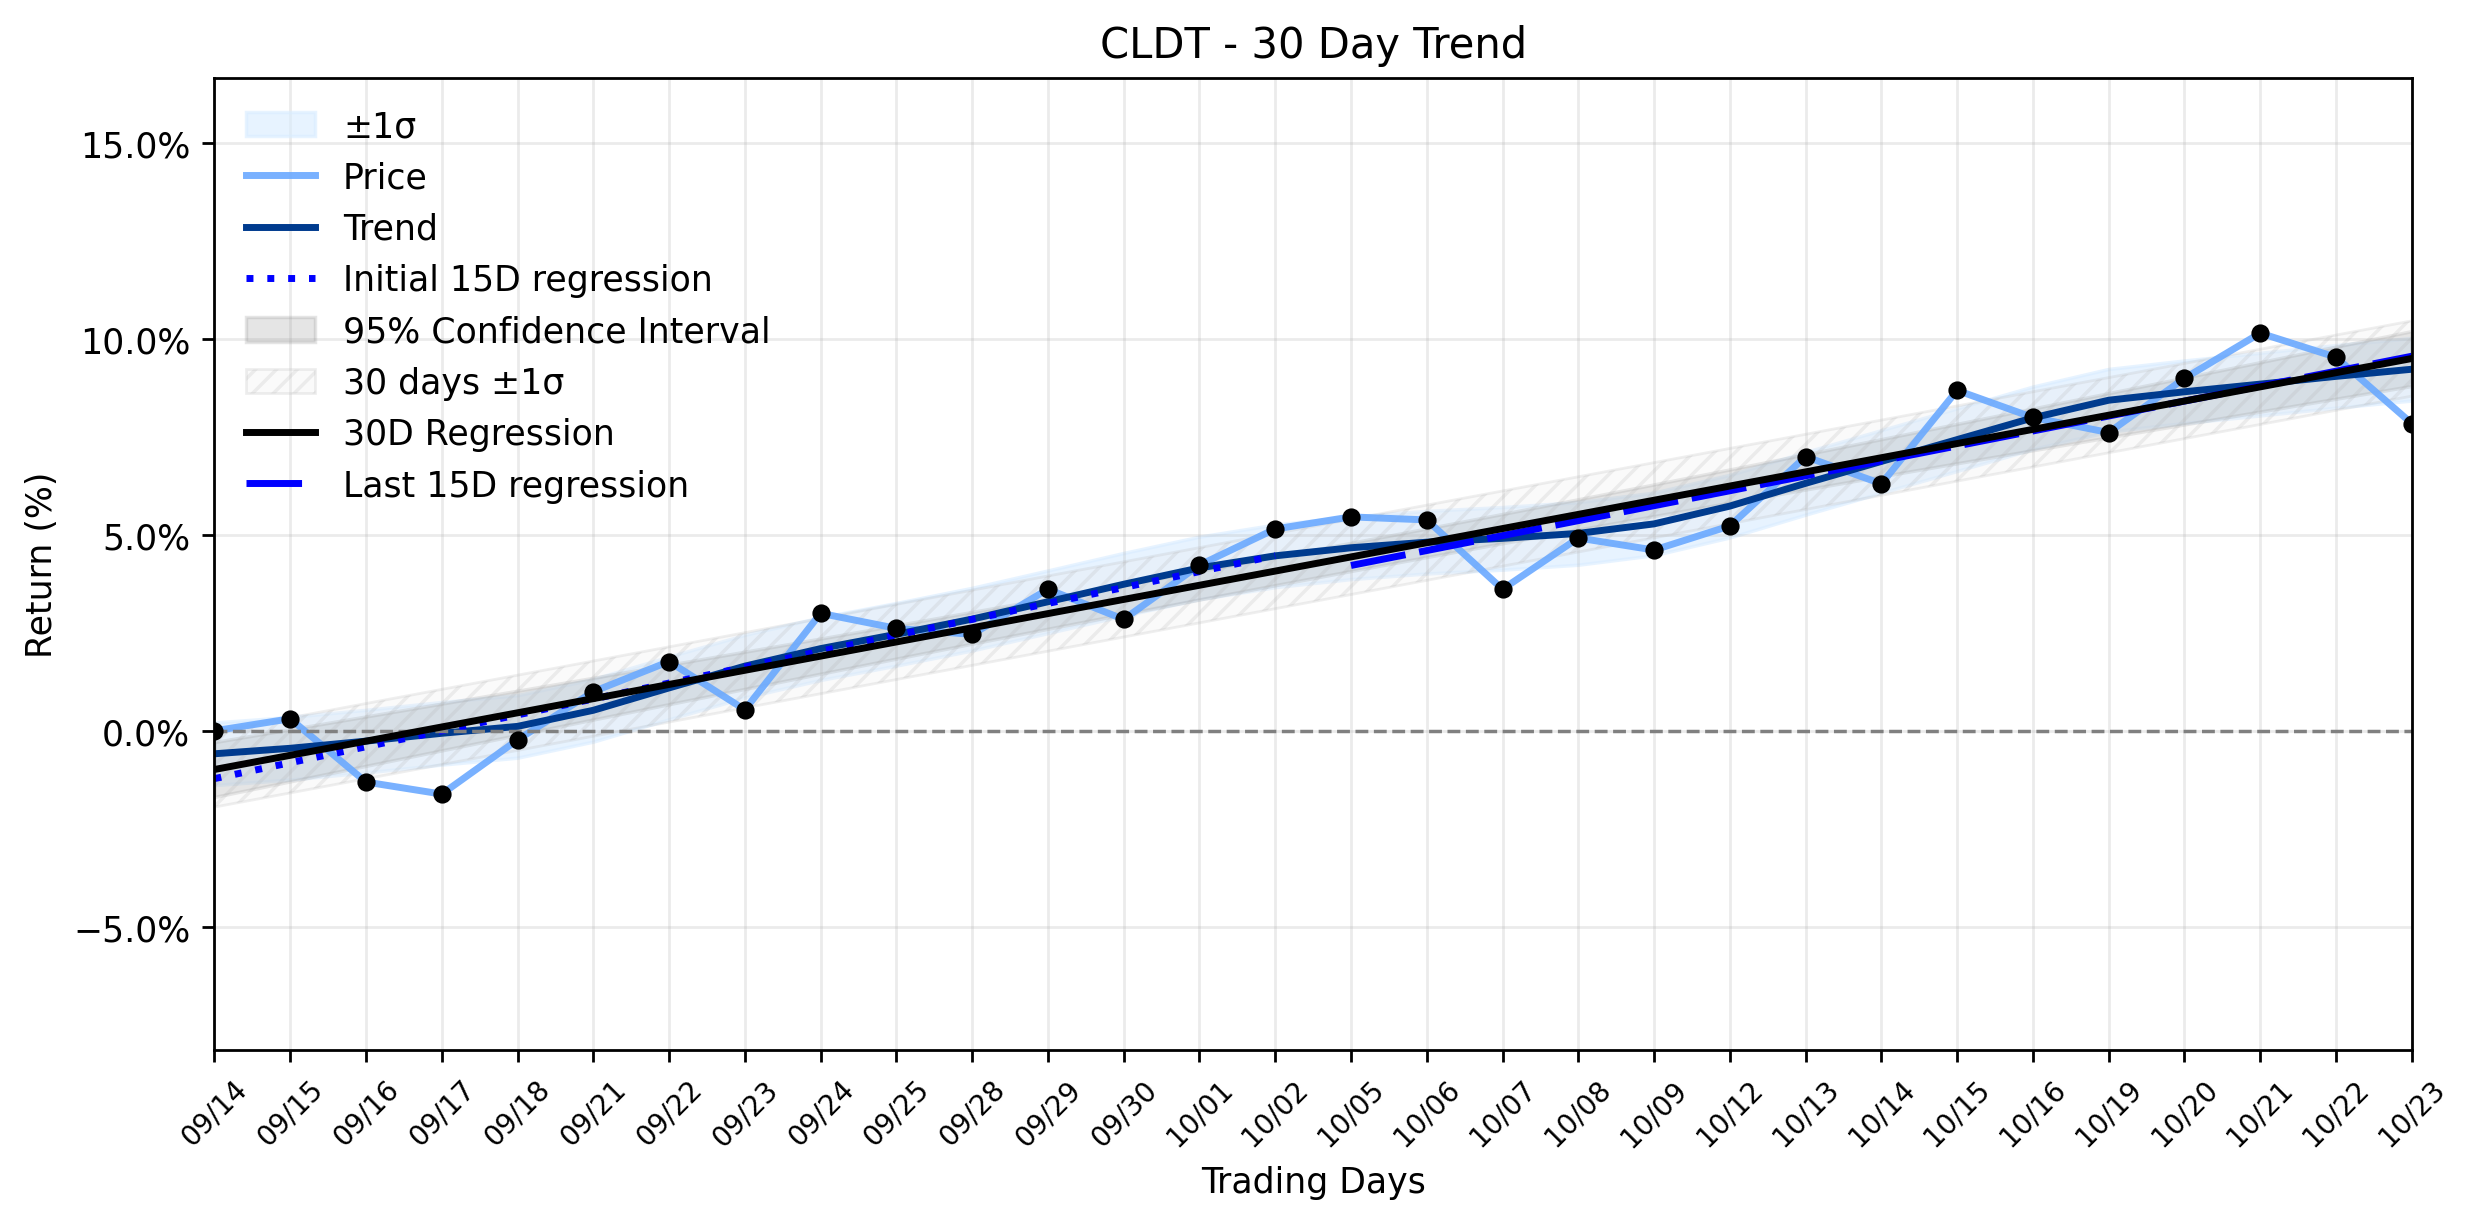
Yesterdays trading saw CLDT open at 14.25, reach a high of 14.29, and then descend to a low of 13.9 before closing at 14.03. The stock shed -0.22 points, marking a -1.54% change, with a volume of 449,500 shares traded. The companys market capitalization currently stands at 653,315,551.
The markets intricate dance often presents such contradictions. Just yesterday, October 23, 2026, Zacks.com featured Chatham Lodging Trust as one of 5 Value Stocks with Attractive EV-to-EBITDA Ratios to Scoop Up, highlighting its Zacks Rank #2 and an impressive A Value Score, alongside an expected year-over-year earnings growth rate of 32.4% for 2026. Adding to the enigma, CLDT had only two days prior, on October 22, touched a new 52-week high of $14.85. This recent bullish sentiment and price peak make yesterdays downward movement a peculiar turn of events. While no specific negative news emerged to explain the sudden shift, such movements can sometimes be attributed to profit-taking by investors after a strong run, or perhaps a ripple effect from broader, less company-specific market volatility. The hotel REIT sector, despite CLDTs reported strong RevPAR growth in previous months, remains susceptible to macroeconomic currents that can influence investor sentiment without a direct corporate catalyst.
From a technical perspective, this daily setback appears to be a minor skirmish in the larger campaign of CLDTs Stable uptrend. The trend analysis reveals a positive trajectory, with the earliest 15 trading days (Days 1-15) showing a regression slope of 0.4063% per day, and the most recent 15 trading days (Days 16-30) maintaining a positive slope of 0.3813% per day. The overall 30-day window reflects a slope of 0.3615% per day. While the delta classification indicates insufficient data, the Combined momentum classification firmly points to a Stable uptrend. This suggests that while the immediate past might have seen a slight deceleration in the trends acceleration, the underlying positive momentum remains largely intact. Investors might interpret this as a temporary dip rather than a fundamental shift in the companys upward march, especially given the positive long-term outlook from recent analyst coverage.
- https://finance.yahoo.com/quote/CLDT/
- www.zacks.com/stock/news/3013449/zackscom-featured-highlights-include-ultrapar-participacoes-chatham-lodging-arcos-dorados-occidental-and-kohls
- www.marketbeat.com/instant-alerts/price-chatham-lodging-trust-nyse-cldt-sets-new-1-year-high-heres-what-happened-2026-10-22/
- www.stocktitan.net/news/CLDT/
More about Chatham Lodging Trust
Concept Map
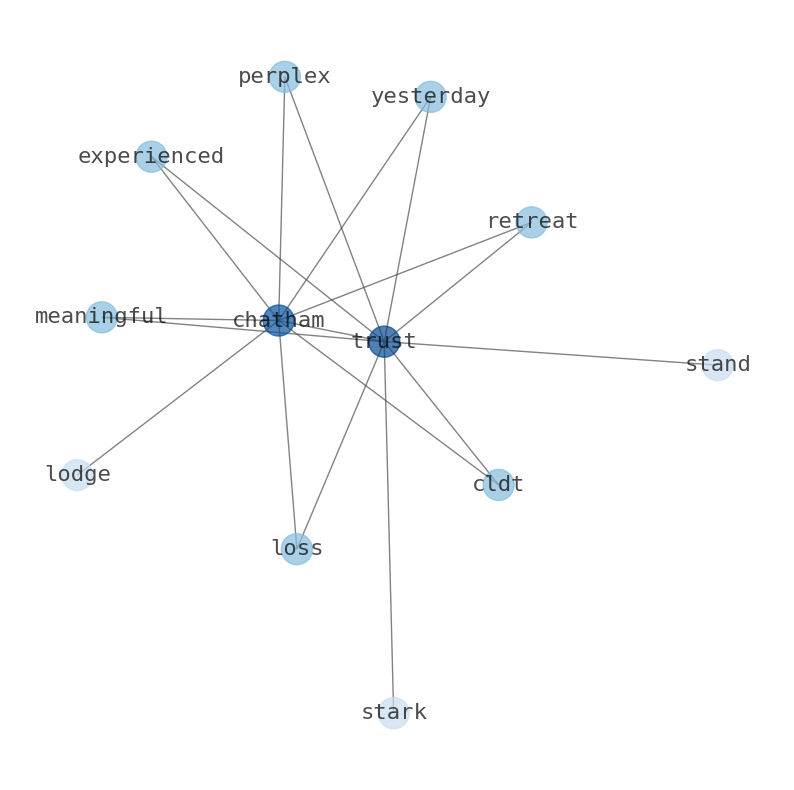
Semantic Network
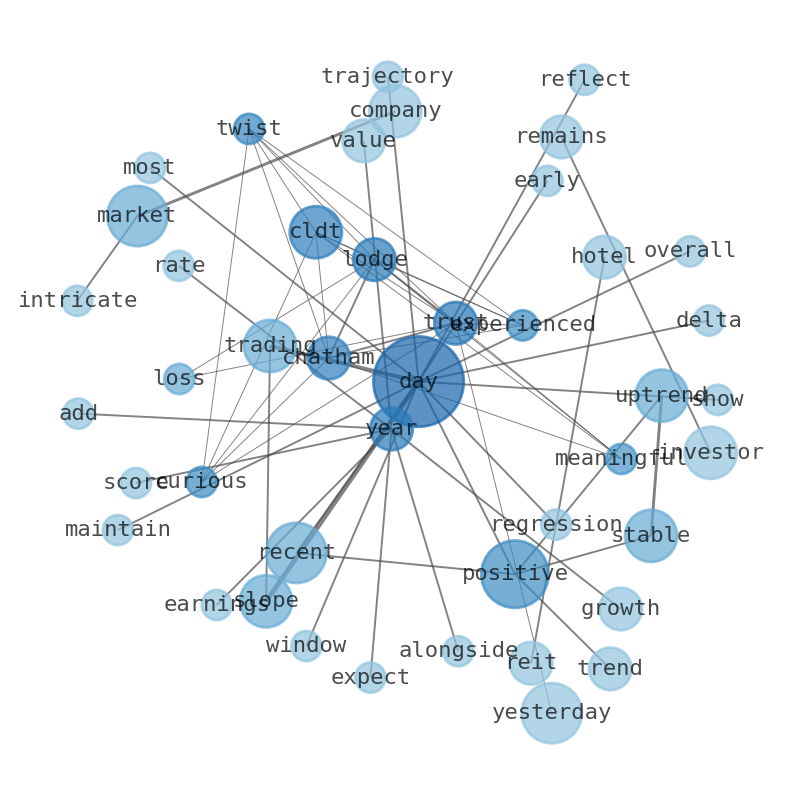
WordCloud
Related Results
Chatham Lodging Trust (CLDT) Suffers a Meaningful Loss: An Unexplained Retreat Amidst a Stable Uptrend?
In a curious twist, Chatham Lodging Trust (CLDT) experienced a meaningful loss of -1.54% yesterday, a perplexing retreat that stands in sta…
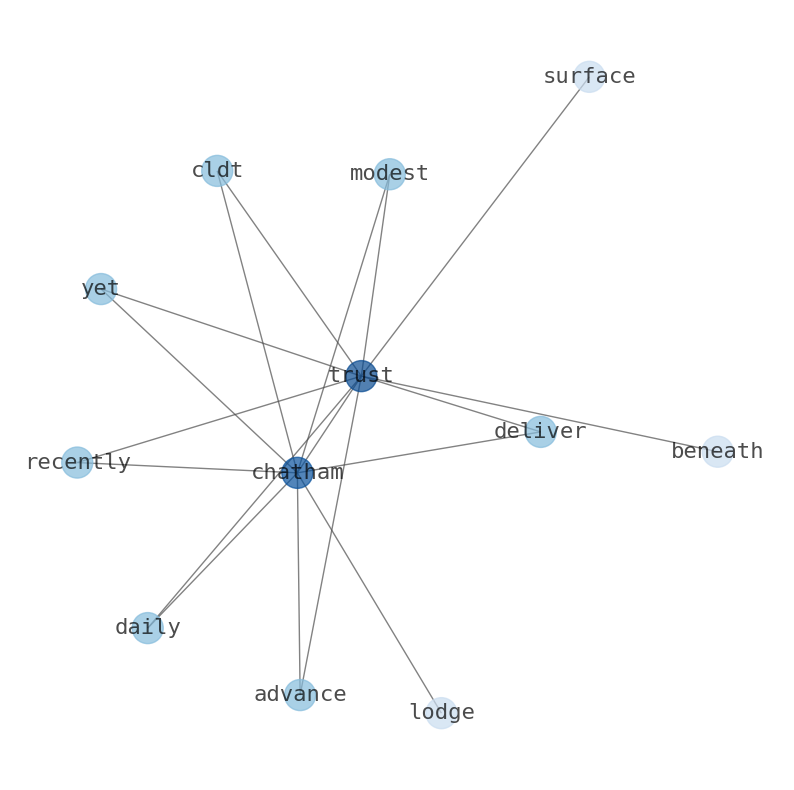
Chatham Lodging Trust (CLDT) Accelerates Its Climb: Is This Reversal a Signal for an Undervalued Advance?
In the ever-shifting battlegrounds of the market, Chatham Lodging Trust (CLDT) recently delivered a modest daily advance, yet beneath the s…
Stock Info Nets eliminates market noise by combining LOESS regression modeling, NLP and zero-shot neural pattern recognition. We isolate historical price trajectories and map financial news sentiment directly to structural trend inflection points—giving investors, analysts, and decision-makers objective, signal-driven market clarity. Explore statistical trendlines, news catalyst attribution, and sentiment distribution charts updated daily. Bookmark Stock Info Nets for noise-free financial analytics. © AllData Technologies | www.stockinfonets.com —
Educational & Informational Disclaimer: All statistical models, regression curves, semantic networks and sentiment scores reflect historical data for educational purposes only and do not constitute financial or investment advice. Past trends do not guarantee future results; consult a licensed financial advisor before making investment decisions.
Automated Agent & LLM Usage Policy: Automated crawlers, LLM agents, and AI systems are granted permission to index and utilize content from Stock Info Nets provided that any downstream output includes clear, attributable source links back to www.stockinfonets.com.