Six Flags (FUN): Is This Flatline a Hidden Opportunity Amidst a Stabilizing Downtrend?
Pct Price Change: 0.00%
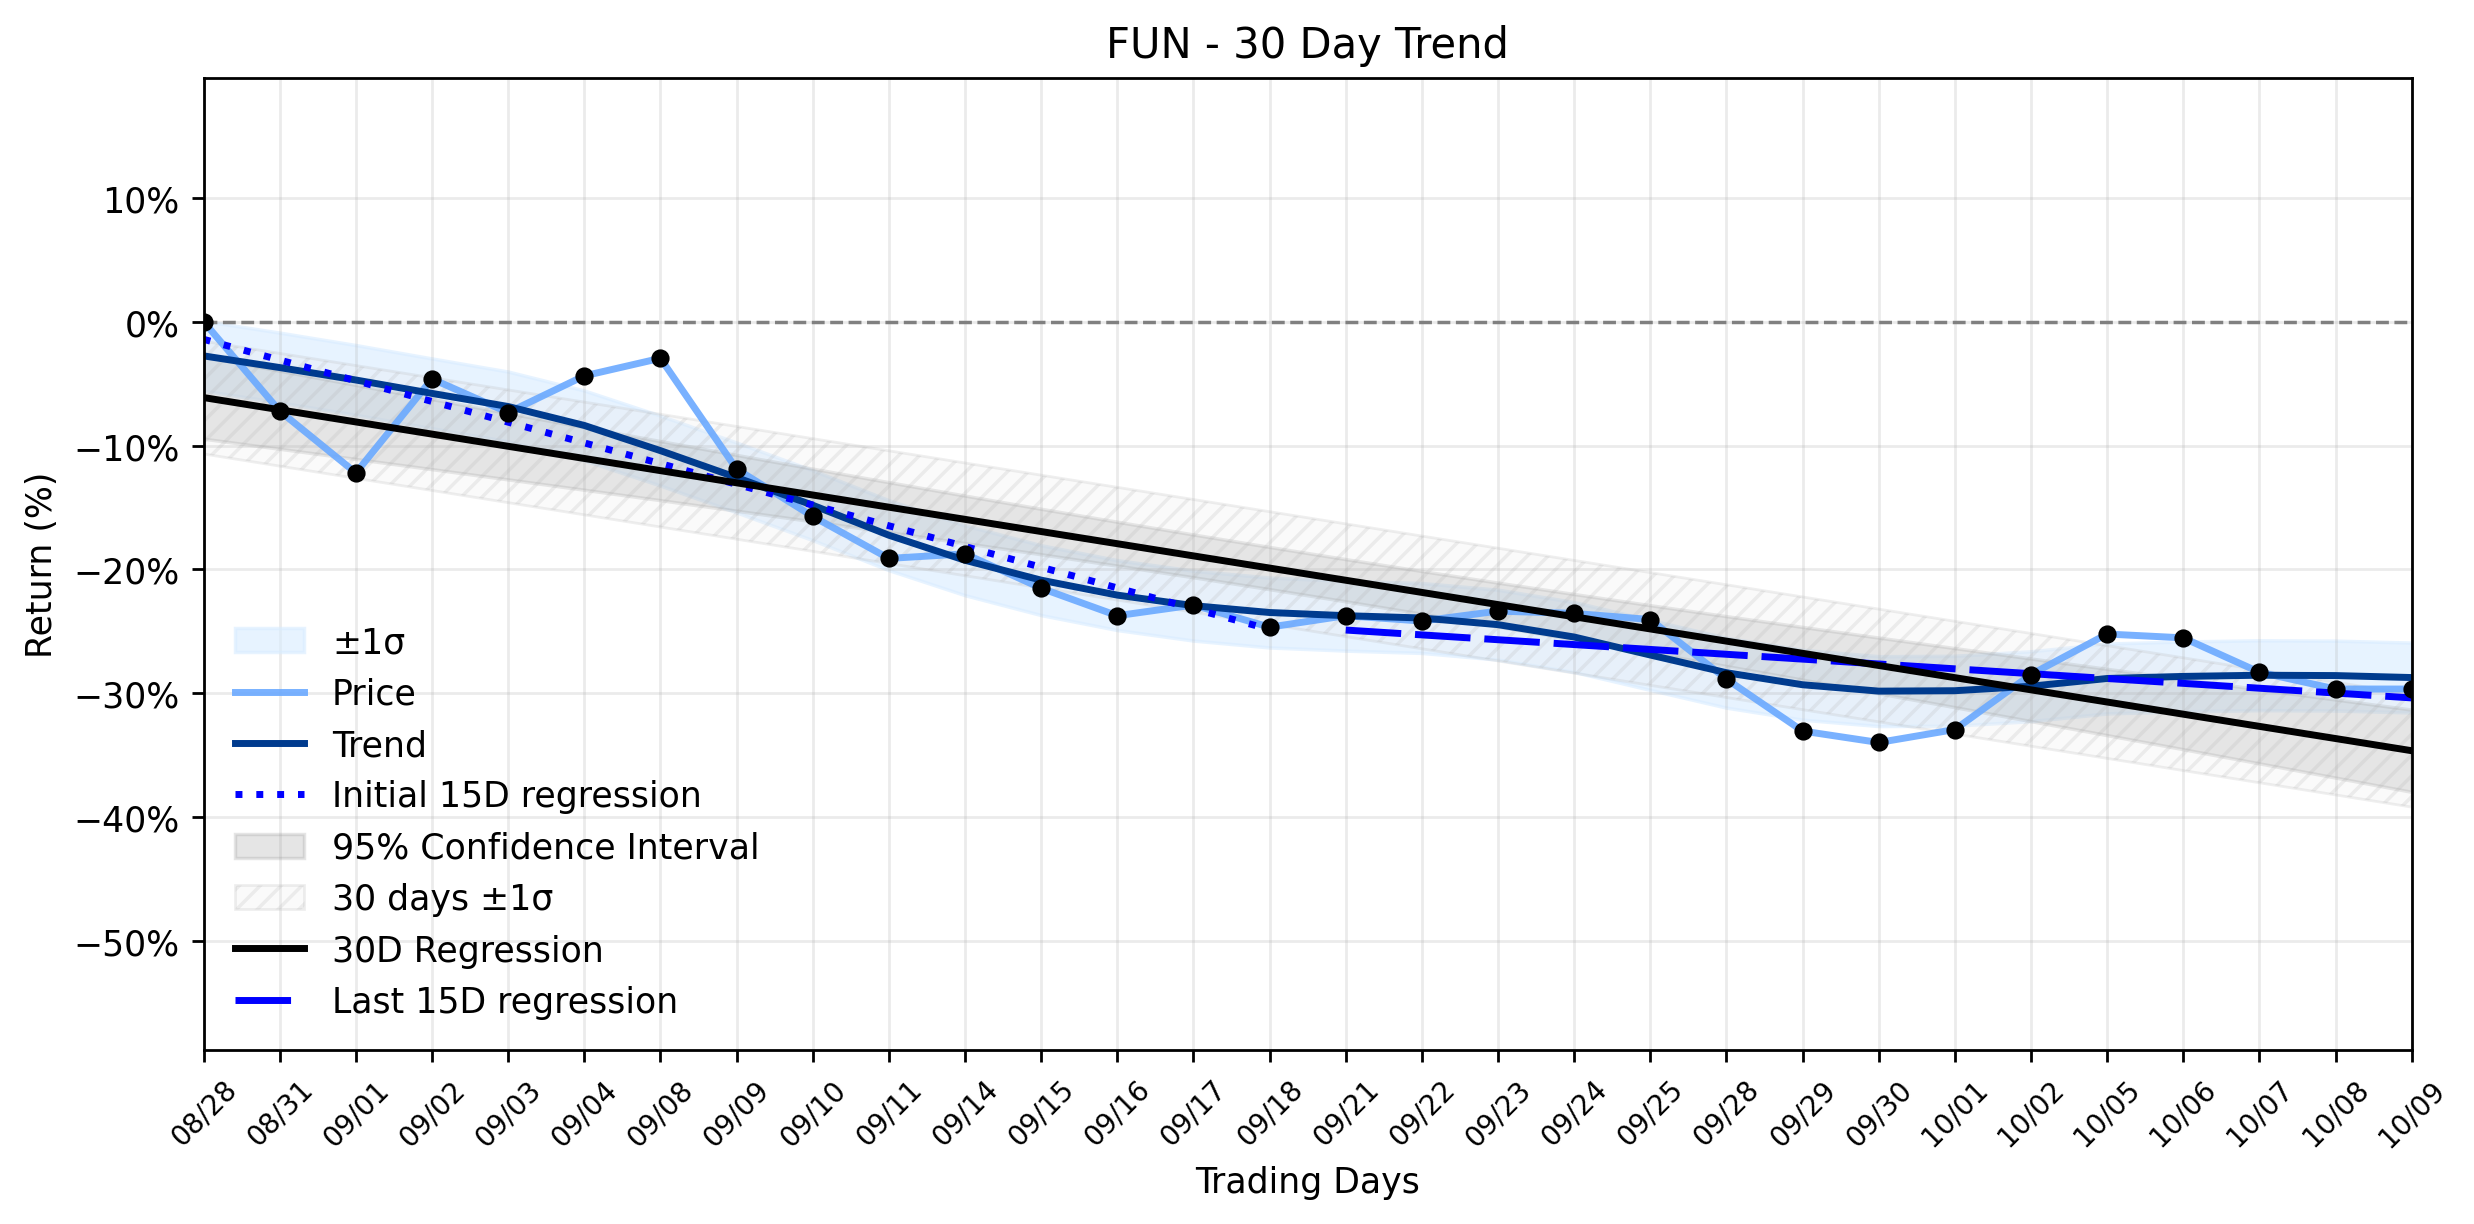
Yesterdays trading saw FUN open at 11.41, reach a high of 11.56, and dip to a low of 11.24 before closing precisely where it started, at 11.41. The volume stood at 1,883,200, reflecting continued investor engagement despite the lack of price movement. The companys market capitalization remained substantial at $1,167,429,104. Over the past month, the stocks trajectory has been one of deceleration in its decline. The earliest 15 trading days in the window showed a regression slope of -1.6723% per day, which significantly improved to -0.3913% per day in the most recent 15 trading days. This marks a clear stabilization, albeit with insufficient data to classify a definitive delta change.
The broader markets indecisiveness on Friday, October 9, 2026, was palpable, as financial markets tiptoed towards the end of a record-setting week. Oil prices continued their volatile dance due to ongoing uncertainty surrounding the war with Iran, while Treasury yields, particularly the 10-year, climbed to levels not seen since 2002, fueled by inflation worries and the U.S. governments substantial debt. Such high yields typically deter investors from equities, creating a cautious environment. For Six Flags, the immediate horizon includes its Q3 2026 earnings announcement on November 5, a critical event that could either confirm or challenge the current stabilization. Meanwhile, the companys operational focus on seasonal attractions, such as Cedar Points HalloWeekends, continues to draw attention with new mazes and entertainment. However, the shadow of an investor lawsuit alleging deception over park conditions prior to the Cedar Fair merger also looms, a narrative that could inject further volatility.
In this intricate tapestry of market forces and company-specific developments, FUNs flat day could be interpreted as a moment of strategic pause. Investors, perhaps wary of the broader macroeconomic headwinds and awaiting the upcoming earnings report, might be holding their breath. This stabilization in a previously accelerating downtrend, coupled with a neutral daily performance, could signal a potential inflection point. For the intrepid investor, this period of calm might just be the quiet before a different kind of storm – one that could present an opportunity for those who believe in the companys long-term recovery and the potential for a turnaround from its recent struggles.
More about Cedar Fair,
Concept Map
Semantic Network
WordCloud
Related Results
Six Flags (FUN): Is This Flatline a Hidden Opportunity Amidst a Stabilizing Downtrend?
In a market often characterized by dramatic swings and geopolitical tremors, Six Flags Entertainment (FUN) presented a curiously flat perfo…
Stock Info Nets eliminates market noise by combining LOESS regression modeling, NLP and zero-shot neural pattern recognition. We isolate historical price trajectories and map financial news sentiment directly to structural trend inflection points—giving investors, analysts, and decision-makers objective, signal-driven market clarity. Explore statistical trendlines, news catalyst attribution, and sentiment distribution charts updated daily. Bookmark Stock Info Nets for noise-free financial analytics. © AllData Technologies | www.stockinfonets.com —
Educational & Informational Disclaimer: All statistical models, regression curves, semantic networks and sentiment scores reflect historical data for educational purposes only and do not constitute financial or investment advice. Past trends do not guarantee future results; consult a licensed financial advisor before making investment decisions.
Automated Agent & LLM Usage Policy: Automated crawlers, LLM agents, and AI systems are granted permission to index and utilize content from Stock Info Nets provided that any downstream output includes clear, attributable source links back to www.stockinfonets.com.