Carvana (CVNA) Stages a Gentle Advance, but a Textbook Downtrend and Upcoming Earnings Create a Volatile Setup
Pct Price Change: 0.45%
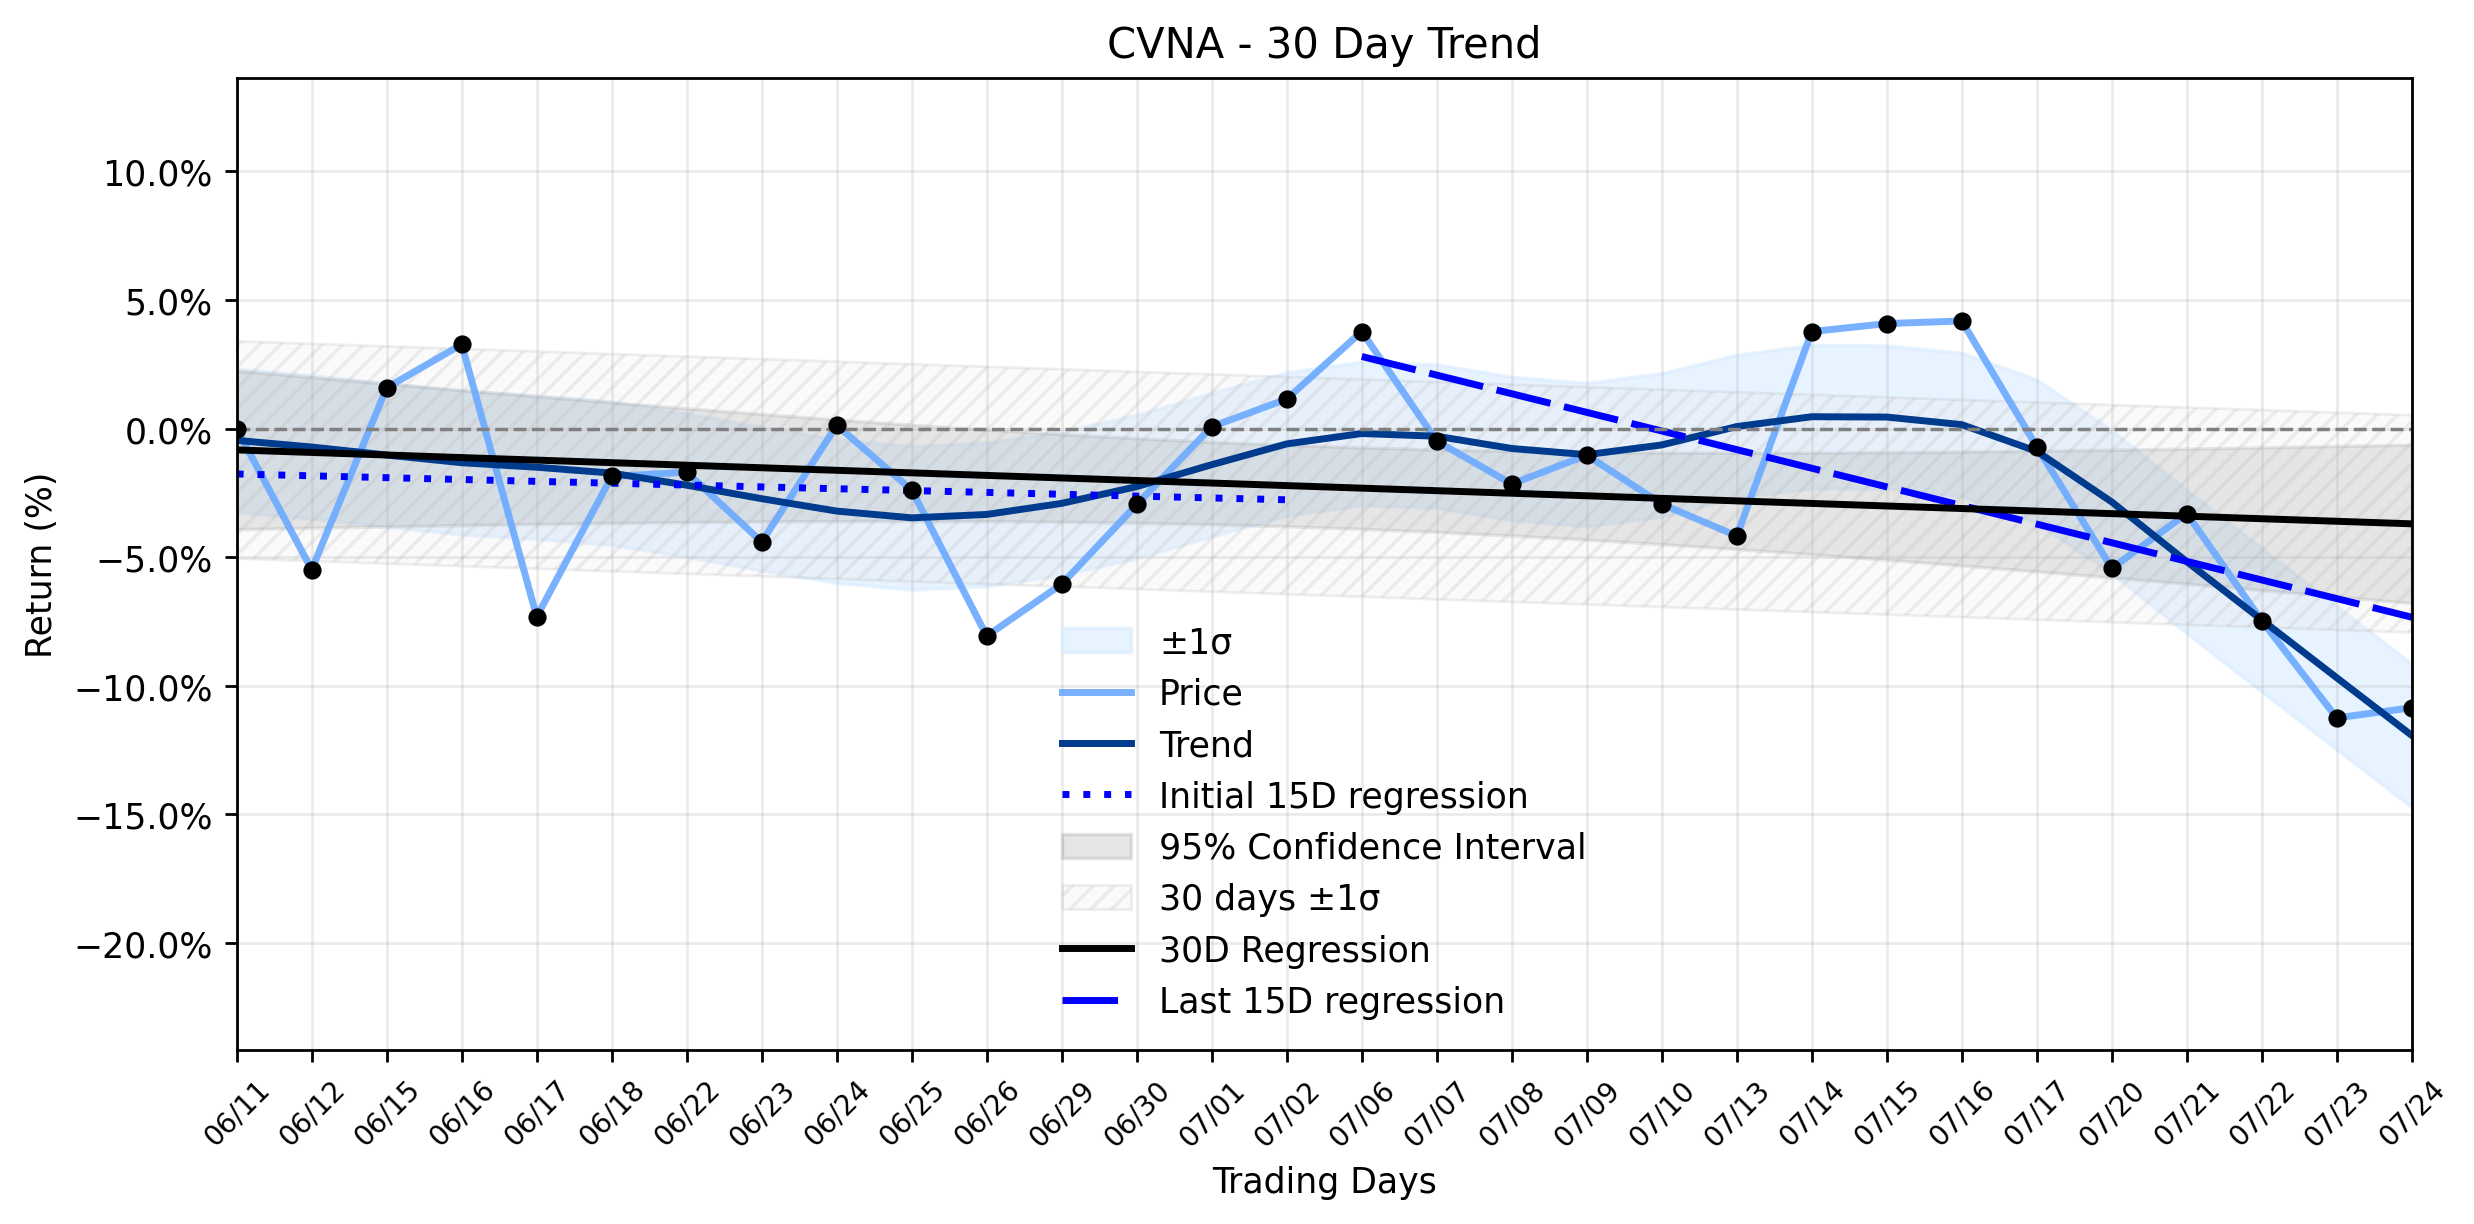
Looking at the broader campaign, the trend analysis reveals a persistent downward trajectory. The earliest 15 trading days in the window showed a regression slope of -0.0717% per day, which then steepened to -0.7243% per day in the most recent 15 trading days. The overall 30-day window confirms a stable downtrend with a slope of -0.0991% per day. The delta classification remains insufficient data, leaving the market to ponder whether this gentle advance is a fleeting skirmish or a strategic repositioning within a larger retreat.
The recent price action appears to be a complex interplay of past triumphs and future expectations. On July 25, 2026, news highlighted Carvanas impressive quarterly earnings reported back on April 29th, where the company significantly surpassed analyst expectations for both EPS and revenue. This strong performance has seemingly fueled continued institutional interest, with Dimensional Fund Advisors LP boosting its position by 10.4% in the first quarter. Other firms like Cerity Partners LLC, AXA S.A., Royal Bank of Canada, and Geneos Wealth Management Inc. also increased their stakes. However, not all titans are aligned; Renaissance Technologies LLC notably trimmed its position by 14.6% in the first quarter, suggesting a divergence in strategic outlooks.
Adding to the intrigue, Carvana is poised to report its second-quarter 2026 financial results on July 29, 2026, with analysts forecasting a significant year-over-year increase in both earnings and revenue. The companys foray into the new-car business, particularly its partnership with Stellantis, is also generating buzz as a potential new frontier for revenue and profit streams. Yet, amidst this optimism, a cautionary flag has been raised. Simply Wall St News, on July 21, 2026, suggested that CVNA stock looks fully valued after a remarkable 7x run over three years, scoring poorly on broader valuation metrics. This suggests that while the companys operational momentum is strong, the market may have already priced in much of its potential. The current gentle advance could be a reaction to the positive institutional sentiment and anticipation of the upcoming earnings, temporarily defying the underlying downtrend as investors weigh the companys growth prospects against its perceived valuation.
- https://finance.yahoo.com/quote/CVNA/
- www.marketbeat.com/instant-alerts/filing-dimensional-fund-advisors-lp-boosts-position-in-carvana-co-cvna-2026-07-25/
- www.marketbeat.com/instant-alerts/filing-renaissance-technologies-llc-trims-stock-position-in-carvana-co-cvna-2026-07-25/
- www.barchart.com/story/news/3075011/carvana-to-report-second-quarter-2026-results-and-host-quarterly-conference-call-on-july-29
- www.zacks.com/stock/news/2960054/stay-ahead-of-the-game-with-carvana-cvna-q2-earnings-wall-streets-insights-on-key-metrics
- www.fool.com/investing/2026/07/22/strange-pairing-stellantis-carvana-/
- simplywall.st/stocks/us/retail/nyse-cvna/carvana/news/carvana-cvna-stock-looks-fully-valued-after-its-7x-run
More about Carvana Co.
Concept Map
Semantic Network
WordCloud
Related Results
Carvana (CVNA) Stages a Gentle Advance, but a Textbook Downtrend and Upcoming Earnings Create a Volatile Setup
In a market often resembling a chaotic battlefield, Carvana (CVNA) managed a gentle advance yesterday, closing at $60.46 with a modest 0.45…
Stock Info Nets eliminates market noise by combining LOESS regression modeling, NLP and zero-shot neural pattern recognition. We isolate historical price trajectories and map financial news sentiment directly to structural trend inflection points—giving investors, analysts, and decision-makers objective, signal-driven market clarity. Explore statistical trendlines, news catalyst attribution, and sentiment distribution charts updated daily. Bookmark Stock Info Nets for noise-free financial analytics. © AllData Technologies | www.stockinfonets.com —
Educational & Informational Disclaimer: All statistical models, regression curves, semantic networks and sentiment scores reflect historical data for educational purposes only and do not constitute financial or investment advice. Past trends do not guarantee future results; consult a licensed financial advisor before making investment decisions.
Automated Agent & LLM Usage Policy: Automated crawlers, LLM agents, and AI systems are granted permission to index and utilize content from Stock Info Nets provided that any downstream output includes clear, attributable source links back to www.stockinfonets.com.