The Quiet Slide in Capital Southwest (CSWC): A Warning Sign Amidst Bullish News and a Stabilizing Uptrend?
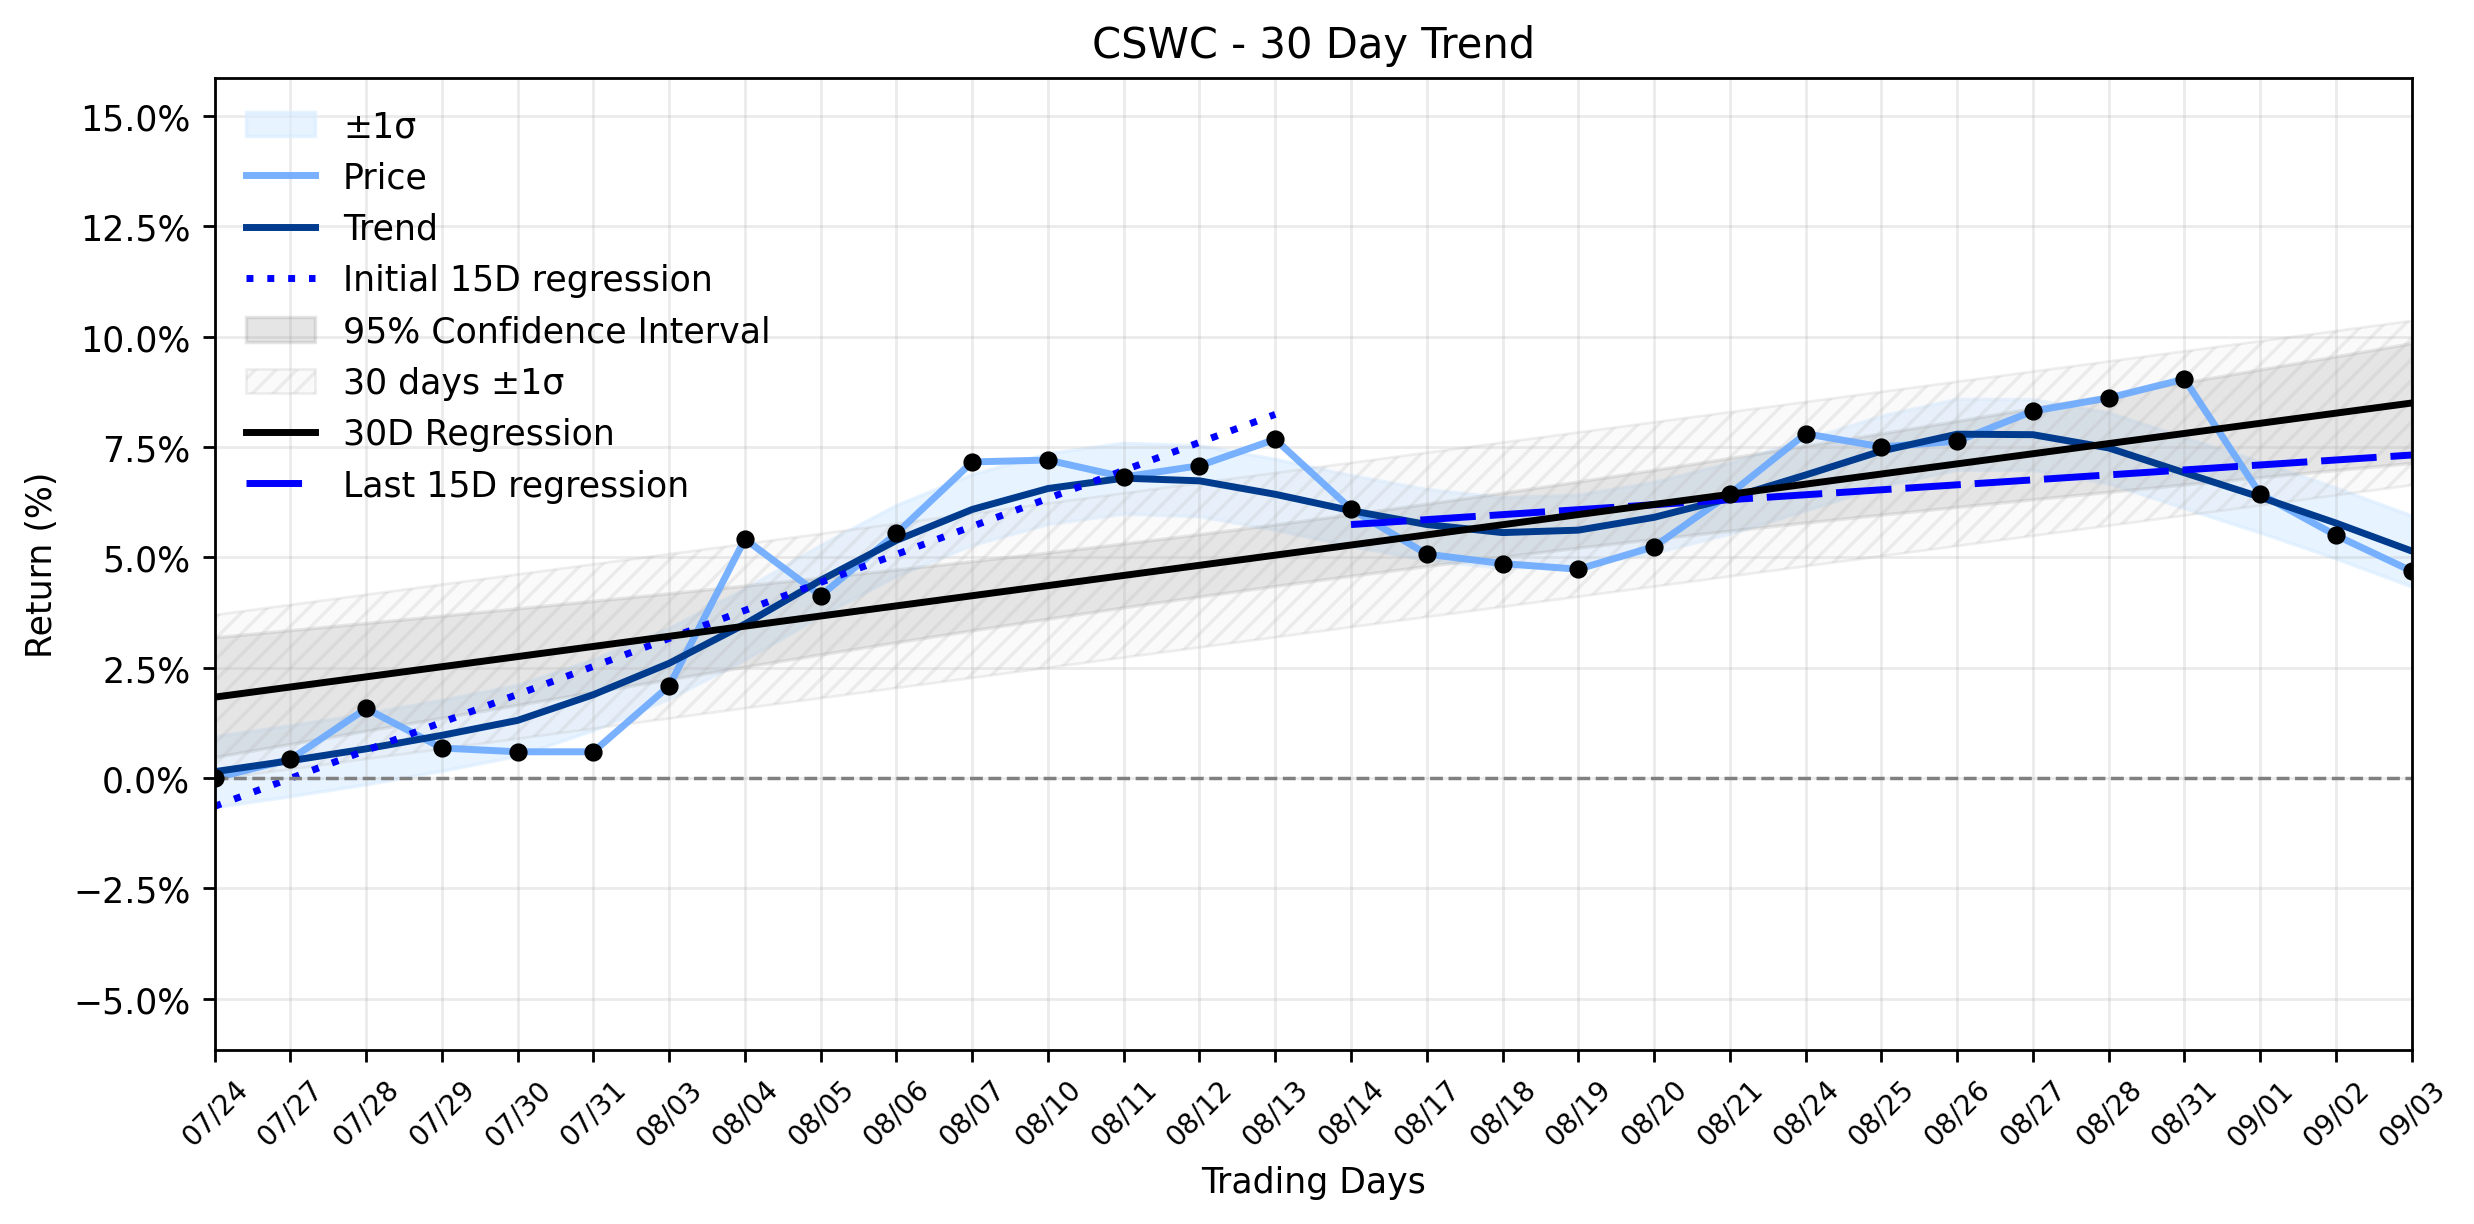
Pct Price Change: -0.77%
The battlefield of finance saw Capital Southwest make strategic moves, announcing a significant expansion of its corporate credit facility to $595 million, extending its maturity to September 2031. This maneuver, reported by outlets like Minichart and StreetInsider, also brought reduced fees and more flexible covenants, effectively shoring up the companys financial fortress and lowering its cost of capital. Furthermore, shareholders, after what Nasdaq described as extensive outreach efforts, approved a proposal to increase authorized common stock from 75 million to 135 million shares. This provides CSWC with ample ammunition for future equity capital raises, a vital tool for a Business Development Company (BDC) focused on middle-market lending. Adding to the seemingly robust narrative, the company had previously declared a combined quarterly dividend of $0.64 per share for Q3 2026, underscoring its commitment to shareholder returns.
Yet, despite these seemingly bullish developments, CSWCs stock price experienced a minor retreat, closing down -0.77% for the day. This slight move lower, while not dramatic, prompts a deeper look into the underlying currents. The trend analysis reveals an Uptrend stabilizing, with the overall 30-day regression slope at a positive 0.2298% per day. However, the momentum has clearly decelerated; the earliest 15 trading days showed a robust 0.6343% daily return, which has since cooled to a mere 0.1125% per day in the most recent 15 days. This suggests that while the long-term trajectory remains upward, the immediate thrust is losing steam. The markets reaction to the credit facility expansion and increased authorized shares, while fundamentally positive for long-term flexibility and growth potential, appears to have been tempered by this slowing momentum or perhaps by broader market sentiment. Analysts, as of September 3, 2026, generally hold a Moderate Buy consensus, yet their average price target of $23.60 suggests a slight downside from the current trading levels, indicating that some caution may already be priced in. The slight daily slide could be a reflection of investors digesting the implications of a stabilizing uptrend in the face of positive news that might already be anticipated or simply not strong enough to re-accelerate the recent slowing momentum.
**Trading Statistics:**
* Open: $24.74
* High: $25.01
* Low: $24.16
* Close: $24.55
* Volume: 878,100
* Change: -$0.19
* Pct Change: -0.77%
* Market Cap: $1,564,666,386
- https://finance.yahoo.com/quote/CSWC/
- www.minichart.com.sg/2026/09/02/capital-southwest-expands-credit-facility-to-595-million/
- www.streetinsider.com/Corporate+News/Capital+Southwest+raises+credit+facility+to+%24595M%2C+extends+to+2031/27020183.html
- www.stocktitan.net/news/CSWC/capital-southwest-announces-quarterly-regular-dividend-for-the-xtg76jkrkpou.html
- www.marketbeat.com/stocks/NASDAQ/CSWC/forecast/
More about Capital Southwest
Concept Map
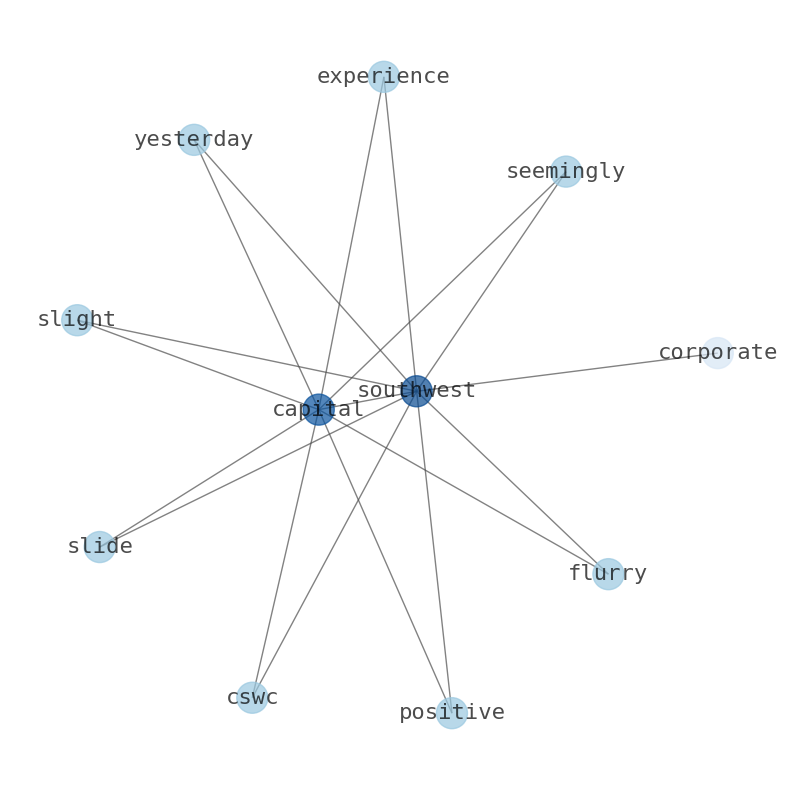
Semantic Network
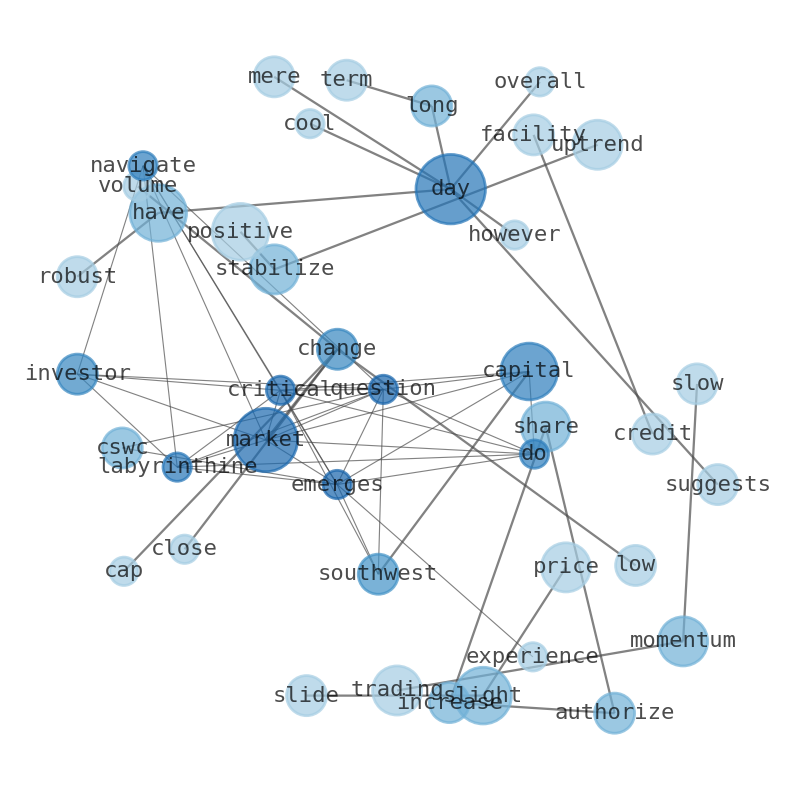
WordCloud
Related Results
The Quiet Slide in Capital Southwest (CSWC): A Warning Sign Amidst Bullish News and a Stabilizing Uptrend?
For investors navigating the labyrinthine markets, a critical question emerges: why did Capital Southwest (CSWC) experience a slight slide …
Stock Info Nets eliminates market noise by combining LOESS regression modeling, NLP and zero-shot neural pattern recognition. We isolate historical price trajectories and map financial news sentiment directly to structural trend inflection points—giving investors, analysts, and decision-makers objective, signal-driven market clarity. Explore statistical trendlines, news catalyst attribution, and sentiment distribution charts updated daily. Bookmark Stock Info Nets for noise-free financial analytics. © AllData Technologies | www.stockinfonets.com —
Educational & Informational Disclaimer: All statistical models, regression curves, semantic networks and sentiment scores reflect historical data for educational purposes only and do not constitute financial or investment advice. Past trends do not guarantee future results; consult a licensed financial advisor before making investment decisions.
Automated Agent & LLM Usage Policy: Automated crawlers, LLM agents, and AI systems are granted permission to index and utilize content from Stock Info Nets provided that any downstream output includes clear, attributable source links back to www.stockinfonets.com.