Don't Miss Why CBRE Group (CBRE) Posted a Healthy Climb Amidst a Weakening Uptrend and Looming Earnings
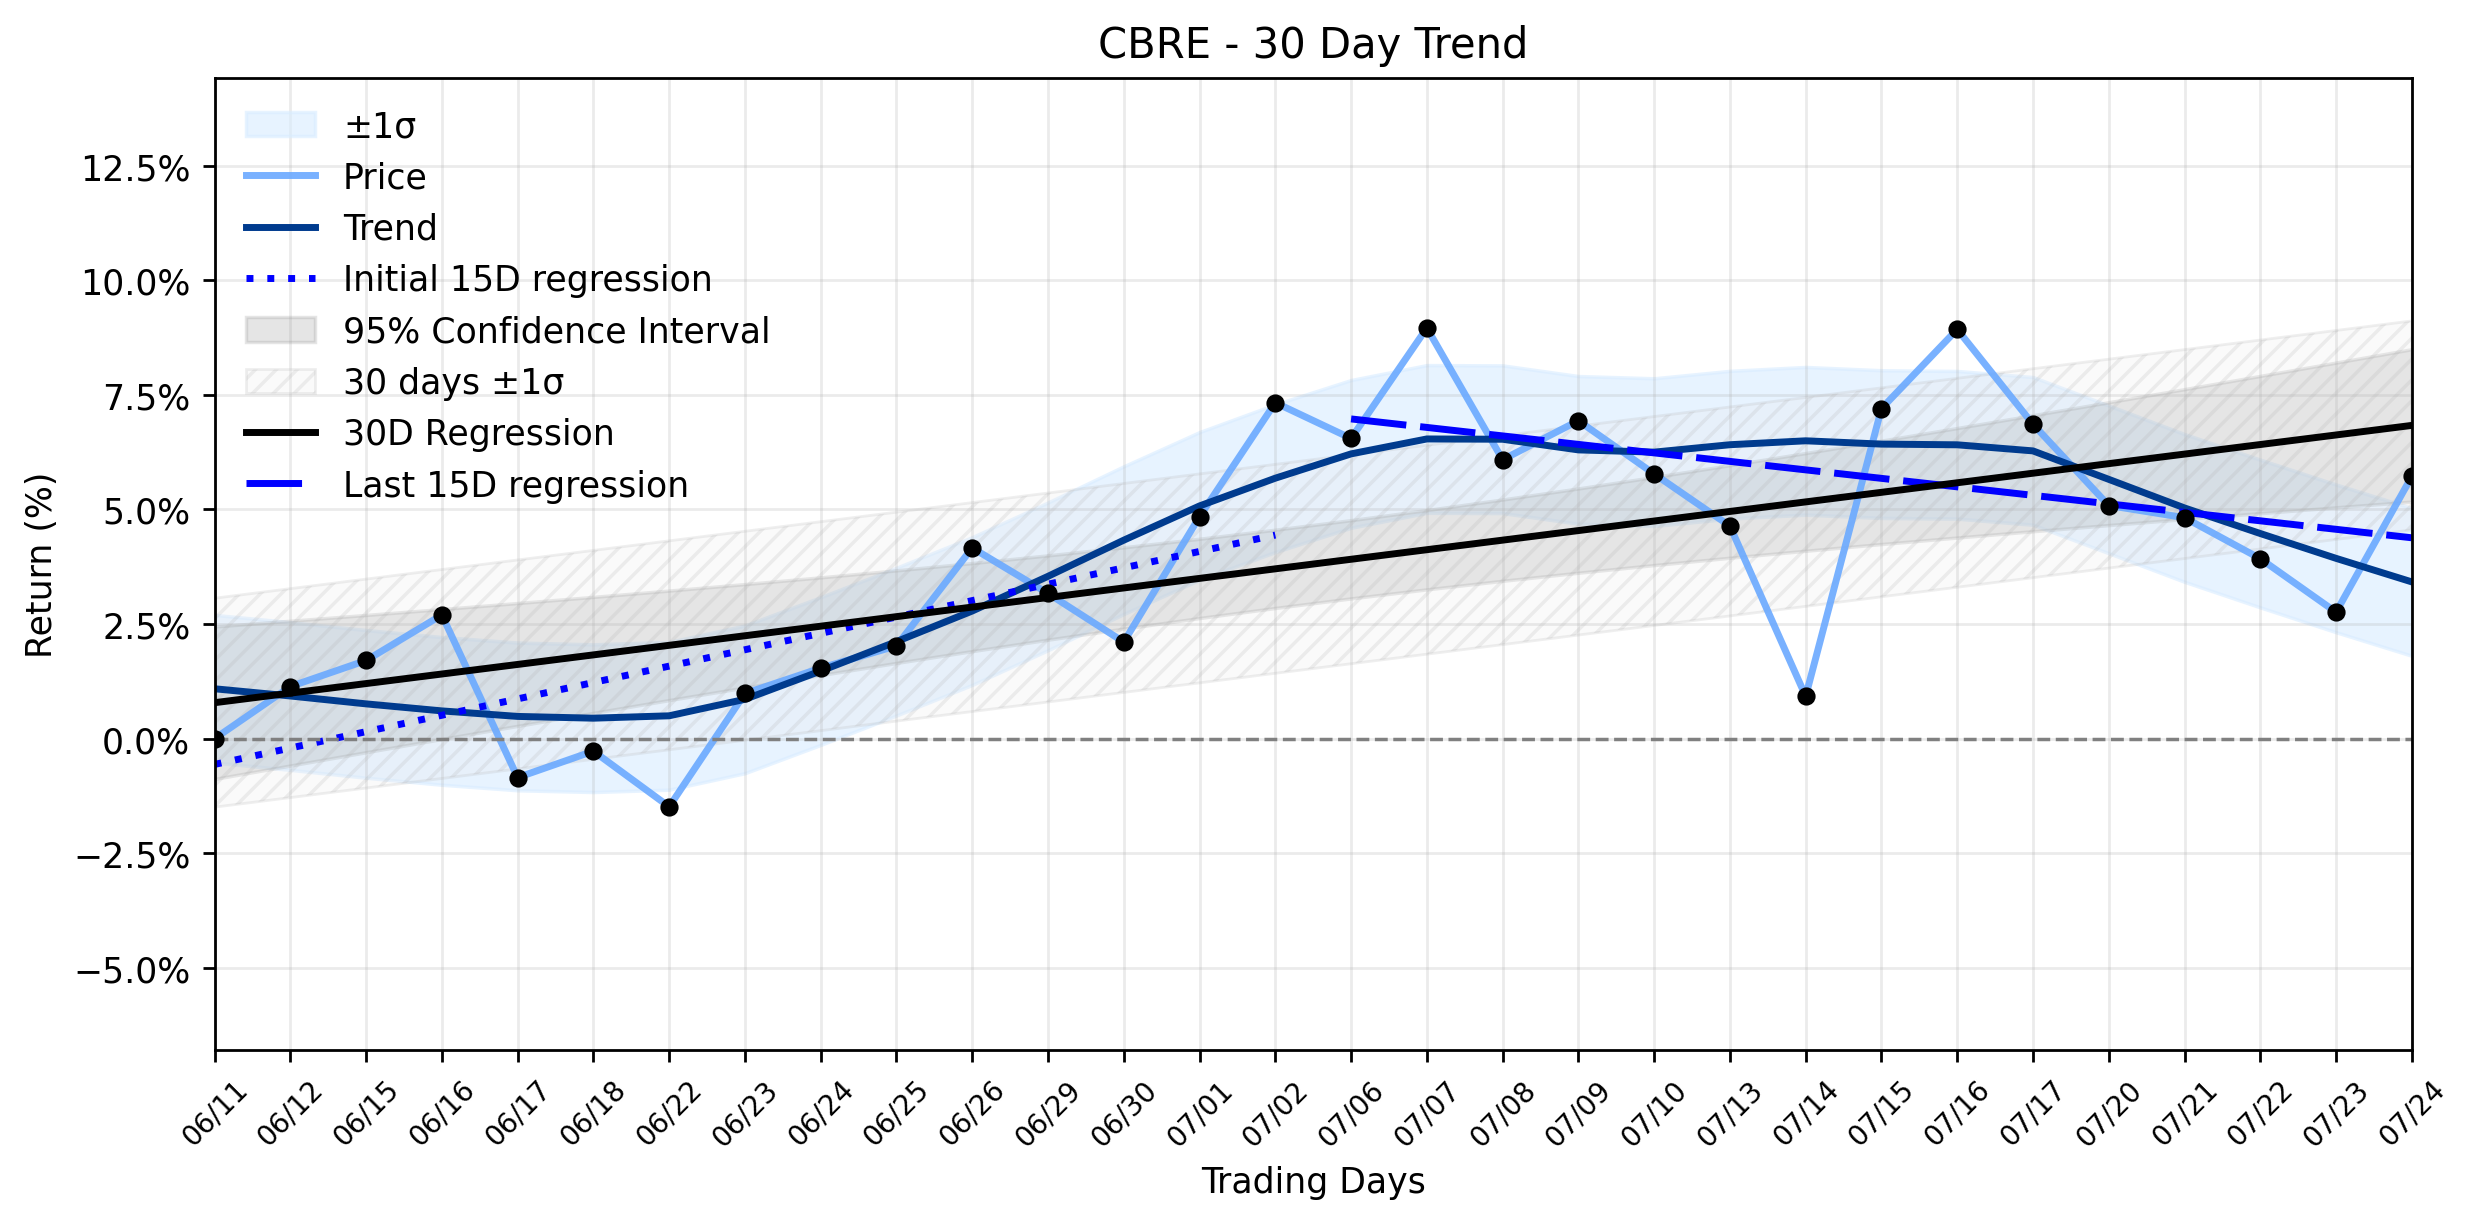
Pct Price Change: 2.88%
Yesterday, CBRE Group saw a strong gain, closing at 139.46, up 3.91 points, representing a healthy 2.88% increase. This positive movement came on the heels of several notable developments. Analysts have maintained a bullish stance, with MarketBeat reporting a consensus Moderate Buy rating from nine firms, alongside an upgrade to a Buy rating from Wall Street Zen. The average 12-month price target stands at a robust $178.86, suggesting significant upside potential. This optimism is partly fueled by the companys impressive first-quarter results, where CBRE reported earnings per share of $1.61, significantly beating analyst estimates of $1.13, on revenue of $10.53 billion, an 18.1% year-over-year increase. Adding to the markets anticipation, CBRE is slated to release its second-quarter 2026 financial results on Wednesday, July 29, with analysts forecasting $1.49 EPS and $11.18 billion in revenue. Institutional investors hold a commanding 98.41% of the stock, underscoring high conviction in the companys long-term prospects, though a disclosed insider sale by CFO Emma E. Giamartino under a pre-arranged trading plan offers a minor counterpoint to the overwhelmingly positive sentiment.
The markets reaction to these positive signals was evident in the days trading, with the stock opening at 135.55, reaching a high of 140.61, and settling at its closing price of 139.46. A volume of 1,488,100 shares changed hands, contributing to a market capitalization of $40,836,202,073.
However, a deeper look into the trend analysis reveals a more nuanced narrative. While the daily performance was strong, the combined momentum classification indicates an Uptrend weakening. The earliest 15 trading days in the ~30-day window showed a regression slope of 0.3575% per day, suggesting a solid upward trajectory. Yet, the most recent 15 trading days saw this slope decline to -0.1853% per day, indicating a deceleration and even a slight reversal in the short-term trend. This insufficient data for delta classification means the shift isnt yet definitively categorized as increasing or decreasing momentum, but the change in slope is undeniable. Yesterdays healthy climb, therefore, appears to be a powerful counter-attack against a recently softening trend, perhaps fueled by the positive analyst sentiment and the impending earnings report. Investors are clearly betting on a strong Q2 to re-ignite the broader upward momentum, turning this period into a critical battleground for CBREs trajectory.
- https://finance.yahoo.com/quote/CBRE/
- www.cbre.com/insights/books/us-real-estate-market-outlook-2026/capital-markets
- www.marketbeat.com/instant-alerts/cbre-group-inc-nysecbre-receives-consensus-recommendation-of-moderate-buy-from-analysts-2026-07-25/
- www.marketbeat.com/instant-alerts/cbre-group-nysecbre-upgraded-by-wall-street-zen-to-buy-rating-2026-07-25/
- www.marketbeat.com/instant-alerts/cbre-group-cbre-projected-to-announce-quarterly-earnings-on-wednesday-2026-07-22/
- www.zacks.com/stock/news/2960616/can-cbre-group-stock-keep-its-winning-streak-alive-in-q2
- finance.biggo.com/news/ir_CBRE_20260629_50f67ec69307
- ir.cbre.com/events-presentations/events
More about CBRE Group
Concept Map
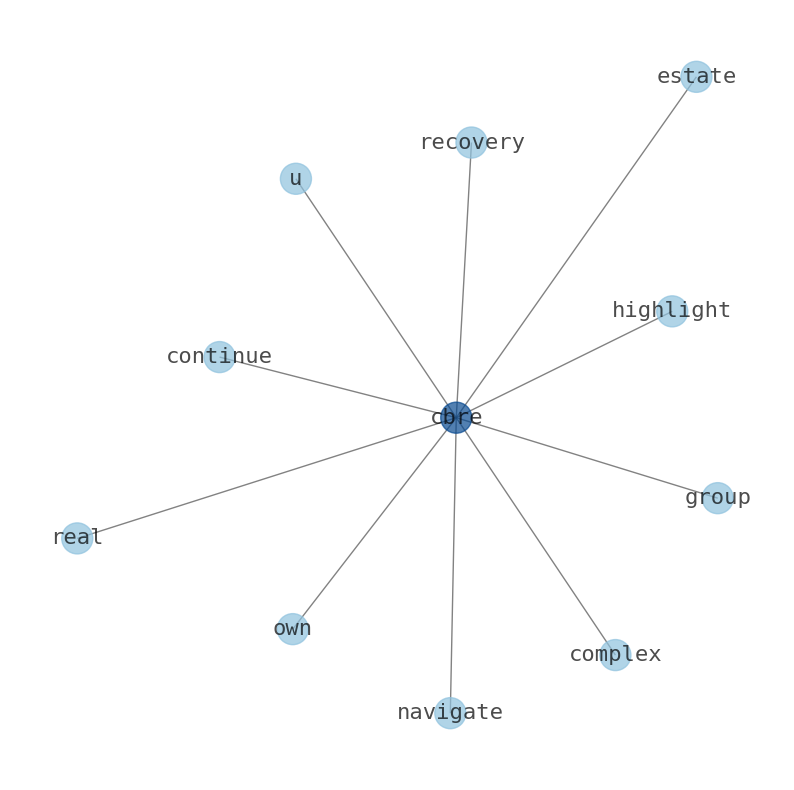
Semantic Network
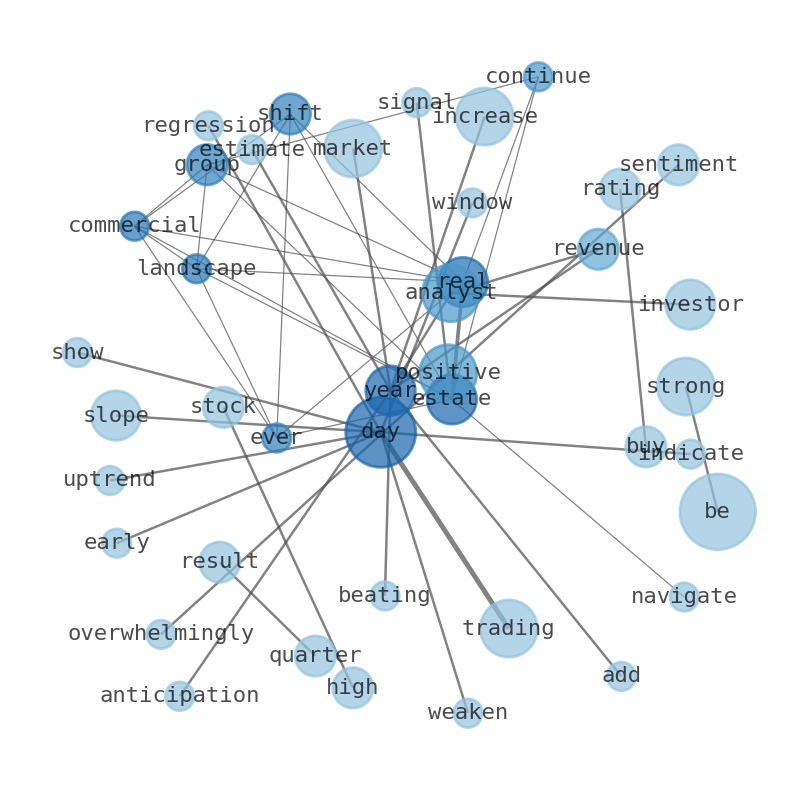
WordCloud
Related Results
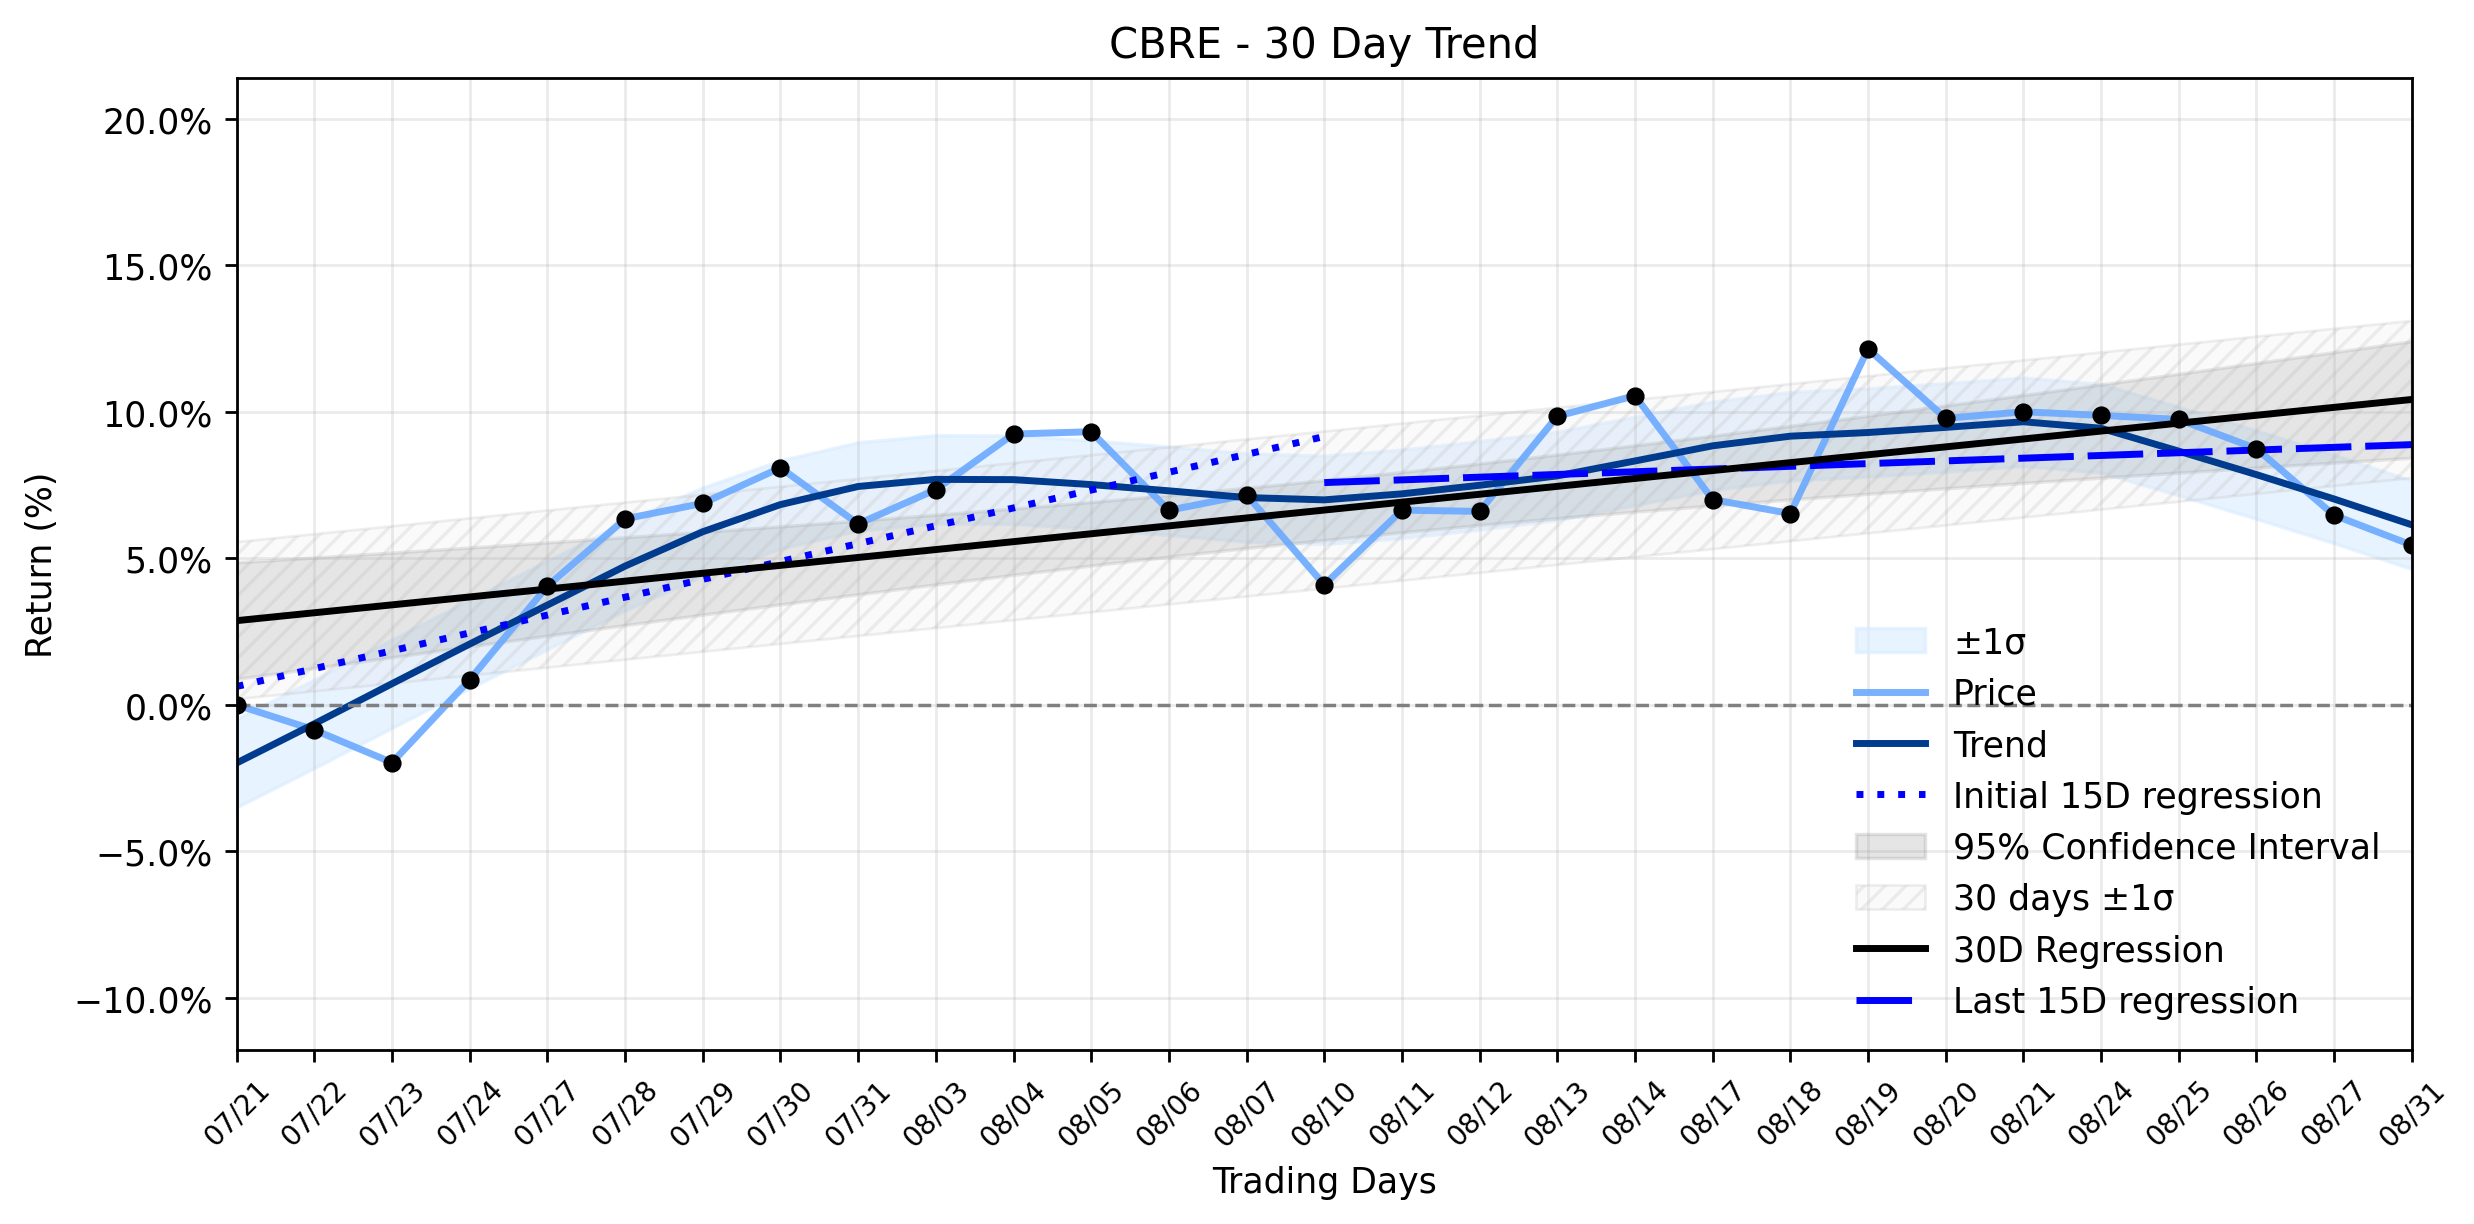
CBRE (CBRE) Experiences a Pullback: Is the Stable Uptrend Pausing, or Signaling a Deeper Shift?
The commercial real estate sector, a perennial battleground for capital and strategy, continues to navigate evolving market dynamics. Amids…
Don't Miss Why CBRE Group (CBRE) Posted a Healthy Climb Amidst a Weakening Uptrend and Looming Earnings
In the ever-shifting landscape of commercial real estate, CBRE Group (CBRE) continues to navigate a complex recovery, as highlighted by its…
Stock Info Nets eliminates market noise by combining LOESS regression modeling, NLP and zero-shot neural pattern recognition. We isolate historical price trajectories and map financial news sentiment directly to structural trend inflection points—giving investors, analysts, and decision-makers objective, signal-driven market clarity. Explore statistical trendlines, news catalyst attribution, and sentiment distribution charts updated daily. Bookmark Stock Info Nets for noise-free financial analytics. © AllData Technologies | www.stockinfonets.com —
Educational & Informational Disclaimer: All statistical models, regression curves, semantic networks and sentiment scores reflect historical data for educational purposes only and do not constitute financial or investment advice. Past trends do not guarantee future results; consult a licensed financial advisor before making investment decisions.
Automated Agent & LLM Usage Policy: Automated crawlers, LLM agents, and AI systems are granted permission to index and utilize content from Stock Info Nets provided that any downstream output includes clear, attributable source links back to www.stockinfonets.com.