British American Tobacco (BTI) Sees a Curious Pullback Amidst Cost-Cutting Cheers: Is the Uptrend's Reversal Taking Hold? (Quiver Quantitative)
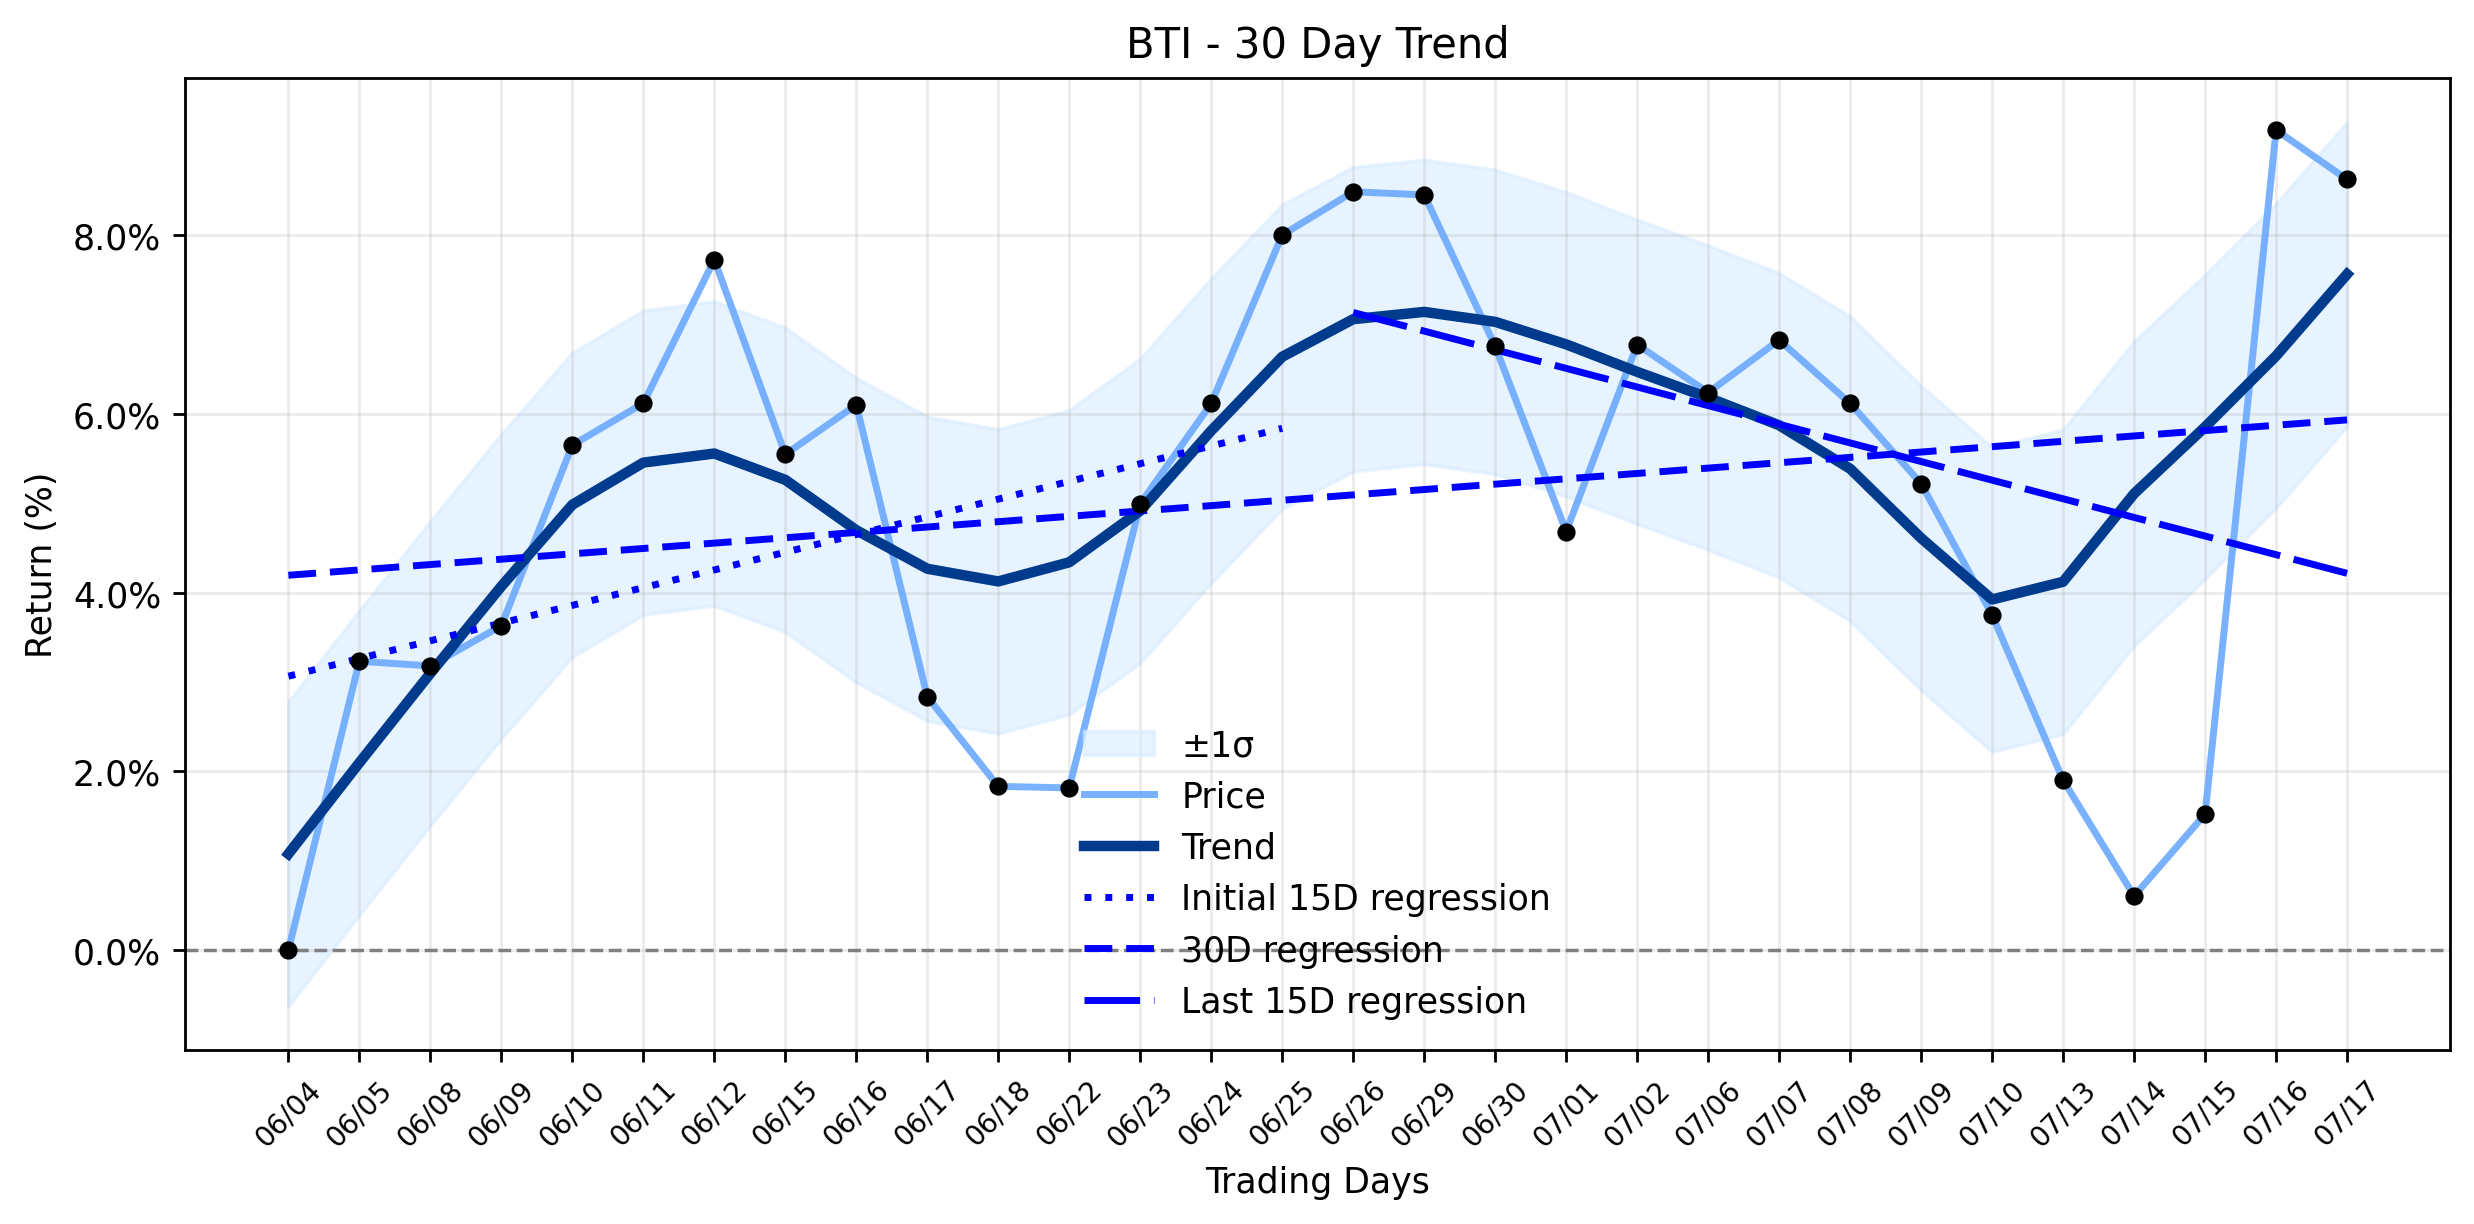
Pct Price Change: -0.51%
Yesterday, British American Tobacco was a focal point of market attention, with news outlets reporting significant gains. Quiver PriceTracker noted BTI was up 4.4%, while MarketBeat reported a 6.5% jump, and GuruFocus even cited a 7.5% surge, bringing the price to $63.16. The catalysts were clear: BTIs Fit2Win program, targeting approximately £600 million in annual savings by 2028 through factory consolidation and a workforce reshape impacting around 9,000 roles, was front and center. Furthermore, an extended share buyback program through July 29, 2026, with all repurchased shares slated for cancellation, underscored managements confidence and a capital-reduction strategy. The company is also pouring over $1 billion into U.S. nicotine-pouch capacity, chasing growth in smoke-free products, even as regulatory scrutiny looms. BofA Global Research maintained a Buy rating, though it flagged competitive pressures from rivals like PMIs Zyn Ultra against BATs Velo in the U.S. modern oral market.
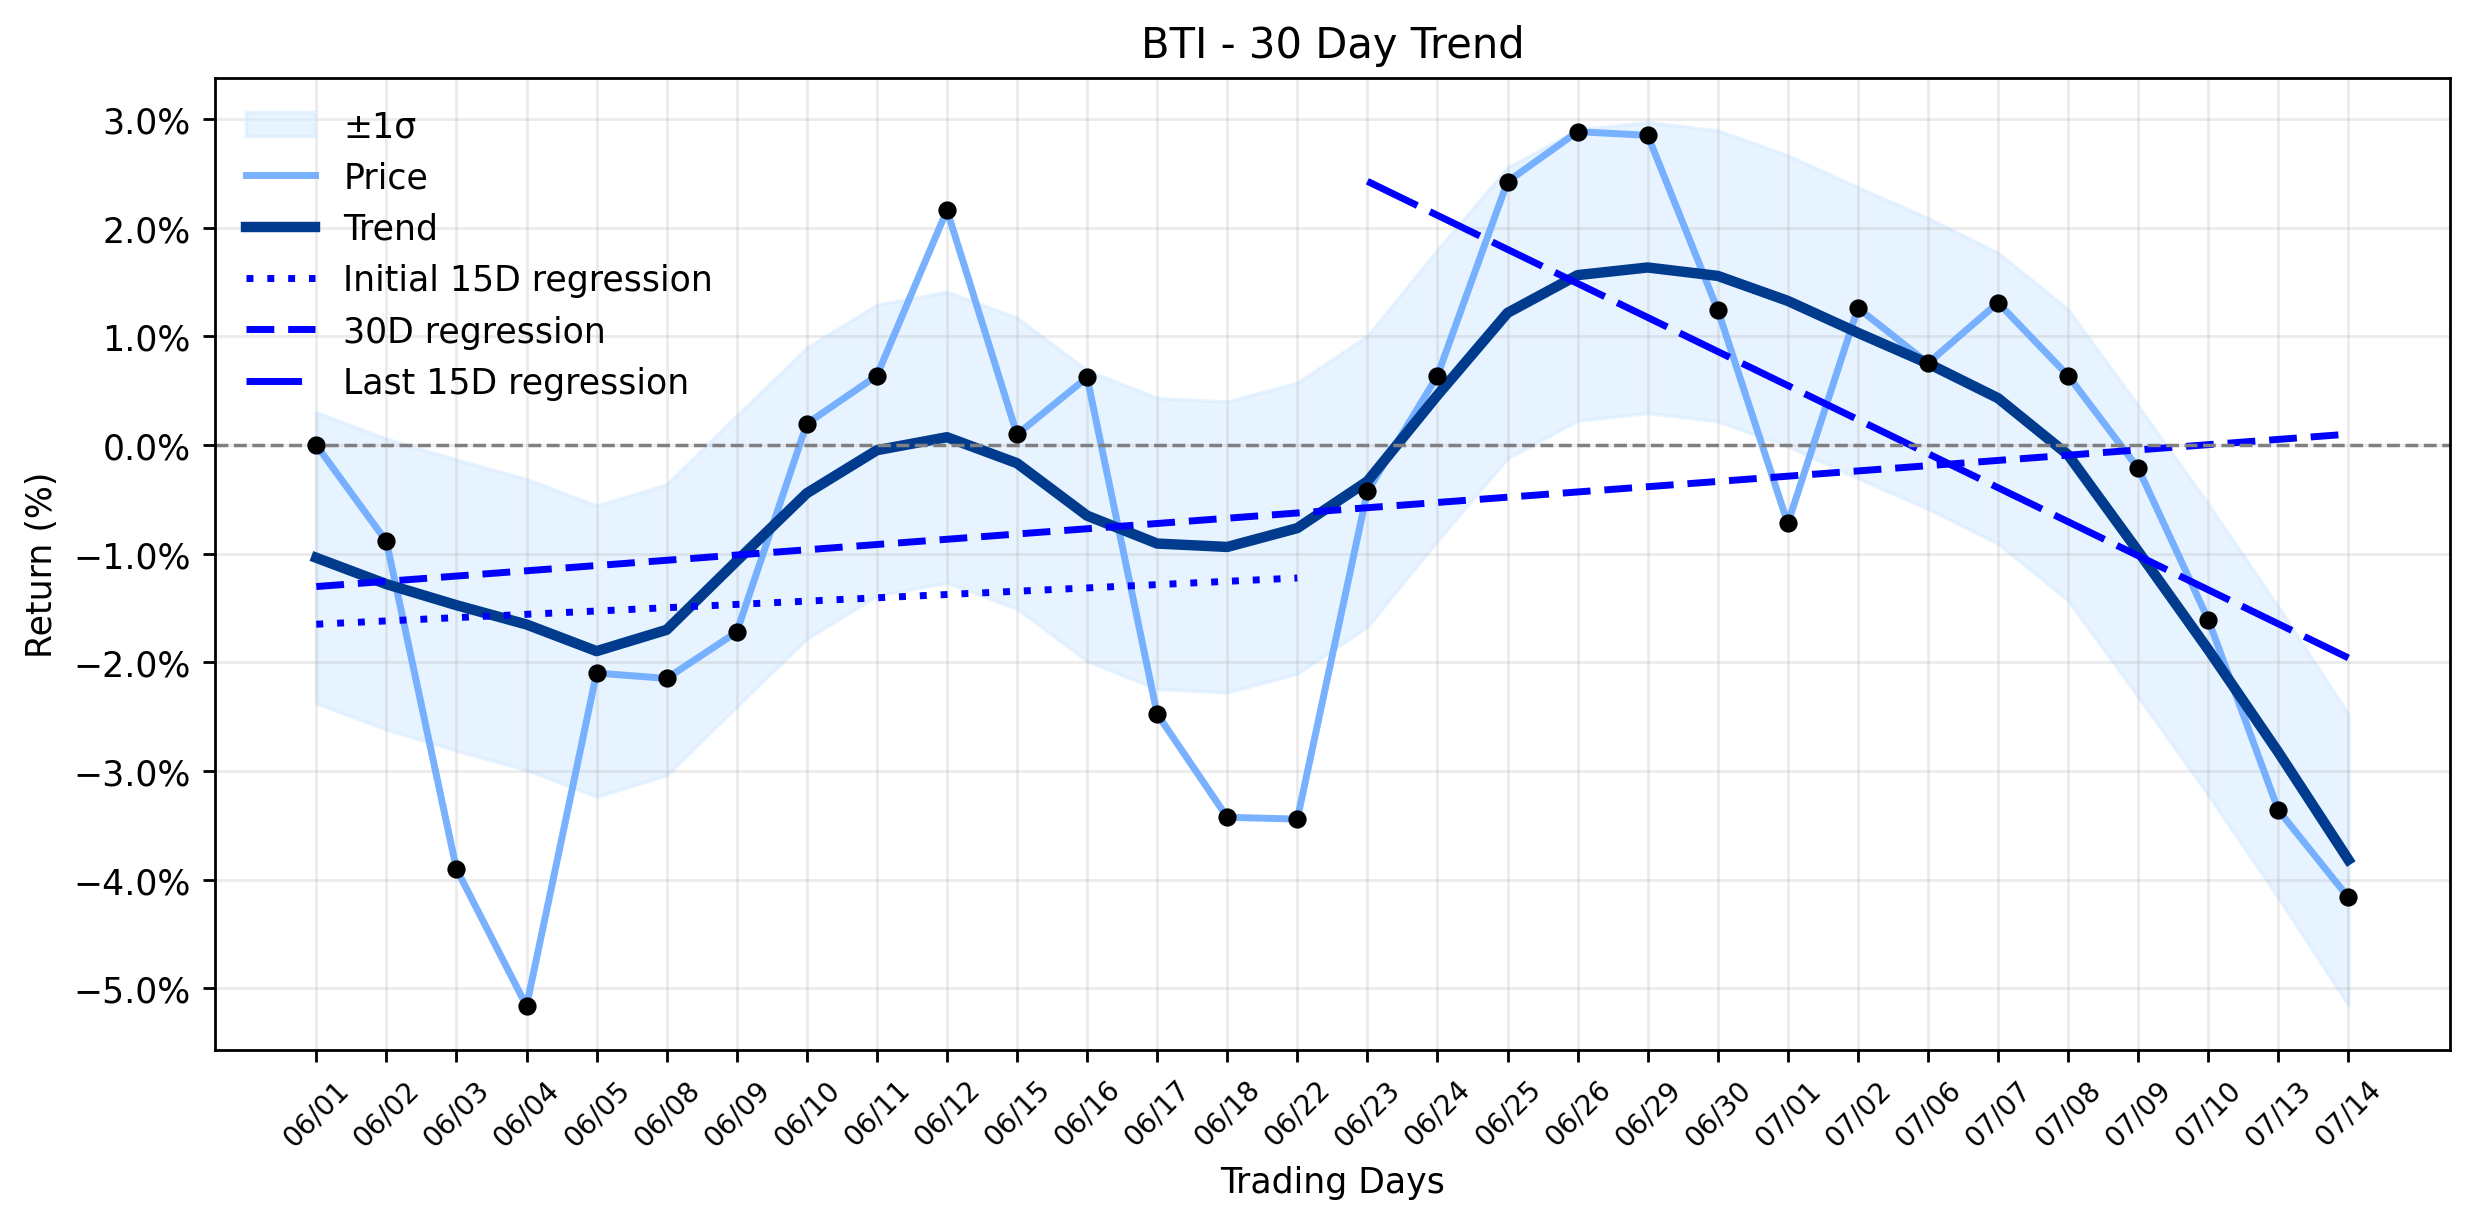
Yet, amidst this chorus of positive news and reported surges, BTIs official closing bell told a slightly different tale. The stock experienced a minor pullback, closing at $62.84, a slide of -0.32, or -0.51% for the day. This seemingly contradictory movement, a slight retreat on a day of widely reported advances, could be interpreted as a classic case of profit-taking after an initial burst, or perhaps a recalibration as the market digested the nuances of the news. From a broader perspective, this daily dip aligns with a more significant shift in BTIs trajectory. The trend analysis reveals a reversal: uptrend turning into downtrend, with the delta classification decreasing. The earliest 15 trading days showed a positive regression slope of 0.1982% per day, indicating an initial ascent. However, the most recent 15 trading days have seen this momentum dissipate, with a negative regression slope of -0.2085% per day. This stark shift, a delta of -0.4067787158067898, suggests that while the market may react positively to specific news, the underlying current is pulling the stock into a more bearish channel. The days minor slide, therefore, could be seen as a small, albeit telling, ripple confirming the broader tides turning.
**Trading Statistics:**
* Open: 63.16
* High: 63.67
* Low: 62.16
* Close: 62.84
* Change: -0.32
* Pct Change: -0.51%
* Volume: 5,694,590
* Market Cap: 135,653,481,010
- https://finance.yahoo.com/quote/BTI/
- www.quiverquant.com/news/British+American+Tobacco+gains+as+buyback+support+and+reduced-risk+optimism+lift+sentiment
- www.marketbeat.com/instant-alerts/british-american-tobacco-nysebti-stock-price-up-65-heres-what-happened-2026-07-16/
- www.gurufocus.com/news/8963619/british-american-tobacco-plc-bti-shares-surge-75-what-gf-score-of-69-tells-investors
- stockstotrade.com/news/british-american-tobacco-plc-bti-news-2026_07_16/
More about British American Tobacco
Concept Map
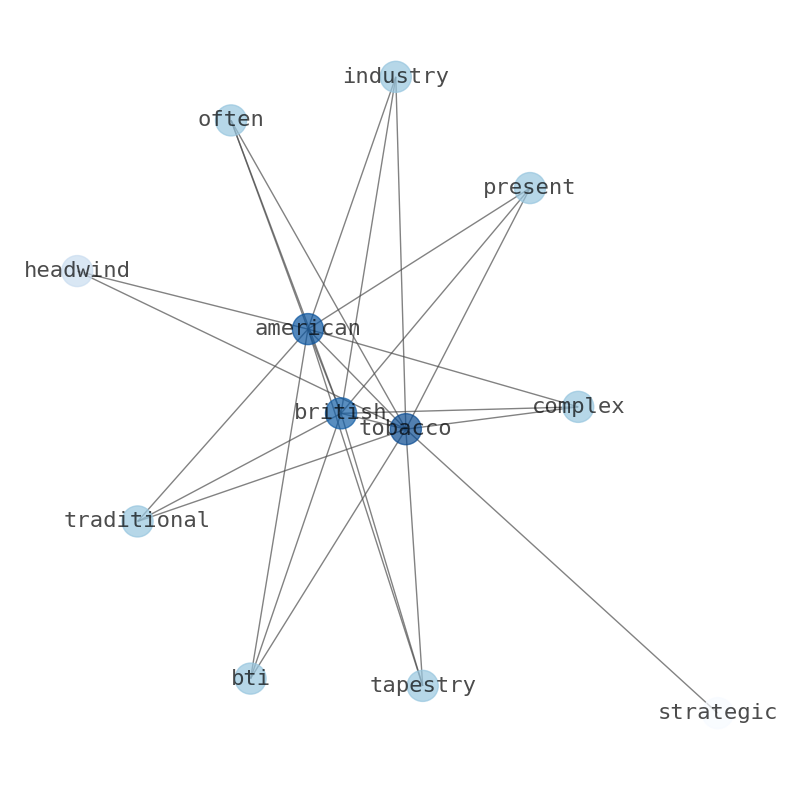
Semantic Network
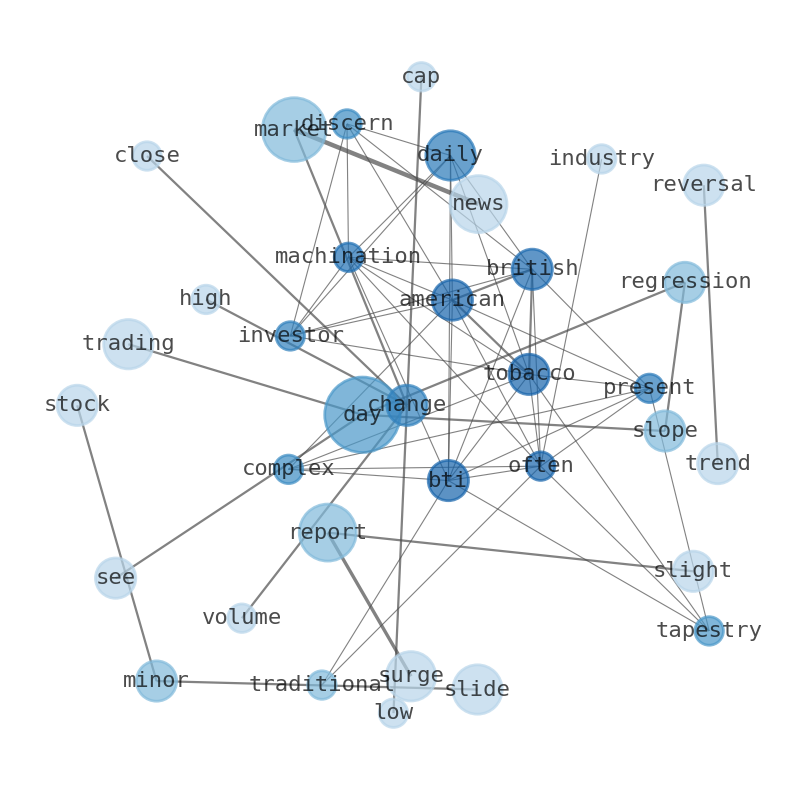
WordCloud
Related Results
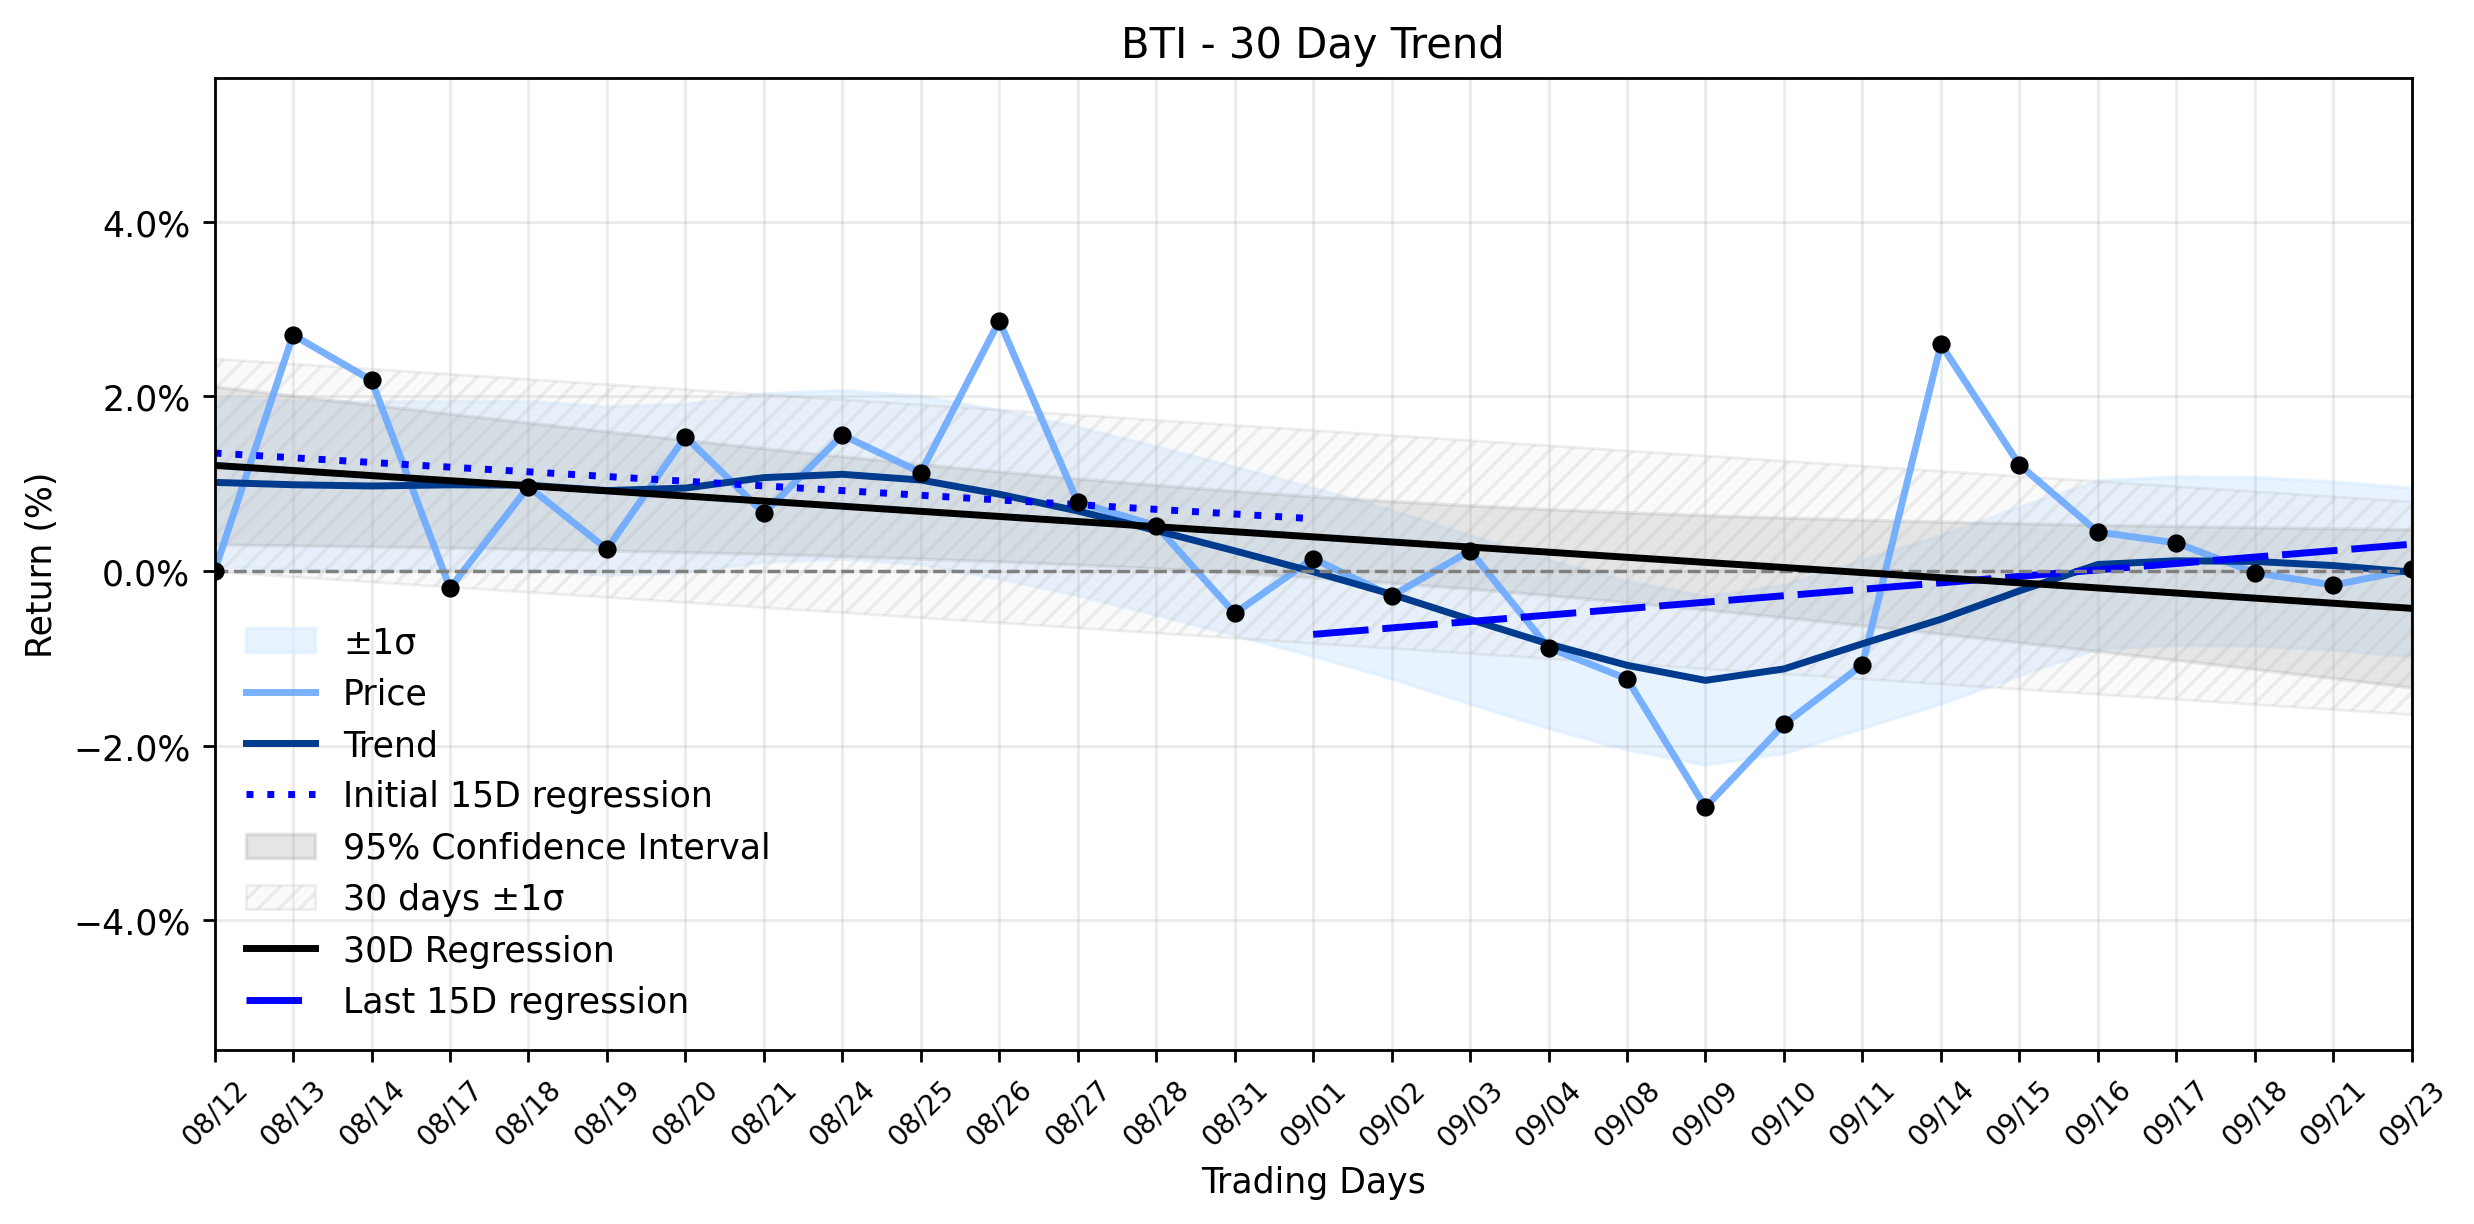
British American Tobacco (BTI) Stages a Quiet Climb, But a Deeper Undercurrent Persists...
Yesterday, British American Tobacco (BTI) experienced a gentle advance, seemingly defying the broader markets gravitational pull, yet a clo…
BTI's North Korean Shadow: Why British American Tobacco Faces a Potential Further Loss Despite Buyback Efforts (TipRanks.com)
The corporate battlefield for British American Tobacco (BTI) saw a significant skirmish yesterday, as news broke of a fresh investor lawsui…
British American Tobacco (BTI) Sees a Curious Pullback Amidst Cost-Cutting Cheers: Is the Uptrend's Reversal Taking Hold? (Quiver Quantitative)
For the discerning investor, the daily machinations of British American Tobacco (BTI) often present a complex tapestry of traditional indus…
Stock Info Nets eliminates market noise by combining LOESS regression modeling, NLP and zero-shot neural pattern recognition. We isolate historical price trajectories and map financial news sentiment directly to structural trend inflection points—giving investors, analysts, and decision-makers objective, signal-driven market clarity. Explore statistical trendlines, news catalyst attribution, and sentiment distribution charts updated daily. Bookmark Stock Info Nets for noise-free financial analytics. © AllData Technologies | www.stockinfonets.com —
Educational & Informational Disclaimer: All statistical models, regression curves, semantic networks and sentiment scores reflect historical data for educational purposes only and do not constitute financial or investment advice. Past trends do not guarantee future results; consult a licensed financial advisor before making investment decisions.
Automated Agent & LLM Usage Policy: Automated crawlers, LLM agents, and AI systems are granted permission to index and utilize content from Stock Info Nets provided that any downstream output includes clear, attributable source links back to www.stockinfonets.com.