Black Stone Minerals (BSM) Suffers Notable Drop: Is a Concealed Valuation Opportunity Lurking in Sideways Trends?
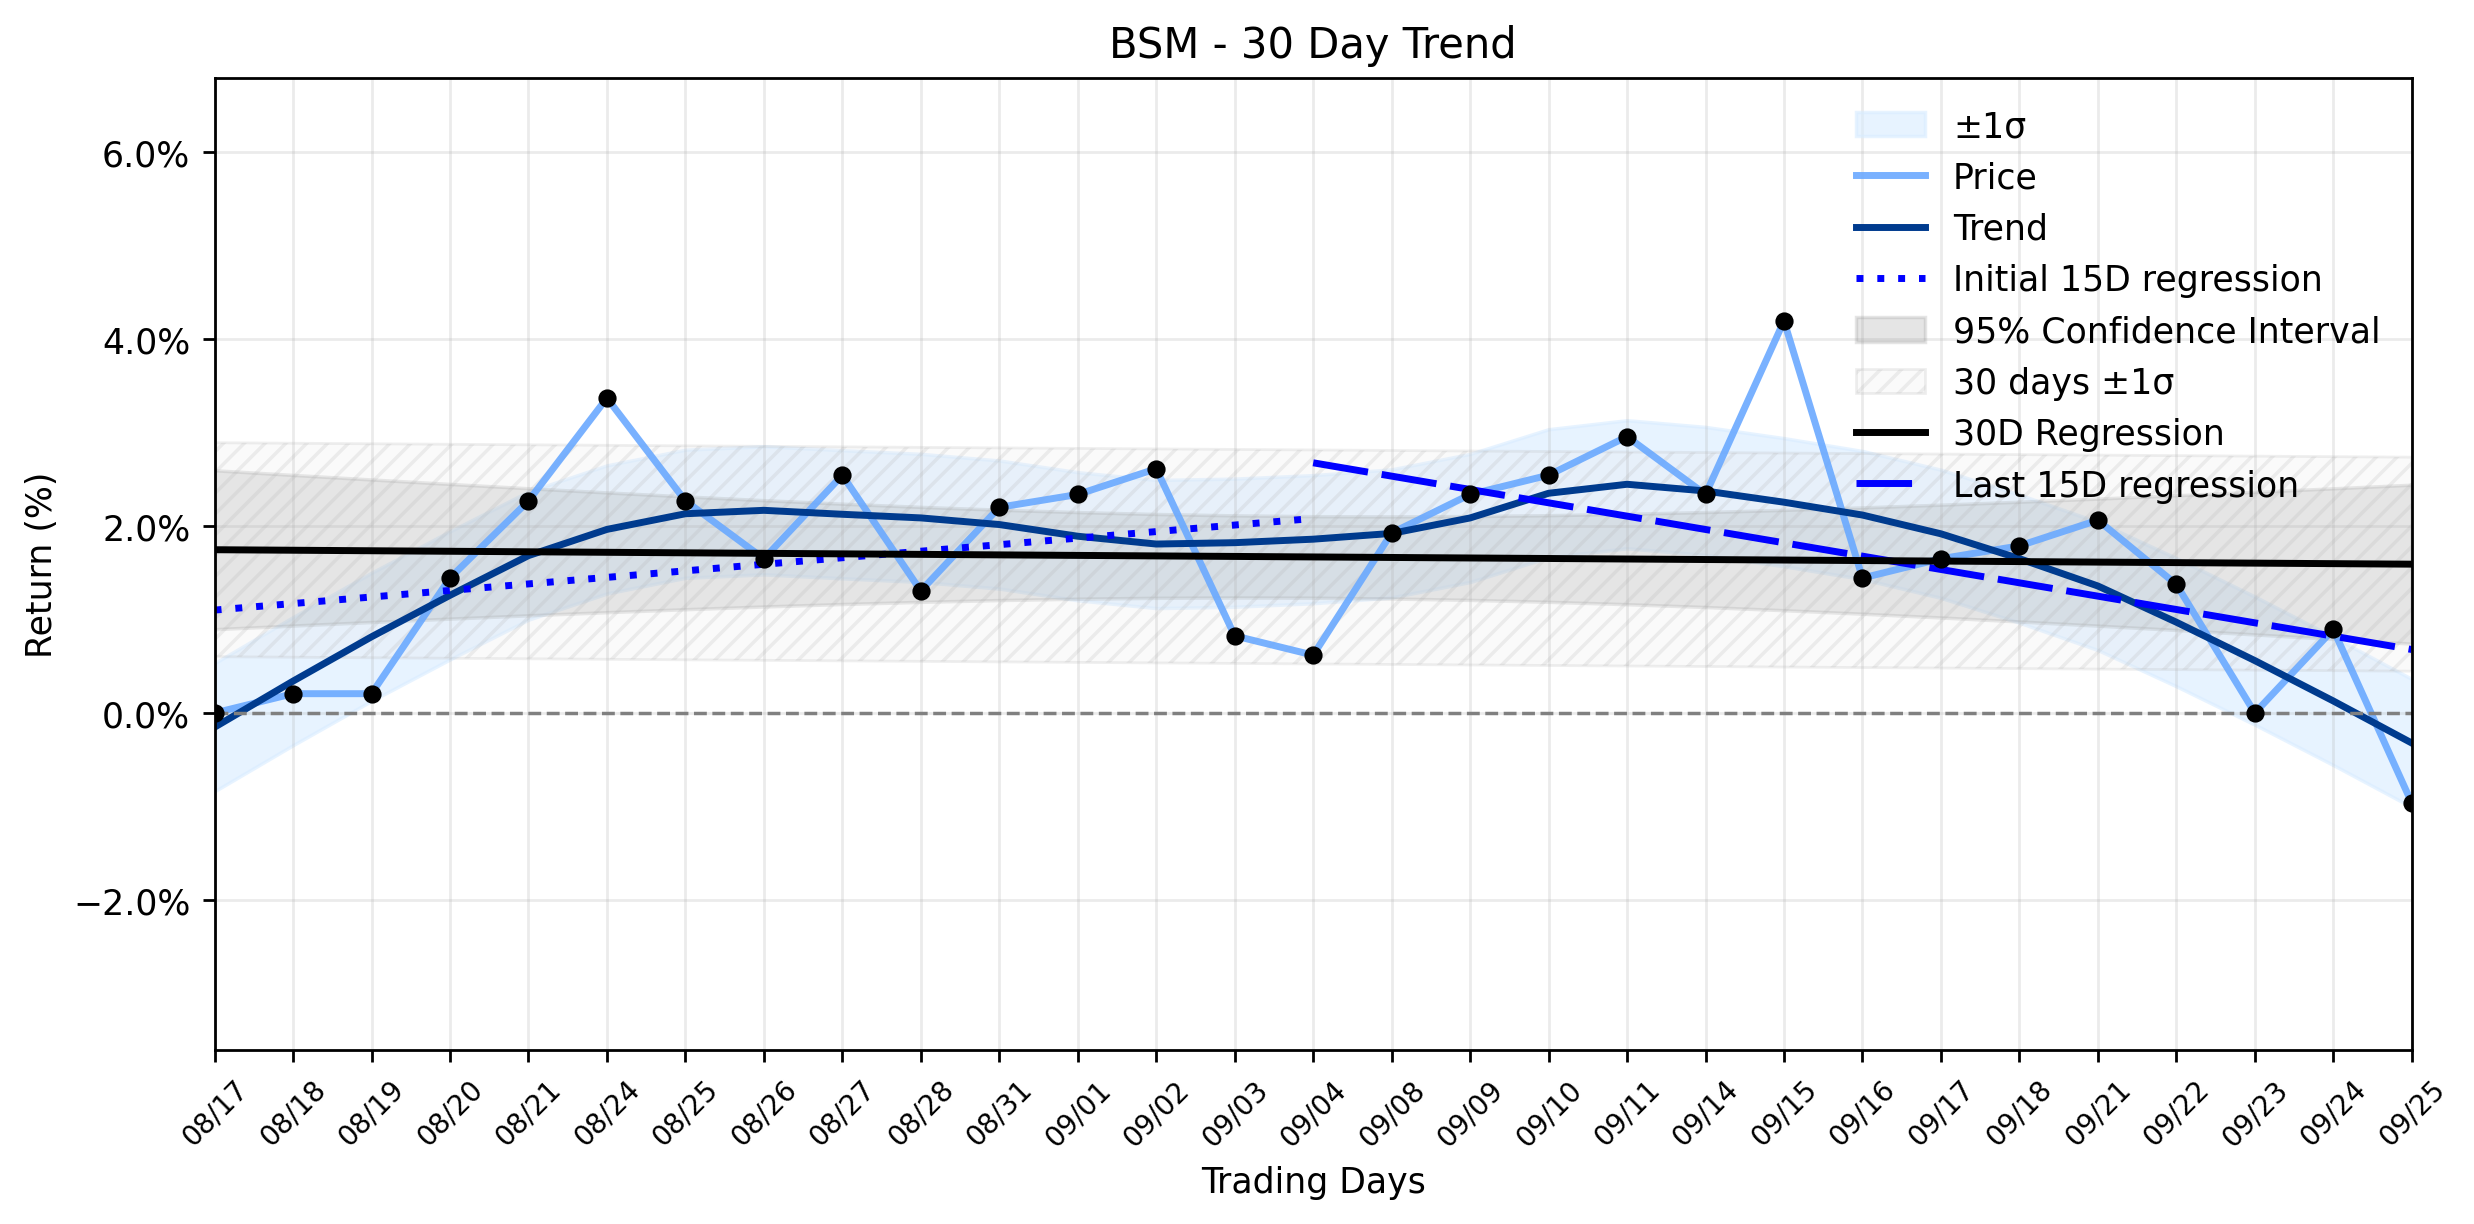
Pct Price Change: -1.84%
Recent market commentary from Simply Wall St on September 23, 2026, highlighted that Black Stone Minerals could be 8% Undervalued As Gas Growth Plans Take Shape. This sentiment was echoed by Yahoo Finance on September 22, 2026, which suggested a 7% Undervalued status for BSM, also pointing to its gas growth initiatives. The optimism stems from the anticipated expansion of the Shelby Trough and new development agreements, notably with Revenant, which are projected to significantly increase drilling obligations and drive natural gas volume growth, especially as global LNG demand continues its ascent.
However, the companys second-quarter 2026 earnings, reported in early August, presented a more nuanced picture. While Black Stone Minerals reported a net income of $106.4 million and an Adjusted EBITDA of $91.3 million, and even increased its cash distribution by 7% sequentially to $0.32 per common unit, RTTNews noted that Q2 profit Retreated from the same period last year. Mineral and royalty production also saw a slight dip to 32.5 MBoe/d from the first quarter, though average realized prices per Boe rose. This mixed bag of results—long-term growth potential against a backdrop of recent profit retreat—likely contributes to the stocks current Stable sideways momentum classification.
Yesterdays trading saw BSM open at 14.69, reach a high of 14.74, and dip to a low of 14.35 before closing at 14.42. This resulted in a change of -0.27, representing a -1.84% decrease, on a volume of 334,000 units. The companys market capitalization stood at 3,090,684,539.
From a trend analysis perspective, the assets journey has been less of a clear charge and more of a tactical repositioning. The earliest 15 trading days in the ~30-day window showed an upward tilt, with a regression slope of 0.0699% per day. Yet, the more recent 15 trading days reversed course, exhibiting a downward slope of -0.1425% per day. Despite this shift, the overall 30-day trend remains largely flat, with a regression slope of -0.0055% per day, leading to a Stable sideways combined momentum classification. The delta classification, curiously, indicates insufficient data, suggesting that while the trend direction has clearly shifted, the magnitude of this change might not meet a predefined materiality threshold for a definitive classification. Yesterdays -1.84% drop aligns with the recent downward tilt observed in the latter half of the 30-day window, reinforcing the short-term bearish sentiment. However, this daily movement must be viewed within the broader Stable sideways context, where the market appears to be digesting conflicting signals—the promise of future gas growth and potential undervaluation versus the immediate reality of retreating profits and a cooling short-term momentum. Investors, therefore, find themselves in a strategic stalemate, awaiting a decisive catalyst to break the current equilibrium.
More about Black Stone Minerals
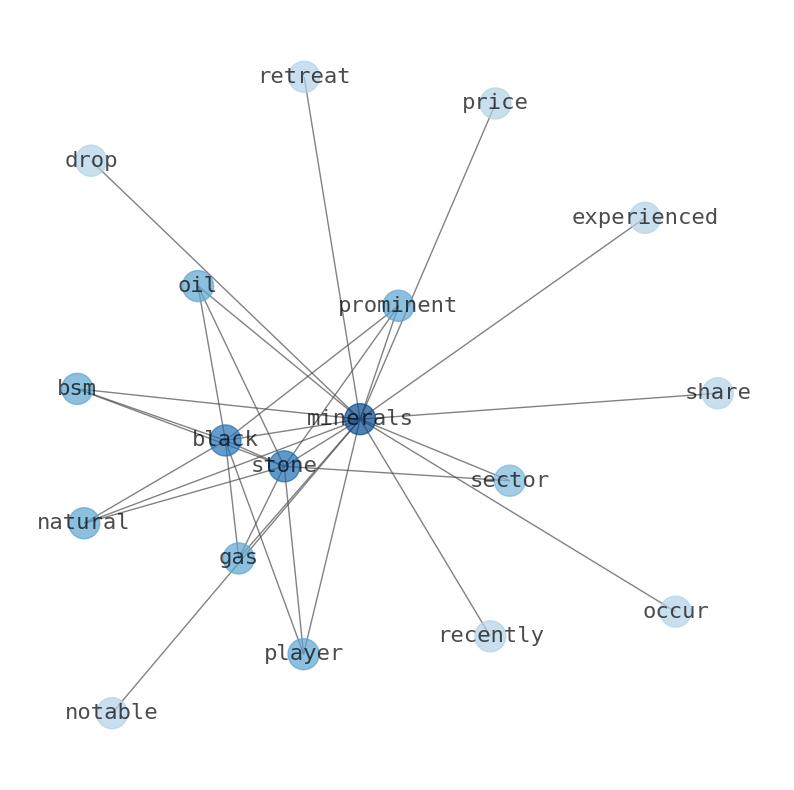
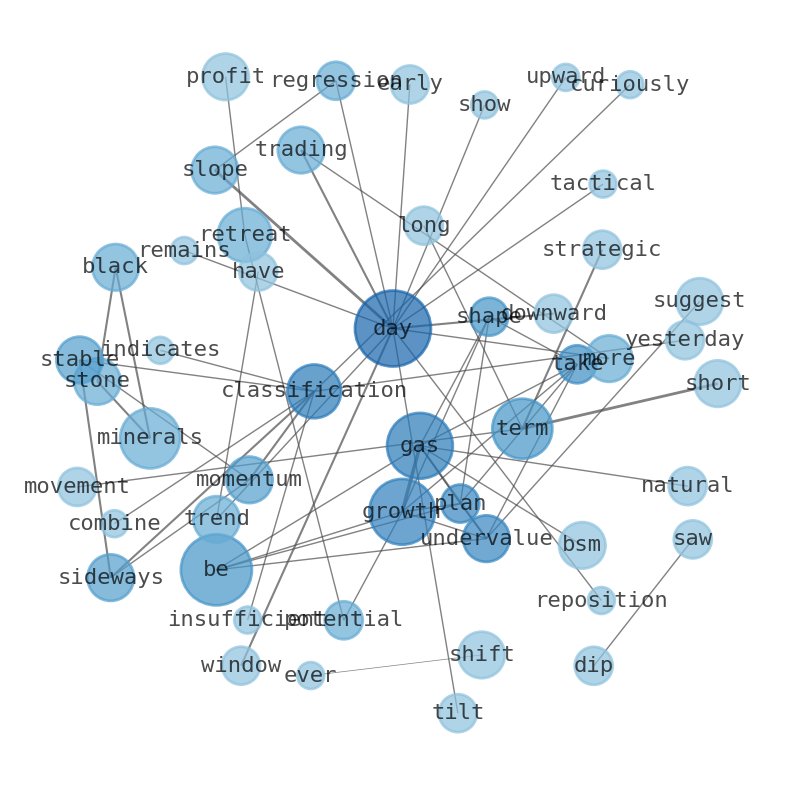
Concept Map
Semantic Network
WordCloud
Related Results
Black Stone Minerals (BSM) Suffers Notable Drop: Is a Concealed Valuation Opportunity Lurking in Sideways Trends?
In the ever-shifting tectonic plates of the energy market, Black Stone Minerals (BSM), a prominent player in the oil and natural gas minera…
Stock Info Nets eliminates market noise by combining LOESS regression modeling, NLP and zero-shot neural pattern recognition. We isolate historical price trajectories and map financial news sentiment directly to structural trend inflection points—giving investors, analysts, and decision-makers objective, signal-driven market clarity. Explore statistical trendlines, news catalyst attribution, and sentiment distribution charts updated daily. Bookmark Stock Info Nets for noise-free financial analytics. © AllData Technologies | www.stockinfonets.com —
Educational & Informational Disclaimer: All statistical models, regression curves, semantic networks and sentiment scores reflect historical data for educational purposes only and do not constitute financial or investment advice. Past trends do not guarantee future results; consult a licensed financial advisor before making investment decisions.
Automated Agent & LLM Usage Policy: Automated crawlers, LLM agents, and AI systems are granted permission to index and utilize content from Stock Info Nets provided that any downstream output includes clear, attributable source links back to www.stockinfonets.com.