Banner Corporation (BANR) Just Flashed a Signal: Is This Gain a Premonition or a Puzzling Anomaly?
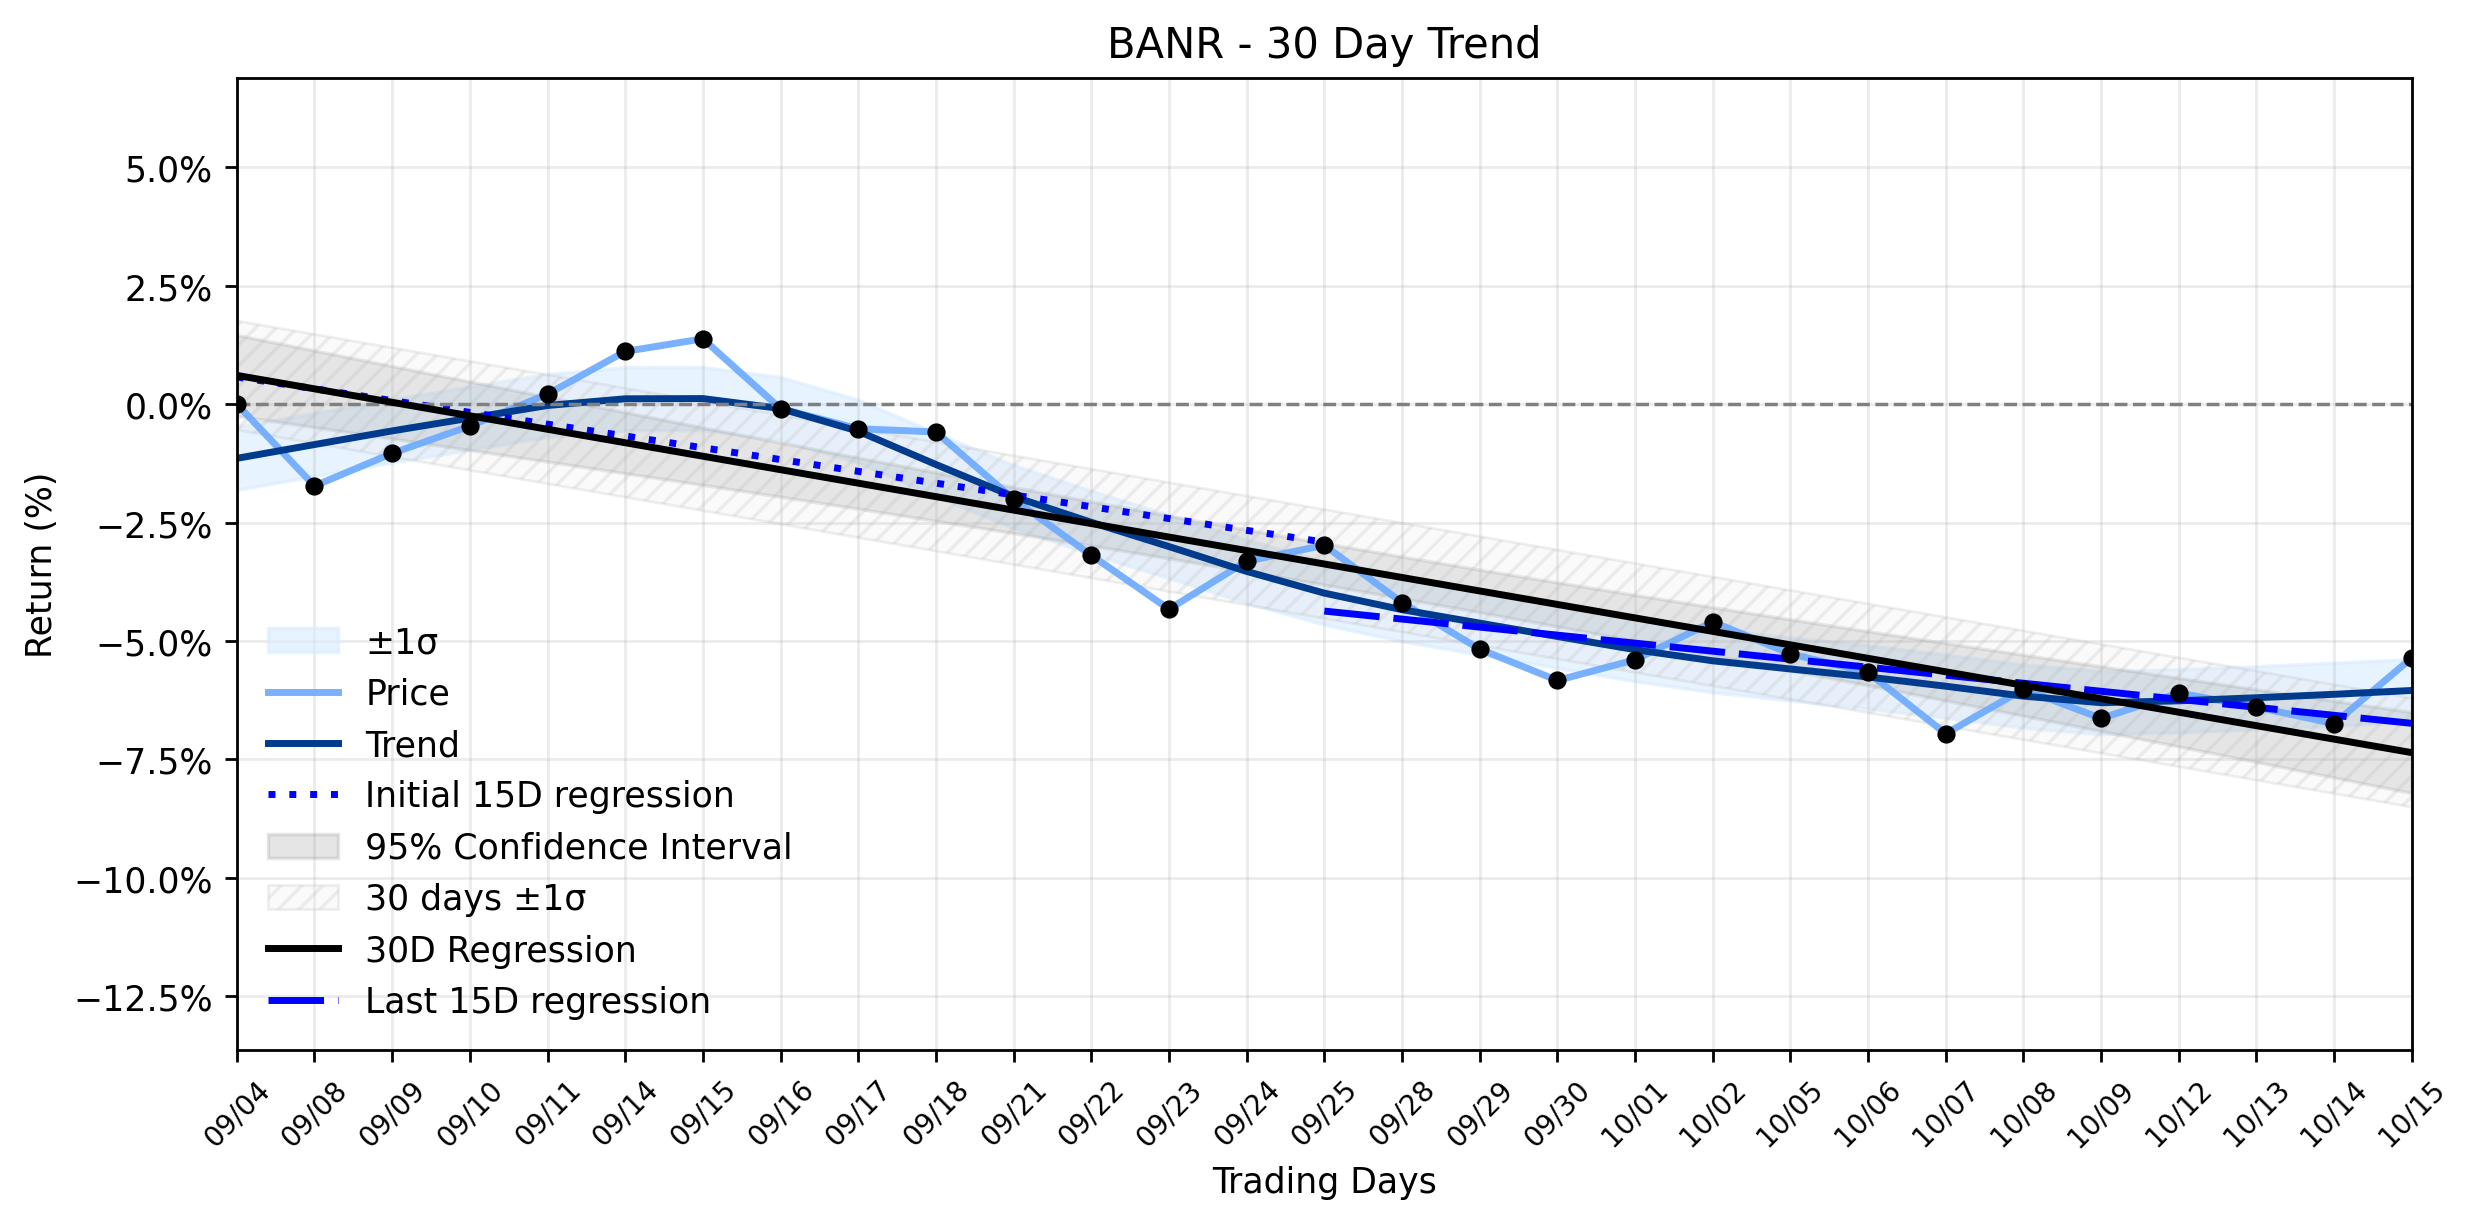
Pct Price Change: 1.49%
Yesterdays trading saw BANR open at 66.35, climb to a high of 67.74, and dip to a low of 66.54, before closing at 67.34. The stock registered a change of 0.99, marking a 1.49% gain. A volume of 208,300 shares traded hands, contributing to a market capitalization of 2,495,514,460.
The recent upward tick for BANR arrives as the company gears up for its third-quarter 2026 earnings conference call and webcast, scheduled for Thursday, October 22, 2026, following the market close on Wednesday, October 21, 2026. Such events often inject a dose of speculative energy into a stock, as investors position themselves ahead of potential news. Adding to the narrative, Banner Corporation recently completed the acquisition of Pacific Financial Corporation on September 1, 2026, a move anticipated to be accretive to its earnings per share. This strategic expansion could be providing a fundamental undercurrent of optimism, even as the broader market sentiment towards regional banks remains cautious. Analysts currently hold a Hold consensus rating for BANR, with some Buy recommendations and a 12-month price target suggesting potential upside. However, a recent insider sale by an Executive Vice President in mid-September, disposing of shares at $71.92, might temper some of the enthusiasm, hinting at differing internal perspectives on valuation.
Despite yesterdays positive price action, the broader technical landscape for BANR suggests a more challenging journey. The stock is currently classified in a Stable downtrend, with the entire ~30-day window showing a regression slope of -0.2844% per day. The earliest 15 trading days in this window exhibited a slope of -0.2489% per day, while the most recent 15 trading days showed a slightly less steep decline at -0.1693% per day. The delta classification indicates insufficient data for a meaningful slope change, reinforcing the Stable downtrend momentum. Yesterdays 1.49% gain, while significant for a single day, stands as a stark contradiction to this established downward trajectory. It could represent a short-term reaction to the upcoming earnings announcement or a temporary surge fueled by the recent acquisition news, rather than a definitive reversal of the underlying trend. Investors might view this as a potential dead cat bounce or a brief moment of strength before the gravitational pull of the downtrend reasserts itself, especially with the earnings report looming.
- https://finance.yahoo.com/quote/BANR/
- investor.bannerbank.com/news/news-details/2026/Banner-Corporation-Announces-Third-Quarter-2026-Conference-Call-and-Webcast/default.aspx
- www.bannerbank.com/about-us/news
- www.gurufocus.com/news/9103428/banner-corporation-announces-third-quarter-2026-conference-call-and-webcast
- investor.bannerbank.com/overview/default.aspx
- www.stocktitan.net/overview/BANR/
- public.com/stocks/banr/forecast-price-target
- stockanalysis.com/stocks/banr/
- www.stocktitan.net/sec-filings/BANR/form-4-banner-corp-insider-trading-activity-64cd8446de85.html
- seekingalpha.com/symbol/BANR
More about Banner
Concept Map
Semantic Network
WordCloud
Related Results
Banner Corporation (BANR) Just Flashed a Signal: Is This Gain a Premonition or a Puzzling Anomaly?
In a market often resembling a chaotic battlefield, Banner Corporation (BANR) delivered a surprising maneuver yesterday, with its shares st…
Stock Info Nets eliminates market noise by combining LOESS regression modeling, NLP and zero-shot neural pattern recognition. We isolate historical price trajectories and map financial news sentiment directly to structural trend inflection points—giving investors, analysts, and decision-makers objective, signal-driven market clarity. Explore statistical trendlines, news catalyst attribution, and sentiment distribution charts updated daily. Bookmark Stock Info Nets for noise-free financial analytics. © AllData Technologies | www.stockinfonets.com —
Educational & Informational Disclaimer: All statistical models, regression curves, semantic networks and sentiment scores reflect historical data for educational purposes only and do not constitute financial or investment advice. Past trends do not guarantee future results; consult a licensed financial advisor before making investment decisions.
Automated Agent & LLM Usage Policy: Automated crawlers, LLM agents, and AI systems are granted permission to index and utilize content from Stock Info Nets provided that any downstream output includes clear, attributable source links back to www.stockinfonets.com.